Paleobiology, 33(2), 2007, pp. 182–200
Increasing hierarchical complexity throughout the history of life: phylogenetic tests of trend mechanisms Jonathan D. Marcot and Daniel W. McShea
Abstract.—The history of life is punctuated by a number of major transitions in hierarchy, defined here as the degree of nestedness of lower-level individuals within higher-level ones: the combination of single-celled prokaryotic cells to form the first eukaryotic cell, the aggregation of single eukaryotic cells to form complex multicellular organisms, and finally, the association of multicellular organisms to form complex colonial individuals. These transitions together constitute one of the most salient and certain trends in the history of life, in particular, a trend in maximum hierarchical structure, which can be understood as a trend in complexity. This trend could be produced by a biased mechanism, in which increases in hierarchy are more likely than decreases, or by an unbiased one, in which increases and decreases are about equally likely. At stake is whether or not natural selection or some other force acts powerfully over the history of life to drive complexity upward. Too few major transitions are known to permit rigorous statistical discrimination of trend mechanisms based on these transitions alone. However, the mechanism can be investigated by using ‘‘minor transitions’’ in hierarchy, or, in other words, changes in the degree of individuation of the upper level. This study tests the null hypothesis that the probability (or rate) of increase and decrease in individuation are equal in a phylogenetic context. We found published phylogenetic trees for clades spanning minor transitions across the tree of life and identified changes in character states associated with those minor transitions. We then used both parsimony- and maximum-likelihood-based methods to test for asymmetrical rates of character evolution. Most analyses failed to reject equal rates of hierarchical increase and decrease. In fact, a bias toward decreasing complexity was observed for several clades. These results suggest that no strong tendency exists for hierarchical complexity to increase. Jonathan D. Marcot* and Daniel W. McShea. Department of Biology, Duke University, Box 90338, Durham, North Carolina 27708-0338. E-mail:
[email protected] and
[email protected] *Present address: Paleontology Section, University of Colorado Museum, UCB 265, Boulder, Colorado 80309 Accepted:
8 December 2006
Organisms are hierarchical, consisting of nested associations of individuals among individuals (Wimsatt 1974, 1994; Salthe 1985; Valentine and May 1996). Free-living eukaryotic cells are composed of former prokaryotic cells, multicellular individuals are composed of eukaryotic cells, and colonies are composed of multicellular individuals. In evolution, it is clear that the hierarchical maximum—the degree of nestedness of the hierarchically deepest organism in existence—has increased over time, most obviously in the transitions from prokaryote to eukaryotic protist, to multicellular individual, and then to colony (McShea 2001a). The trend is significant for several reasons. First, these transitions have led to evolutionary novelties, allowing organisms to take advantage of previously unexploited resources (Knoll and Bambach 2000), which in turn have led to spectacular evolutionary ra䉷 2007 The Paleontological Society. All rights reserved.
diations such as those of the protists and metazoans. Also, hierarchy is one of two components in the biological revolutions that Maynard Smith and Szathma´ry (1995) have called the ‘‘major transitions’’ in evolution (the other being change in the way information is transmitted from generation to generation). Further, a trend in hierarchy may be the main source of the widespread intuition that complexity, in some sense, increases in evolution (McShea 1996). And finally, this is currently one of the best documented macroevolutionary trends. Indeed, to our knowledge, it is the only trend in a well-defined feature of organisms that has been formally documented at the largest scale, life as a whole over its entire history (McShea 2001a). Body size obviously increases as well (Bonner 1988), at least partly as a consequence of the hierarchy trend (because higher-level individuals tend be larger 0094-8373/07/3302-0002/$1.00
HIERARCHICAL EVOLUTION
183
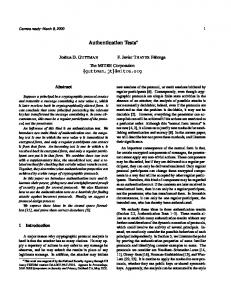
FIGURE 1. Schematic representations of two alternative mechanisms underlying the increase in maximum hierarchical structuring. Each triangle represents the diversification of a group at a given level. (Differences in shading among triangles are for visual clarity and have no other significance.) Arrows show transitions from one major level to an adjacent one. Black, right-pointing arrows show major upward transitions (increases), i.e. the origin of groups at higher levels from ancestors at lower levels, and gray, left-pointing arrows show major reversals or downward transitions (decreases). For example, the bold arrow in A shows the origin of a group of highly individuated multicellular organisms from a single-celled ancestor; this particular transition marks the advent of (highly individuated) multicellularity, and therefore corresponds to a rise in the maximum for life as a whole. (The dotted line in A represents the overall trajectory of the maximum.) In A, all arrows point right, meaning that change is biased, with increases more probable than decreases. In B, change is unbiased, meaning that increases and decreases are equally probable.
than lower-level ones). And there are other promising candidates for longest-term trends, such as energy intensiveness (Vermeij 1987) and absolute fitness (Van Valen 1984). But only the hierarchy trend has been formally demonstrated at this scale. The trend is well known, but the processes or mechanisms underlying it are not. In particular, the question of whether hierarchical change is biased toward increasing nestedness has been central in the discussion of possibilities (McShea 1996, 2001b; Gould 1996). If the trend were the result of biased change, evolutionary increases would be more probable than decreases. For hierarchy, this would mean that, for example, the number of instances in which a solitary multicellular organism evolved to form a colonial individual outnumbered those in which the members of a colony returned to a solitary existence in the course of their evolution. And the same would be true for other transitions across the hierarchy spectrum. Figure 1A shows a hypothetical trend resulting from such biased change. In contrast, if change were unbiased, increases and decreases would be equally likely, for example
if solitary arises from colonial just as often as the reverse. A trend occurs because, at the lowest level, further decrease is blocked by a boundary, a lower limit on hierarchical structure. For organisms, the natural candidate for a lower limit is the level of the prokaryotic cell. Bacteria did not arise as associations of lowerlevel living organisms, so far as we know, nor has any lower-level organism arisen from any of a bacterium’s components. If so, then from a starting point at the bacterial level, hierarchical structure could only have increased. (Even if bacteria are not the lowest level—perhaps it is viruses, if they are alive—presumably some lower limit exists.) In this scenario, the trend is simply an indirect result of the increase in species diversity, producing a diffusive or passive spread of species away from the hierarchy lower limit. Figure 1B shows a trend produced by unbiased change. With hierarchy on the horizontal axis, the vertical dashed line on the left marks the putative lower limit, or what has also been called a ‘‘left wall’’ (Gould 1996). At issue in the biased-unbiased distinction is whether or not this fundamental trend has
184
JONATHAN D. MARCOT AND DANIEL W. MCSHEA
been powered in some sense—whether there are forces at work in evolution tending to drive hierarchy up. Biased change would be expected if, for example, organisms with greater hierarchical depth enjoyed some selective advantage (Knoll and Bambach 2000). Perhaps hierarchical organization is favored because of the opportunities it offers for division of labor, through differentiation of component lower-level individuals (e.g., Bonner 1988). There are other possibilities. It might be that losses of hierarchical structure are prevented by constraints or opposed by selection. The suggestion has been made that lower-level individuals tend, with time, to become integrated and more dependent on the upper-level individual they constitute, making a return to a solitary existence more difficult (Szathma´ry and Maynard Smith 1995; McShea 2002). Or it could be that hierarchy is actually driven upward by constraints of some kind, that some unknown feature of the developmental process tends to produce more increases than decreases. No precise constraint-driven mechanism has been articulated (although see Salthe 1993), but it cannot be ruled out. (A constraint-driven mechanism has been offered for complexity in another sense, number of part types [McShea 2005a,b].) The various rationales for biased change might seem so reasonable, so compelling, as to make the alternative, an unbiased mechanism, seem improbable. Unbiased change might also seem unlikely for empirical reasons. For the highest-level transition, multicellular individual to colonial organism, reversals are known (e.g., several clades of bees [see Wcislo and Danforth 1997; Danforth et al. 2003]). But few, if any, reversals are known at the lower levels. Single-celled protists have combined to produce multicellularity at least 13 times (Bonner 1998). But there are no widely accepted cases of single-celled protists arising from multicellular individuals, at least not from the most highly individuated ones like land plants and metazoans (but see McShea 2001b). Also, bacteria have joined to produce a well-individuated higher-level organism, the eukaryotic cell, just once in the history of life. And so far as we know, the reverse has never occurred.
No solitary bacterium has ever arisen from a eukaryotic cell. Nevertheless, an unbiased mechanism is plausible. The main reason is that the modern prokaryotic and protistan fauna is not well known, and therefore we cannot dismiss the possibility that major downward transitions have occurred but have not yet been discovered. In other words, it could be that the protists arising from a hierarchical reduction of multicellular eukaryotes, and the prokaryotes arising from a hierarchical reduction of protists, are out there, waiting to be recognized for what they are by molecular or other phylogenetic analyses. Further, relatively few major upward transitions are known, and therefore few downward transitions would need to be discovered to offset the upward ones, to produce the balance predicted by an unbiased mechanism. (For further discussion, see McShea 2001b.) Given the limited number of major transitions known, testing for unbiased versus biased change is not straightforward. One solution is to devise a higher-resolution hierarchy scale on which we can measure not only the jumps from one major level to another, but smaller, incremental changes in hierarchy as well. Such a scale would capture not only Maynard Smith and Szathma´ry’s ‘‘major transitions,’’ but ‘‘minor transitions’’ in hierarchical evolution as well (McShea 2001b). We explain such a scale in the next section. It reveals minor transitions in hierarchy to be frequent enough to make statistical comparison of numbers of increases and decreases meaningful, and to make empirical investigation of the underlying trend mechanism possible. Then, we use a phylogenetic approach to analyze the patterns of minor transitions in hierarchical structure in a number of clades, distributed across the hierarchy spectrum, to test the null hypothesis that hierarchical change is unbiased. The higher-resolution scale also enables us to pose higher-resolution questions about trend mechanism. In particular, it could be that driving forces are absent in certain minor transitions but present in others. And we test for this as well. We must point out that the distinction between unbiased and biased hierarchical
HIERARCHICAL EVOLUTION
change is a crude one, and also that it does not cover the entire range of possible trend mechanisms. First, Sterelny and Griffiths (1999) and Knoll and Bambach (2000) have raised the possibility that hierarchical evolution is unbiased, on the whole, but that diffusion toward higher levels is blocked at various points on the hierarchy scale by strong (but ultimately penetrable) ‘‘right walls,’’ representing the difficulties involved in achieving the next-level hierarchical organization. For example, they argued that hierarchical evolution of early prokaryotes was blocked by a right wall, finally breached only after more than a billion years of prokaryotic experimentation by the evolution of the eukaryotic cell (from an association of prokaryotes). Thus, biased and unbiased change mechanisms are not necessarily mutually exclusive of one another, and both may be acting at different levels within the hierarchical spectrum. Second, the unbiased-biased distinction would miss the mechanistic action, so to speak, if the trend were the result of species selection, rather than passive diffusion or any upward drive (Wright 1967; Wagner 1996). For example, it could be that greater hierarchical structure is associated with higher speciation rates, producing an increasing trend without any asymmetry in rates of hierarchical change at all. Higher-level organisms have a greater depth of parts within parts, and the resulting combinatorics could give them greater potential for combining parts in different ways, to produce a greater variety of adaptive designs (McShea and Changizi 2003). We cannot test any of these alternative mechanisms with the present data, and therefore this study should be understood as an attempt to address only a subset of the possibilities—a first pass at understanding the mechanism underlying the hierarchy trend. Materials and Methods A Hierarchy Scale We follow the approach proposed by McShea (2001a,b), and applied by McShea and Venit (2002). We review it here but refer the reader to these papers for more details. Fundamental to this approach is the decomposition of each major transition, from one level of
185
nestedness to the next, into a series of minor transitions. The thinking is that while the joining of lower-level individuals to form a higher-level entity might seem like an all-or-none phenomenon—either lower-level entities are joined or they are not—the ‘‘individuation’’ of the higher-level entity is a matter of degree. Individuation refers to the degree to which the higher level functions as a unified whole, rather than a collection of independent lower-level units (Boardman and Cheetham 1973). Thus, both a seaweed and a seal occupy the same major hierarchical level, in that they are both associations of eukaryotic cells, but the seal is more individuated than the seaweed at the multicellular level. The signs of this greater individuation in the seal include (1) the (apparently) greater degree of integration or connectedness among its parts; (2) the greater degree of differentiation among its parts or greater number of part types (e.g., cell types); and (3) the interpolation of intermediate hierarchical structures (tissues and organs) between the lower and upper levels, between the cell and the seal. We treat these three features—connectedness, differentiation, and intermediate-level parts—as indicators of degree of individuation, and thus the minor transitions are evolutionary changes in the intensity or number of these indicators. In evolutionary thought today, the presumption would be that individuation is produced by natural selection. In this view, a major transition would be the transformation of a group of lower-level individuals into a higher-level individual, or in other words, an evolutionary move from one ‘‘level of selection’’ (sensu Brandon 1999) to the next. And the minor transitions would be the changes in the phenotypic indicators of the intensity and/or duration of selection on the higher-level individual. The more intensely or the longer selection has acted on the higher-level individual, the greater the degree of individuation. Importantly, no particular route to individuation is demanded by this assumption. For example, a loss of individuation may be marked in one lineage by a decrease in differentiation, in another by a decrease in number of intermediate-level parts, and perhaps in a third by both. Also, the concern here is with individ-
186
JONATHAN D. MARCOT AND DANIEL W. MCSHEA
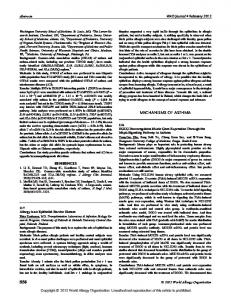
uation at the highest level only, and its degree of individuation is a function of properties at the next level down. For a multicellular organism, for example, its individuation is partly a function of differentiation among cells, i.e., of cell types, not differentiation among parts within a cell, i.e., organelles. And for a marine colony, its individuation is a function of the differentiation among its polyps or zooids, not that among its cells. Indeed there is some reason to think that increases at higher levels may be accompanied by decreases in individuation at lower levels. Cells in well-individuated multicellular organisms have fewer part types than solitary protists and poorly individuated cell aggregates (McShea 2002). In any case, these lower-level losses are not taken into account here. The minor transitions are illustrated in Figure 2. The box at the center (Fig. 2A) represents a solitary individual at some arbitrary major level: a prokaryotic cell, a eukaryotic cell, or a multicellular individual. The box represents the culmination of hierarchical evolution from the next lower level. In other words, it is an association of lower-level individuals (not shown), and we shall assume that it is a highly individuated association. It is also the starting point for the evolution of individuals at the next higher level. The other icons in the figure show the minor transitions, the increases in individuation, that could be involved in the transition to that next level. Starting at A, a move in evolution toward the upper left, B, would mark a minor transition, in particular an increase in integration or connectedness. For example, a transformation in evolution of from a solitary protist, like Chlamydomonas, to a simple undifferentiated association of cells—perhaps a colonial alga, like Gonium— would be a minor transition. Note that our concept of connectedness does not necessarily imply direct physical contact between lowerlevel individuals, only that there is some kind of connection between them (perhaps producing correlations between their behaviors, as chemical connections between individuals do in a social-insect society). Another minor transition would be a move from B across to C, an increase in differentiation, or an increase in the number of types of lower-level individuals
FIGURE 2. Minor transitions in hierarchical structure. Schematic representation of the minor transitions in hierarchical structure used in this study: A solitary, lowerlevel individual (A), an aggregation of monomorphic lower-level individuals (B), a differentiation of lowerlevel individuals (filled and unfilled circles correspond to different lower-level individuals) (C), a differentiated aggregate in which lower-level entities have become segregated into intermediate-level structures (D), and an aggregate of lower-level individuals, one of which has become elaborated into an intermediate-level structure (large triangle) (E). Dashed lines pictorially delimit the higher-level individual and do not necessarily indicate a real capsule surrounding those at the lower level. Arrows indicate that minor transitions can occur between any two levels, and do not necessarily follow a linear, stepwise progression. Note, however that some states logically entail the existence of others. For example, the origin of an individual with intermediate-level structures represented by D necessarily requires the evolution of differentiation, as well as intermediate parts. The illustrated entities with intermediate-level parts are not exhaustive and merely represent two possibilities.
that constitute the higher-level individual. The transformation of an undifferentiated Goniumlike alga, with a single cell type, to Volvox, with two cell types, would be a minor transition of this sort. In a social insect species, the origin of morphological differentiation, castes, would be such a minor transition. A third kind of minor transition would be a change in the number of intermediate-level parts, or structures that are intermediate between the lower-level individual and the higher-level one (Fig. 2D,E). These are parts that are composed of multiple lower-level individuals but are still subsets of the higher-level individual. They can take at least two different forms. The first are collaborations of a number of lower-level individuals, whether of the
HIERARCHICAL EVOLUTION
same or different types (Fig. 2D depicts one of different types). In Volvox, the outer shell of flagellated cells is a collaboration of lower-level individuals and is therefore an intermediate-level part. At a higher major level, in an ant colony, teams of workers are collaborations of this sort. An example is team nest construction in weaver ants. In this process, one group of workers pulls the sides of leaves together, while another group holds silk-producing larvae above the seam to join the sides (Anderson and McShea 2001). The team, consisting of multiple lower-level individuals performing different subtasks, is an intermediate-level part. The second type of intermediate part is a single hypertrophied or highly elaborated lower-level individual (Fig. 2E). In a eukaryotic protist, the cell body is an intermediate part in that it arose historically as a single, and now enlarged and highly elaborated, archaebacterium. The queen in an ant colony is an intermediate-level part. Only these two intermediate part types were included in this study, but others are theoretically possible, for example, large, inanimate structures generated by one or more lower-level individuals. In an ant colony, the nest itself is such a part. The double-headed arrows in the figure represent the fact that transitions can theoretically occur from any state to any other. However, some states are logically dependent upon one another. Take, for example, the transition in Figure 2 from a solitary individual (Fig. 2A) to a higher-level individual with a collaboration of differentiated lower-level individuals (Fig. 2D). In addition to the origin of an intermediate-level part, this transition also necessarily involves the advent of some degree of connectedness among the lower-level entities, as well as the differentiation of at least one of them. This logical dependence might seem to require that evolution proceed stepwise, from solitary individual (A), to undifferentiated aggregate (B), to differentiated aggregate (C), to differentiated aggregate with an intermediate-level part (D). But in principle, all three changes could happen at the same time, in a single evolutionary transition. Thus, nothing in this scheme demands that major transitions occur by the stepwise accumulation of minor transitions. In fact, one major transition in
187
particular, the evolution of the eukaryotic cell, almost certainly did not proceed stepwise in this way. Rather, the first eukaryotic cell most likely evolved via symbiogenesis between two solitary prokaryotic cells (e.g., Margulis and Chapman 1998), entirely skipping any stage that could be considered an undifferentiated aggregate. The scale is unusual in at least one way. It captures a single variable, hierarchy, or more precisely, degree of individuation of the top hierarchical level in an organism. But hierarchy is decomposed into three partly independent components, so that change can occur along any of three axes, corresponding to the three types of minor transition. An increase in number of cell types within a multicellular organism would be a minor transition. And so would the addition of an organ or tissue. Importantly, there is no assumption here that the various minor transitions are equally important, that they count equally toward individuation or that they are equally probable in evolution. Indeed, there are doubtless important differences in the difficulty in producing each type, and if we knew more about them, some sort of weighting scheme would be appropriate. In any case, our present focus is only on number of changes in hierarchy, on numbers of increases and decreases. The primary advantage of using the minor transitions is that they occur more frequently than major transitions, thus allowing more data for analysis in the form of reconstructed evolutionary transitions. And this in turn allows hierarchy to be analyzed statistically, in phylogenetic context, to test hypotheses about trend mechanisms. Importantly, our intent is not to determine mechanisms underlying specific transitions in specific clades. Such questions are an important line of research and have generated interesting results (e.g., Roze and Michod 2001; Danforth 2002; McShea and Venit 2002; Urbanek 2003). Rather, our intent is to examine hierarchical evolution at a higher level—across immense time spans, vastly different ecological settings, and huge taxonomic divides—in an attempt to discover what evolutionary forces might have shaped hierarchical structure in general. Of course, it could be that no such general forces exist, and in that
188
JONATHAN D. MARCOT AND DANIEL W. MCSHEA
case, hierarchy should increase and decrease about equally often, which is the expectation for an unbiased mechanism for taxa not near a lower or upper boundary (McShea 1994). Attention to scale is important here. For example, trends within some clades could be biased, even if no clear biased mechanism can be found across life as a whole. This would be the case if some groups show a biased tendency toward increased hierarchical structure, whereas others show a biased tendency toward decrease. Our concern is only at the largest scale, on changes in hierarchy at the scale of life as a whole. Clade Selection High-resolution statistical analysis of trends generally requires some knowledge of ancestor-descendant transitions (e.g., McShea 1994; Wagner 1996; Alroy 2000; Wang 2001). The scope of this study is all cellular life, so the optimal data would consist of the actual transitions from every ancestor to every descendant of every cellular organism in the history of life. This is obviously impossible— most taxa are infrequently preserved in the fossil record, and even of those that are preserved, only a fraction will represent ancestordescendant pairs (Foote 1996). These transitions can be inferred by using phylogenetic methods of ancestral state reconstruction, but these methods require an estimate of phylogenetic relationships. A complete, species-level phylogeny of the tree of life is not currently available, so the next best alternative is to analyze random subclades of this tree. Unfortunately, this is not a tractable alternative either, as the transitions in which we are interested are sufficiently infrequent that the vast majority of sampled clades would not show any hierarchical variation, and a prohibitively large number of clades would have to be sampled in order to perform statistical analyses. We therefore deliberately selected clades that met the following criteria: (1) the clade spans at least one instance of a minor transition, (2) the clade has a published phylogenetic estimate that includes more than ten taxa, and (3) relevant hierarchical information is available for the member taxa included in the published tree. Clades selected for this
study are listed in Table 1. We did not consider whether these clades showed increases or decreases in hierarchical structure when selecting them, and therefore they are, in effect, randomly selected with respect to the hypothesis at hand, the existence of an upward tendency for hierarchy. However, we acknowledge that our selection criteria lead to overestimates of the absolute rates of change (as the vast majority of all clades would not exhibit any variation in hierarchical state). Instead, inferred rates are relative rates derived by using only the taxa included in our study. Whether this type of sampling actually biases estimates of relative rates is unknown, but the effect of random taxon sampling will be addressed below. The resulting data set includes phylogenies from 22 clades, including one group of cyanobacteria at the lowest major level, eight groups of protists, and 13 groups of metazoans, together exemplifying a variety of different minor transitions toward their respective next-higher hierarchical levels. There are some obvious gaps, notably the eubacteria, the plants, and the fungi, but the sample nevertheless spans a large taxonomic range, cutting a huge swath through the tree of life. Several independent phylogenetic studies have been conducted for many of our selected groups, and for these groups we included trees from all of the studies. Some trees produced by particular investigators were made up of taxa that were subsets of larger groups of taxa analyzed in later, more comprehensive studies by the same investigators. In these cases only the later, more inclusive trees were used. In addition, many individual studies from which we drew trees contained more than one tree. Many of these resulted from multiple analyses of the same data sets using different phylogenetic methods (e.g., parsimony, neighbor-joining, maximum-likelihood). We included all available trees in our analysis, except those with topologies identical to ones from the same or a different study, as these would yield identical results. A total of 88 trees were analyzed (see methods below), and a full list of these trees and their corresponding references appear in the Appendices (online at http://dx.doi.org/10.1666/pbio06028. s1).
HIERARCHICAL EVOLUTION
Hierarchical States We selected phenotypic character states of the analyzed clades that corresponded to the minor transitions (Table 1) and scored the constituent taxa from the literature. Examples of minor transitions identified include the increase in connectedness in the transitions in cyanobacteria from solitary to filamentous; the increase in differentiation accompanying the evolution of separate reproductive and somatic cell types in several clades of red and green algae, and of behaviorally distinct (i.e., reproductive and nonreproductive) individuals in eusocial hystricognath rodents; and the addition of an intermediate-level part in the evolution of complex reproductive structures in some red algae, and of hypertrophied zooids in some hydroid colonies, such as the Portuguese man-of-war (Physalia). Our data sets and a full list of references from which we coded constituent taxa are available from the authors upon request. In this study, we treat hierarchical levels defined by minor transitions as different states of a single character, and only analyze evolutionary steps among these levels. For example, to analyze transitions in connectedness, we count transitions among the rather abstract states ‘‘solitary’’ and ‘‘connected.’’ We do not analyze all of the various changes in the numerous genetic and phenotypic characters that accompany these transitions. The reason is that our goal is not to characterize these transitions in detail, or mechanistically, but to do so in way that makes them comparable among disparate taxa and at different hierarchical levels. For example, a transition from solitary to connected in eukaryotic cells may be accompanied by the origin of cell-cell adhesion molecules. We would not use these molecules as a character marking a transition, however, because connectedness arises by other routes at other levels. For example, in a vertebrate society, it might arise with origin of a chemical pheromone. For these transitions to be comparable, for them both to represent instances of similar sorts of change, it is important that we use the same character, at the same level of abstraction (in this case, connectedness) at all hierarchical levels. Impor-
189
tantly, however, there is no implicit assumption here that connectedness signifies precisely the same thing, biologically speaking, at all levels. Rather the test for an upward bias across levels is also partly a test for a common significance. For comparability across taxa and levels, we also limit ourselves in another way. In particular, transitions from monomorphic to differentiated aggregates in different clades are not just increases in differentiation but first instances of differentiation in each clade. The various evolutionary steps that lead to further differentiation (e.g., the origin of a third cell type or a third caste) are also increases in individuation, and therefore in hierarchy, but their equivalence among clades is less clear. Because we study hierarchical evolution throughout the tree of life, equivalence of these transitions among highly disparate taxa is of primary importance. In any case, in practice, instances of apparent non-comparability were uncommon in the clades included in this study. Statistical Methods If the trend is driven, then increases in hierarchical complexity (hereafter referred to as ‘‘gains’’ for simplicity) are expected to be more frequent than decreases (hereafter, ‘‘losses’’). But note that an observation of more gains than losses does not necessarily imply an increasing tendency, as it is likely that in most cases the ancestral state was a lower hierarchical level, and therefore there were more opportunities for gains. What is really at issue is the rate of gains and losses, or, in other words, the number of gains and losses per opportunity for gain or loss, respectively. In this study, we conduct numerous tests of the null hypothesis of equal rates of gains and losses against an alternative hypothesis of asymmetrical rates favoring gains. We use two similar, maximum-likelihood-based approaches to test these hypotheses. Indirect Method. The first method we used is that of Sanderson (1993), which involves first reconstructing ancestral states and then tallying numbers of inferred transitions between states on a given phylogeny. For brevity, we refer to this overall method as the ‘‘indirect
190
JONATHAN D. MARCOT AND DANIEL W. MCSHEA
TABLE 1. Clades analyzed as part of this study, and their phenotypic character states that correspond to the scale of minor transitions. Hierarchical level
Minor transitions Clade name
Prokaryotic cell
Cyanobacteria
Eukaryotic cell
Bacillariophyta
Multicellular individual
Connectedness
Chlorophyta
filaments or loose aggregates chains, ribbons, stepped or other colony shapes coenobia or filaments
Chrysophyta Dinophyceae
colonies chain-like colonies
Euglenophyta Haptophyta Spumellaria (Polycystinea) Bangiophycidae (Rhodophyta)
colonies colonies colonies
Cyclostomata (Bryozoa)
filamentous or pseudofilamentous thalli —
Agapostemon (Insecta) Apinae (Insecta) Augochlorini (Insecta) Halictidae (Insecta) Hormaphididae (Insecta) Thysanoptera (Insecta) Xylocopinae (Insecta) Synalpheus (Crustacea) Hystricognathi (Mammalia) Anthozoa (Cnidaria)
communal groups
Hydrozoa (Cnidaria)
colonies
Urochordata
colonies
communal groups communal groups
Differentiation
Intermediate parts
heterocysts
—
—
—
separate somatic and reproductive cells — differentiated terminal cells — — —
reproductive structures — —
separate somatic and reproductive cells
reproductive structures
eruptive growth, adventitious branching, or daughter colonies —
maculae
— — —
—
eusociality semi-social or eusocial eusociality
— —
soldier morphs
—
subsocial or communal groups subsocial groups
eusociality
—
eusociality
—
colonies
eusociality
—
communal groups
eusociality
—
communal groups —
colonies
method,’’ as it requires the extra step of reconstruction of ancestral states prior to analysis, whereas the other method (the ‘‘direct’’ method, see below) does not rely on ancestral reconstructions and thus uses the data more directly. Frequencies of state-to-state transitions and of stasis are then used to estimate per-branch rates of hierarchical gain and loss.
—
gonozooids, nematophores
—
—
primary axial polyp acting as anchor nectophores, pneumatophores, dactylozooids colonies sharing a common cloaca
The maximum likelihood estimates of these rates are calculated as the number of observed gains and losses divided by the number of opportunities for gains or losses, respectively (Sanderson 1993). This two-rate hypothesis can be contrasted with a null, one-rate hypothesis of equal rates of gain and loss, which are estimated by dividing the total number of
HIERARCHICAL EVOLUTION
changes (i.e., gains plus losses) by the total number of opportunities. We used MacClade 4.07 (Maddison and Maddison 2002) to infer ancestral states and corresponding transition frequencies. Taxa with missing data were excluded prior to analysis, as they contributed no information as to the occurrence of transitions, yet added branches to the tree, inflating the numbers of opportunities for change. In addition to unambiguous ancestral state assignments, we also estimate ancestral states by using the ACCTRAN optimization. This arbitrarily assigns ambiguously placed transitions to the earliest possible node. This optimization favors reversals (e.g., a gain followed by a loss) over parallelisms (e.g., two independent gains in different lineages), and therefore provides a more conservative test of a hypothesis of asymmetrical rates. The ACCTRAN optimization is admittedly an arbitrary resolution of uncertain placement of transitions, but for this study, it has the advantage of allowing more transitions for subsequent analysis. In practice, optimization had little or no effect on the direction or magnitude of inferred asymmetry (results not shown), so we report only results using the ACCTRAN optimization, as it yielded more data for analysis in the form of inferred transitions. Because the biased and unbiased hypotheses are nested (i.e., the one-rate hypothesis is a special case of the two-rate hypothesis in which the rates are identical), the more complex two-rate model can be statistically tested against the null with a likelihood ratio test (LRT) (Edwards 1992; Huelsenbeck and Rannala 1997). For all LRTs in this study, the logarithm of the probability of the observed data was calculated under both the one- and tworate hypotheses. Because these hypotheses are nested—with the one-rate model being a special case of the two-rate model in which the two rates are equal—their likelihoods can be statistically compared. Twice the difference of the log-likelihoods is distributed as 2, and its statistical significance determined by using standard tables with the degrees of freedom equal to the difference in number of free parameters between the two hypotheses—in all cases here, one.
191
LRTs are a powerful way of statistically testing nested hypotheses. However, because there will be few transitions for any one hierarchical character, the power of these methods to reject the null hypothesis can be low for these analyses (see below), and they are therefore prone to Type II error. Recently, many have used the Akaike information criterion (Akaike 1973, 1974) to compare competing hypotheses in a variety of phylogenetic (e.g., Posada and Crandall 2001; Sullivan and Joyce 2005) and paleobiologic studies (e.g., Connolly and Miller 2002; Foote 2005). Essentially, AIC is used to evaluate the predictive power of a hypothesis, measured as the log of its likelihood (i.e., support), against its complexity, measured as the number of parameters. Hypotheses with more parameters will always have a higher likelihood, but they are penalized for their additional complexity. Therefore simpler models can have a more optimal AIC value despite a lower likelihood. Burnham and Anderson (2004) suggested a version that is corrected for small sample sizes (AICc), and which converges upon the traditional formulation at large sample sizes. The hypothesis with a lower AIC or AICc is preferred, as it is based upon the negative log-likelihood. For all indirect method analyses, we used AICc to evaluate both the unbiased (one-rate) and biased (two-rate) models. Direct Method. The second method we used skips the step of reconstruction of ancestral states, and, instead, infers transition rates directly by using maximum likelihood (ML) under two hypotheses of character evolution. The first is the null hypothesis in which rates are symmetrical (i.e., a one-rate Mk1 model [Lewis 2001]), and the rate of gain equals the rate of loss. The second is an asymmetrical two-rate model, in which rates of gains and losses can vary independently of one another. Likelihoods of these hypotheses given the observed data and a phylogenetic tree can be compared directly by using an LRT, as in the indirect method. We also applied the AIC to these analyses. However, because individual transitions were not reconstructed, the sample size (n) is unclear, so we used AIC instead of the sample-size corrected AICc. We refer to this as the ‘‘direct method,’’ because likeli-
192
JONATHAN D. MARCOT AND DANIEL W. MCSHEA
hoods for the hypotheses are calculated directly from the data, without the added step of ancestral state reconstruction. This method makes explicit use of branch lengths, measured as the expected amount of change along a branch, and typically expressed as a function of the rate of character evolution and the elapsed time between two nodes. Unfortunately, for most of our test groups, these parameters are entirely unknown. In theory, branch lengths could be inferred by using fossil dates, or by applying some divergence dating method that uses molecular sequence data (i.e., the ‘‘molecular clock’’). Unfortunately, the majority of groups analyzed are poorly represented in the fossil record, undermining their use to estimate the ages of nodes. Molecular-based divergence dating theoretically would be possible for some of the test groups used, as many are based on molecular phylogenies. However, compilation, alignment, and reanalysis of the published data for each group were beyond the scope of this study. Instead, we used two different branch length ‘‘treatments.’’ The first assigns each branch of the tree a unit branch length (i.e., 1.0). It is difficult to imagine a scenario in which this would be biologically realistic, but we include it for completeness. This treatment yields rates of evolution per branch, which should be comparable to those rates estimated by using parsimony (i.e., the indirect method). The second treatment forces the tree to be ultrametric, meaning branch lengths were scaled so their sum from the root of the tree to each tip (i.e., included taxa) is equal. In our analyses, the scaling was arbitrary, so that nodes were spread relatively evenly from the tips to the root of the tree. These two branch length treatments are not meant to cover the spectrum of possible branch length arrangements, and it is certainly possible that the true branch lengths differ substantially from both of these. However, in the absence of information on the true branch lengths, they are simply practical alternatives. For the most part, these different branch length treatments yielded the same results (not shown), so only the results for the ultrametric branch lengths are reported. We calculate likelihoods with Mes-
quite 1.05 (Maddison and Maddison 2004a,b). Taxa with missing data or that exhibit polymorphism are necessarily excluded prior to analyses, so the subset of taxa used in this analysis differs slightly from that in the indirect analysis in a few clades. Analyses Single Clade Analyses. We applied both the direct and indirect method described above to each of our collected published phylogenies. To compare the unbiased and biased hypotheses, we also calculated the AIC and AICc of each for the direct and indirect methods, respectively. Pooled Analysis. The statistical power of both single-clade methods to reject the null hypothesis can be quite low for small- to medium-sized trees (Sanderson 1993; Cunningham 1999; Mooers and Schluter 1999). Accordingly, we perform two additional analyses to augment these. First, we pooled transition data from many clades into a larger metaanalysis. Sanderson (1993) suggested that data from several related characters could be pooled for a single clade to increase the data available for analysis of that clade. In this study, we take a similar approach to pooling data. However, rather than studying the evolution of several characters in a single clade, we are interested in a single character (i.e., hierarchical structure) among many clades. We therefore select one tree from each of the 22 studied groups (a single tree to prevent the inclusion of overlapping taxa, although we use two trees for the halictid bees that contain no overlapping taxa), and pool the inferred transitions among all of these trees. We use the term ‘‘branches’’ as shorthand for the reconstructed ancestor-descendant segments of the analyzed trees. For this analysis, we select the single tree for the analyzed group that exhibited the greatest number of transitions regardless of whether they were gains or losses. The overall pooled data set consists of 1953 total branches. The direct method was not possible for these pooled data sets, as it requires a phylogenetic hypothesis for all included taxa, so we use only the indirect method on these. As for the single-clade analyses, we also applied
HIERARCHICAL EVOLUTION
the AICc to compare the biased and unbiased hypotheses. We also analyzed subsets of these pooled data to determine if rate asymmetry patterns for each type of minor transition differ among the major levels. That is, for each minor transition, we pooled separately the branches within the prokaryote-to-protist range, those within the protist to multicellular individual range, and those within the multicellular to colony or eusocial range. For each minor transition, we then compared the three rate pairs from the three hierarchical levels with those inferred for the pooled data. In effect, we compared the likelihood of the data given a sixrate hypothesis (two rates, gain and loss, for each of three hierarchical levels) with the likelihood based on a two-rate hypothesis (gain and loss for all levels combined). The LRT therefore tested—for each minor transition— the null hypothesis that the rates of evolution of that minor transition were similar across all three major levels. If this hypothesis were rejected, it would suggest that the rate of change for that minor transition differed among the major levels, suggesting that different evolutionary mechanisms were at work at different levels. Detection of inhomogeneity among the rates does not tell us anything about the nature of the differences, of course, but it does point the way to—and invite—further investigation. For the LRT, likelihoods were computed as in the other indirect analyses, except that the likelihood for the six-rate case was computed by multiplying together the likelihoods for the three rate-pairs that constituted it. Clade Tally Analysis. The third approach we used avoids the low statistical power of the single-clade methods, and simply tests the null hypothesis that if rates of hierarchical gain and loss are equal (i.e., a passive trend), roughly half of the sampled clades should show greater rates of gain, and a half greater rates of loss. We used the same trees selected for the previous analysis and tallied the number of trees showing higher rates of gain and loss respectively. We then tested the ratio of these against the null hypothesis of a 50:50 ratio using an LRT. AICc was also used to compare these hypotheses.
193
Caveats Character Coding. Coding taxa into our scheme of minor transitions necessarily reduces very complex traits to singular states. In some case, this coding forced us to reduce what are essentially continuously varying traits (e.g., sociality [see Michener 1974]) to a small number of discrete categories. Inevitably, a significant amount of information regarding these traits and their evolution is lost in this reduction. However, this reduction was not arbitrary, but guided always by the criteria for minor transitions on which the hierarchy scale is based. We invite critical examination of our decisions, and of our assignment of these states to the analyzed taxa, although we believe it is unlikely that alternative coding would drastically alter the results. Phylogenetic Error. Our analysis relied on the accuracy of the phylogenetic estimates we used as input data. In an attempt to minimize the effect of phylogenetic error, we analyzed as many published trees as possible. For example, if a published study used multiple methods of phylogenetic inference (e.g., parsimony and maximum likelihood), we repeated our analyses on the resulting trees from each. In addition, when possible, we analyzed trees from multiple studies. In many cases the taxa in the various published studies overlap. In any case, the evolutionary transitions in which we are interested are rare in comparison to the total number of branching events in the trees we examined, and the only branches for which estimation error would affect our analysis are the few that occur near these transitions. Errors in branches in which no minor transition occurs would not affect our results. Thus, the effect of phylogenetic error is probably small. Taxon Sampling. Rates of evolution estimated in this study are based on phylogenetic trees that include only a fraction of the possible constituent taxa. The effect of such taxon sampling on studies of rate asymmetry is unknown, so we performed a simple simulation study to address whether poor taxon sampling biases the two methods’ estimates of rate asymmetry (see Appendix 4 at http://dx.doi. org/10.1666/pbio06028.s1). Results of this
194
JONATHAN D. MARCOT AND DANIEL W. MCSHEA
simulation indicate that as fewer and fewer taxa are sampled from a clade, the inferred rate asymmetry is generally biased upward, meaning gains appear to be more probable than losses (see Figure A1 at http://dx.doi. org/10.1666/pbio06028.s2). These results demonstrate that we must be cautious of interpreting estimates of high rate bias in clades likely to be poorly sampled. Furthermore, our simulations show only the effects of random taxon sampling. It is possible, perhaps even likely, that the subsets of possible taxa analyzed in this study are nonrandom either by differential extinction or previous investigator decision. Nonrandom sampling might exacerbate the observed bias, and this would be a worthwhile avenue of further exploration, although beyond the scope of the current study. Results Single-Clade Analyses. We performed 162 direct and 162 indirect analyses of minor transitions on 88 analyzed trees, and their results are summarized in the Appendices. In general, most analyses fail to reject the null hypothesis of equal rates of hierarchical gain and loss. Specifically, only four of the indirect analyses (2% of analyses) and 21 of the direct analyses (13%) reject the null hypothesis of equal rates of evolution at the 5% level. A majority of the direct analyses that produced a significant result (18 of the 21) actually indicate a significant tendency toward loss, contrary to what would be expected if the increasing trend were driven. It should be noted, however, that 15 of the 18 significant results for the direct method that indicate a tendency toward loss are cases in which inferred rates of change are exceptionally high, and rates of loss are often almost an order of magnitude higher than rates of gain. Interpretation of these results requires caution, as all are instances in which gains are restricted exclusively to the tips of trees, and in which no losses are reconstructed using parsimony. We expect that this is a peculiarity of the maximumlikelihood method in instances where there is very little opportunity for losses. As has been noted previously, the maximum-likelihood solution in these cases is one in which rates of change (both gains and losses) are very high,
and gains throughout the tree can quickly followed by losses, even on a single branch (see Pagel 1999 for further discussion of this peculiarity). However, because the vast majority of cellular organisms do not show any variation in hierarchical structure, we believe these remarkably high estimates of rates of change probably do not reflect reality. In any event, these results provide no support for a driven mechanism. On the other hand, the paucity of significant results for these single-clade analyses is not surprising, as Sanderson (1993) and Mooers and Schluter (1999) have demonstrated that these methods have low statistical power when the number of taxa or the number of changes is low. The overwhelming majority of AIC analyses (84% of indirect analyses and 71% of indirect analyses) indicate that the unbiased (one-rate) hypothesis is preferred over the biased hypothesis. In other words, a single rate of hierarchical change for both gains and losses explains the observed data better than the more complex hypothesis in which hierarchical gains and losses occur at different rates. Therefore, not only does the biased hypothesis fail to reject the null unbiased hypothesis using the LRTs, but there is considerable support from the AIC values for the unbiased hypothesis. Pooled Analysis. Pooling the reconstructed transitions from multiple selected trees increases statistical power, and the results for the analyses of these pooled data are shown in Table 2. In the total pooled data set, rates of gain and loss for connectedness are nearly identical and statistically indistinguishable. Both differentiation and intermediate parts show a tendency toward loss, and this tendency is statistically significant for differentiation. Furthermore, the AICc values for the unbiased hypothesis are better (i.e., lower) than those for the biased hypothesis for both connectedness and intermediate parts. AICc values for differentiation favor the biased hypothesis. Estimates of rate asymmetry within subsets that correspond to the hierarchical levels defined by the major transitions generally show the same pattern, with rates of gains and losses roughly equal and no differences significant. In only one instance—connectedness for
Multicellular individual to colonial or social individual
Eukaryotic cell to multicellular individual
Prokaryotic cell to individuated prokaryotic colony
Minor transition
Overall
connectedness differentiation intermediate parts connectedness differentiation intermediate parts connectedness differentiation intermediate parts
connectedness differentiation intermediate parts
Minor transition
0.111 0.012 — 0.055 0.014 0.004 0.092 0.054 0.010
0.068 0.027 0.006
Gain
0.062 0.000 — 0.077 0.032 0.000 0.055 0.084 0.021
0.064 0.062 0.020
Loss
0.374 0.269 — 0.179 0.322 0.898 0.051 0.113 0.525
0.706 0.001 0.311
p
111.680 24.820 — 458.881 157.158 53.998 385.338 359.022 90.613
952.353 572.170 148.141
112.925 25.633 — 459.087 158.186 55.990 383.552 358.517 92.220
954.215 564.005 149.119
AICc (one-rate) AICc (two-rate)
TABLE 2. Results of indirect analysis on pooled data sets. Transition data were pooled for all selected clades indicated with an asterisk in the Appendices (Overall), and for subsets of these that corresponded to the hierarchical levels defined by the major transitions. Rates of gain and loss were estimated with the indirect method and are shown along with the p-value from the corresponding LRT. In only two cases could the null hypothesis of equal rates of gain and loss be rejected at the 0.05 level. AICc for the unbiased (one-rate) and biased (two-rate) hypotheses are shown. Preferred hypotheses are shown in boldface type. Note that in only one instance (connectedness for the multicellular individual to colonial or eusocial invidual transition) was the two-rate model preferred for a bias toward gains, specifically. HIERARCHICAL EVOLUTION
195
196
JONATHAN D. MARCOT AND DANIEL W. MCSHEA
TABLE 3. Numbers of selected trees that showed bias toward gains and losses for both the indirect and direct methods, p-values are from LRT of null hypothesis of a 50:50 split between gains and losses. No comparison shows a significantly different proportion. AICc values for the unbiased (one-rate) and biased (two-rate) hypotheses are shown. Preferred hypotheses are shown in boldface type. Note that in all cases, the one-rate hypothesis is preferred. Minor transition Connectedness Differentiation Intermediate parts
Method
Gains
Losses
p
AICc (one-rate)
AICc (two-rate)
indirect direct indirect direct indirect direct
14 11 9 6 5 2
7 10 6 9 1 4
0.123 0.827 0.437 0.437 0.088 0.410
31.323 31.323 23.102 23.102 11.318 11.318
31.400 33.731 25.190 25.190 13.407 15.638
the multicellular individual to colonial or eusocial individual transition—is the two-rate model preferred for a bias toward gains using the AICc. In two other cases, the biased hypothesis was preferred, but for losses. In all other cases, the unbiased one-rate hypothesis was preferred. Thus, these results from the LRTs and AICc analyses on the pooled data sets also fail to support a driven trend, and indicate significant support for an unbiased mechanism. To determine if these rates and patterns of asymmetry are significantly different among hierarchical levels, we performed an LRT to test if these rates (i.e., the six-rate hypothesis) explained the observed data significantly better than the rates estimated for the entire pooled data set (i.e., the two-rate hypothesis). At first glance, most rates appear different among levels. However, we are able to reject the null hypothesis of the two-rate hypothesis in favor of the six-rate hypothesis only for differentiation (p K 0.001), meaning that evolutionary rates of differentiation are significantly different among levels, increasing as one moves up the major levels. Rates for connectedness and intermediate parts are not significantly different among levels (p ⫽ 0.151 and 0.294, respectively). Clade Tally Analysis. Our last approach tested whether the results for the selected clades deviate from a 50:50 ratio between those showing an increasing tendency to those showing a decreasing tendency. Tallies and LRT p-values are shown in Table 3. For all transitions, more indirect analyses indicate a tendency toward gain, but for no single transition is the observed ratio significantly different from 50:50. Direct analyses are still
more evenly split, and none are significantly different than 50:50. For all comparisons, AICc values support the hypothesis of equal numbers of clades showing gains and losses, over bias in either direction. These results suggest that roughly as many clades show a tendency toward gain as toward loss for each minor transition. Discussion All analyses failed to reject an unbiased, passive mechanism for the observed trend of increasing maximal hierarchical structure (Appendices). It is unlikely that this failure solely is due to the low statistical power of these methods, as the pooled data set contained considerably more data, yet still failed to reject the null hypothesis (Table 2). Neither can the lack of a significant result be attributed to poor taxon sampling, as our simulation results indicated that poor taxon sampling should increase the apparent bias toward gains (Appendix 4). In addition, the tallies of studies showing higher rates of gain or loss also failed to reject the expected 50:50 ratio (Table 3). Of course, we cannot reject the hypothesis of rate bias, but despite the considerable amount of data and various analyses we repeatedly failed to reject the null hypothesis of symmetrical rates. Furthermore, nearly all analyses using AIC favor the unbiased mechanism over the more complex biased mechanism. The vast majority of our analyses therefore support the hypothesis that the observed trend in hierarchical structure was passive, lacking any pervasive tendency toward increase. Importantly, this does not suggest that hierarchical evolution is purely random, with-
HIERARCHICAL EVOLUTION
out any forces governing directional change when it occurs. Nor does this result preclude natural selection from playing a role in governing such change. Indeed, an overall passive trend is consistent with the possibility that selection is the exclusive agent of change in every single lineage, producing each of the gains and losses in hierarchy occurring in every taxon across the tree of life. The implication is rather that no general selection-driven directional tendency exists across all lineages. It is theoretically possible to further test the role of natural selection on hierarchical evolution in individual clades, but given the low statistical power of the current methods, larger phylogenetic data sets (i.e., more sampled taxa) would be necessary. Our findings do not rule out the pattern suggested by Knoll and Bambach (2000), that hierarchical evolution is characterized by diffusion away from ‘‘left wall’’ boundaries within hierarchical levels, with occasional breaches of ‘‘right walls,’’ corresponding to the major transitions. They saw the breaching of right walls as essentially irreversible or in some other way biased toward gains. Our findings actually support their between-wall mechanism, and they do not contradict a driven breaching mechanism, because these breaches could depend on changes in hierarchical individuation based on morphological criteria not covered in our scheme. Or they could depend on some particular and still unknown combinations of minor transitions—for example, the crossing of a threshold of amount of division of labor, and of number of intermediate-level parts. Or the combinations could be different for every major transition. Our findings address the broader issue of the presence or absence of pervasive tendencies in minor transitions generally. Nevertheless, some of our results may provide insight into these breaches. Anecdotal data suggest that these breaches are biased toward gains, as there are very few known major reversals (McShea 2001b). However, a few observations seem to indicate that a passive mechanism remains a real possibility, and one that should be explored further. According to our results, the rates of evolution of the minor transitions appear ordered in the sense that
197
rates of evolution of connectedness are always higher than differentiation, which, in turn, are greater than those of intermediate parts. Whatever evolutionary steps beyond those studied here are necessary for complete major transitions, that is, for breaches of right walls, it is possible that they are higher order than, and perhaps dependent upon, the evolution of intermediate parts. If so, then we would expect that the rates of evolution would be even lower than those observed for intermediate parts. In our study, we found evidence for only a few reversals in the evolution of intermediate parts. Characters evolving at lower rates of evolution therefore are likely to show few, if any reversals. The expectations of low overall rates of evolution and few (if any, depending on the transition) reversals match empirical observations of major transitions. They might also explain why major transitions superficially appear to be biased toward gains, even if they are, in fact, unbiased. Furthermore, all known major transitions are composed, at least in part, of our various minor transitions, but for these we find no support for a driven trend on a larger scale. Our analyses show that there are similarities in rates and patterns of asymmetry of hierarchical evolution shared among major levels that bound all three major breaches. Specifically, we failed to reject the null hypothesis of a single rate of evolution of connectedness and intermediate parts among the different hierarchical levels. Together, these observations imply that the very steps that at least partly make up major transitions, including those at immediately higher and lower hierarchical levels, share a similar passive mechanism. This suggests that either the breaches themselves might have a passive mechanism, or if the breaches are, in fact, biased toward gains, then they likely involve evolutionary steps that are distinct from those that make up the minor transitions studied here. Among the minor transitions, the evolution of differentiation stands out in our pooled analysis: it is the only one that shows a significant bias between gains and losses, and it is the only one that shows significantly different patterns among hierarchical levels. That the rate of evolution of differentiation is biased
198
JONATHAN D. MARCOT AND DANIEL W. MCSHEA
toward losses is somewhat surprising. Most of our analyzed clades were reconstructed to be ancestrally undifferentiated, so this cannot be an artifact of our methods or clade selection, and likely represents a real pattern. Note that whereas gains of differentiation evolve at less than half the rate of those of connectedness, rates of loss appear more or less comparable in these two minor transitions. Caution is appropriate when interpreting these absolute rates of evolution (measured as change per sampled phylogenetic branch), but taking them at face value, they do raise some interesting possibilities. Speculating, if degree of differentiation is correlated with degree of ecological specialization, it could be that selection more often favors generalist adaptations over specialist. Another possibility is that the evolution of differentiation involves many complex steps (not studied here), but comparatively few are need to revert to an undifferentiated state (i.e., Dollo’s Law [Dollo 1893; Gould 1970]). In other words, losses might be relatively common compared to gains, because the disabling of developmental pathways that produce differentiation might require only simple or small changes in development. In that case, the significant difference in rates of differentiation between the major levels could reflect differences in either the number or intricacy of the constituent steps necessary bring about differentiation. It is not possible to address this hypothesis with the data presented here, but testing would be possible with more detailed data on the morphologic and genetic changes underlying differentiation in various groups, such as have been collected for single-celled prokaryotes (e.g., Wolk 1996; Adams 2000; Meeks et al. 2002), eukaryotes (e.g., Bonner 2003; Schlichting 2003), and multicellular organisms (e.g., Harvell 1991, 1994). In any case, more robust estimates of absolute rates are needed, ideally rates per unit time rather than per sampled branch. Such estimates could be generated by including temporal durations of branches in the phylogenetic analysis, durations that can be estimated either from fossil dates or by using molecular phylogenetic methods. Some comment is needed on the apparent increase in overall rates across the minor tran-
sitions, from intermediate parts to differentiation to connectedness (top of Table 2). It is easy to imagine why connectedness might be gained and lost easily. In solitary organisms (whether single-celled prokaryotes, singlecelled eukaryotes, or multicellular), all that would be required for gain is that replication produce daughters that arise within or adjacent to their mothers, so that gain requires no more than retention of this connected state, and loss requires only the dissolution of a connection. As for the low rates of change in intermediate parts, it could be that gains of such structures typically require new differentiated parts, making differentiation in effect a ratelimiting step. The low rate for losses is harder to explain. More work is clearly needed on this complex problem. In particular, other correlates of hierarchical change, other minor transitions, may be worth investigating. Perhaps there are biochemical aspects of individuation, or anatomical aspects other than the ones studied here, for which driven trends exist. Also of interest would be changes below the level of the higher-level individual that might affect hierarchical evolution. There is some evidence that as higher levels become more individuated, the lower-level individuals that constitute them tend to lose parts (McShea 2001c, 2002). This in turn should make a return to the solitary condition (i.e., losses of individuation at the upper level) more difficult. (And in that case, our finding that losses occur as frequently as gains is puzzling.) Pending such studies, our findings here suggest—at a minimum— that a passive mechanism is a plausible hypothesis. Conclusions There is an obvious trend of increasing maximal hierarchical structure throughout the evolutionary history of cellular organisms. However, nearly every analysis performed in the course of this study failed to reject the null hypothesis of equal rates of gains and losses in hierarchical structure, and seems to support a passive, unbiased mechanism. In other words, over a wide range of taxa and hierarchical levels, we found no pervasive tendency for organisms to become more complex hier-
HIERARCHICAL EVOLUTION
archically. Rather, our findings are consistent with the notion that the trend is the result of diffusion away from a lower boundary. Acknowledgments We thank A. D’Orazio for his assistance in gathering hierarchical data from the literature, E. P. Venit for his intellectual contributions and discussion, and K. Sears for early reviews of this manuscript. This manuscript was greatly improved by comments and suggestions on an earlier draft of this manuscript by J. Valentine and P. Wagner. This project was made possible by, and we are grateful for, grants from the National Aeronautic and Space Administration (NAG5-12336) and the National Science Foundation (EAR-02-08156). Literature Cited Adams, D. G. 2000. Heterocyst formation in cyanobacteria. Current Opinion in Microbiology 3:618–624. Akaike, H. 1973. Information theory and an extension of the maximum likelihood principle. Pp. 267–281 in B. N. Petrov and F. Csa´ ki, eds. Second international symposium on information theory. Akade´ miai Kiado´ , Budapest. ———. 1974. A new look at the statistical model identification. IEEE Transactions on Automatic Control 19:716–723. Alroy, J. 2000. Understanding the dynamics of trends within evolving lineages. Paleobiology 26:219–329. Anderson, C., and D. W. McShea. 2001. Individual versus social complexity, with particular reference to ant colonies. Biological Reviews 76:211–237. Boardman, R. S., and A. H. Cheetham. 1973. Degrees of colony dominance in stenolaemate and gymnolaemate bryozoa. Pp. 121–220 in R. S. Boardman, A. H. Cheetham, and W. A. Oliver Jr., eds. Animal colonies: development and function through time. Dowden, Hutchinson, and Ross, Stroudsburg, Penn. Bonner, J. T. 1988. The evolution of complexity. Princeton University Press, Princeton, N.J. ———. 1998. The origins of multicellularity. Integrative Biology: Issues, News, and Reviews 1:27–36. ———. 2003. On the origin of differentiation. Journal of Biosciences 28:523–528. Brandon, R. N. 1999. The units of selection revisited: the modules of selection. Biology and Philosophy 14:167–180. Burnham, K. P., and D. R. Anderson. 2004. Multimodel inference: understanding AIC and BIC in model selection. Sociological Methods and Research 33:261–304. Connolly, S. R., and A. I. Miller. 2002. Global Ordovician faunal transitions in the marine benthos: ultimate causes. Paleobiology 28:26–40. Cunningham, C. W. 1999. Some limitations of ancestral character-state reconstruction when testing evolutionary hypotheses. Systematic Biology 48:665–674. Danforth, B. N. 2002. Evolution of sociality in a primitively eusocial lineage of bees. Proceedings of the National Academy of Sciences USA 99:286–290. Danforth, B. N., L. Conway, and S. Ji. 2003. Phylogeny of eusocial Lasioglossum reveals multiple losses of eusociality within a primitively eusocial clade of bees (Hymenoptera: Halictidae). Systematic Biology 52:23–36.
199
Dollo, L. 1893. Les lois de l’e´ volution. Bulletin de la Socie´ te´ Belge de Ge´ ologie, de Pale´ ontologie, et de Hydrologie 7:164– 166. Edwards, A. W. F. 1992. Likelihood. Johns Hopkins University Press, Baltimore. Foote, M. 1996. On the probability of ancestors in the fossil record. Paleobiology 22:141–151. ———. 2005. Pulsed origination and extinction in the marine realm. Paleobiology 31:6–20. Gould, S. J. 1970. Dollo on Dollo’s Law: irreversibility and the status of evolutionary laws. Journal of the History of Biology 3:189–212. ———. 1996. Full house: the spread of excellence from Plato to Darwin. Harmony, New York. Harvell, C. D. 1991. Coloniality and inducible polymorphism. American Naturalist 138:1–14. ———. 1994. The evolution of polymorphism in colonial invertebrates and social insects. Quarterly Review of Biology 69: 155–185. Huelsenbeck, J. P., and B. Rannala. 1997. Phylogenetic methods come of age: testing hypotheses in an evolutionary context. Science 276:227–232. Knoll, A. H., and R. K. Bambach. 2000. Directionality in the history of life: diffusion from the left wall or repeated scaling of the right? In D. H. Erwin and S. L. Wing, eds. Deep time: Paleobiology’s perspective. Paleobiology 26(Suppl. to No. 4):1–14. Lewis, P. O. 2001. Maximum likelihood phylogenetic inference: modeling discrete morphological characters. Systematic Biology 50:913–925. Maddison, D. R., and W. P. Maddison. 2002. MacClade, Version 4. 06. Sinauer, Sunderland, Mass. Maddison, W. P., and D. R. Maddison. 2004a. StochChar: a package of Mesquite modules for stochastic models of character evolution, Version 1. 05. ———. 2004b. Mesquite: a modular system for evolutionary analysis, Version 1. 05. Margulis, L., and M. J. Chapman. 1998. Endosymbioses: cyclical and permanent in evolution. Trends in Microbiology 6:342– 345. Maynard Smith, J., and E. Szathma´ry. 1995. The major transitions in evolution. W. H. Freeman, Oxford. McShea, D. W. 1994. Mechanisms of large-scale evolutionary trends. Evolution 48:1747–1763. ———. 1996. Metazoan complexity and evolution: is there a trend? Evolution 50:477–492. ———. 2001a. The hierarchical structure of organisms: a scale and documentation of a trend in the maximum. Paleobiology 27:405–423. ———. 2001b. The minor transitions in hierarchical evolution and the question of a directional bias. Journal of Evolutionary Biology 14:502–518. ———. 2001c. Parts and integration: the consequences of hierarchy. Pp. 27–60 in J. Jackson, S. Lidgard, and K. McKinney, eds. Evolutionary patterns: growth, form, and tempo in the fossil record. University of Chicago Press, Chicago. ———. 2002. Complexity drain on cells in the evolution of multicellularity. Evolution 56:441–452. ———. 2005a. The evolution of complexity without natural selection, a possible large-scale trend of the fourth kind. Paleobiology 31:146–156. ———. 2005b. A universal generative tendency toward increased organismal complexity. Pp. 435–453 in B. Hallgrı´msson, and B. K. Hall, eds. Variation: a central concept in biology. Elsevier, Amsterdam. McShea, D. W., and M. A. Changizi. 2003. Three puzzles in hierarchical evolution. Integrative and Comparative Biology 43: 74–81. McShea, D. W., and E. P. Venit. 2002. Testing for bias in the evo-
200
JONATHAN D. MARCOT AND DANIEL W. MCSHEA
lution of coloniality: a demonstration in cyclostome bryozoans. Paleobiology 28:308–327. Meeks, J. C., E. L. Campbell, M. L. Summers, and F. C. Wong. 2002. Cellular differentiation in the cyanobacterium Nostoc punctiforme. Archives of Microbiology 178:395–403. Michener, C. D. 1974. The social behavior of the bees: a comparative study. Harvard University Press, Cambridge. Mooers, A. Ø., and D. Schluter. 1999. Reconstructing ancestor states with maximum likelihood: support for one- and tworate models. Systematic Biology 48:623–633. Pagel, M. 1999. The maximum likelihood approach to reconstructing ancestral character states of discrete characters on phylogenies. Systematic Biology 48:612–622. Posada, D., and K. A. Crandall. 2001. Selecting best-fit model of nucleotide substitution. Systematic Biology 50:580–601. Roze, D., and R. E. Michod. 2001. Mutation, multilevel selection, and the evolution of propagule size during the origin of multicellularity. American Naturalist 158:638–654. Salthe, S. N. 1985. Evolving hierarchical systems. Columbia University Press, New York. ———. 1993. Development and evolution: complexity and change in biology. MIT Press, Cambridge. Sanderson, M. J. 1993. Reversibility in evolution: a maximum likelihood approach to character gain/loss bias in phylogenies. Evolution 47:236–252. Schlichting, C. D. 2003. Origins of differentiation via phenotypic plasticity. Evolution and Development 5:98–105. Sterelny, K., and P. E. Griffiths. 1999. Sex and death: an introduction to philosophy of biology. University of Chicago Press, Chicago.
Sullivan, J., and P. Joyce. 2005. Model selection in phylogenetics. Annual Review of Earth and Planetary Sciences 36:445–466. Szathma´ ry, E., and J. Maynard Smith. 1995. The major evolutionary transitions. Nature 374:227–232. Urbanek, A. 2003. Organization and evolution of animal colonies. Biology Bulletin 30:1–8. Valentine, J. W., and C. L. May. 1996. Hierarchies in biology and paleontology. Paleobiology 22:23–33. Van Valen, L. 1984. A resetting of Phanerozoic community evolution. Nature 307:50–52. Vermeij, G. J. 1987. Evolution and escalation: an ecological history of life. Princeton University Press, Princeton, N.J. Wagner, P. J. 1996. Contrasting the underlying patterns of active trends in morphologic evolution. Evolution 50:990–1007. Wang, S. C. 2001. Quantifying passive and driven large-scale evolutionary trends. Evolution 55:849–858. Wcislo, W. T., and B. N. Danforth. 1997. Secondarily solitary: the evolutionary loss of social behavior. Trends in Ecology and Evolution 12:468–474. Wimsatt, W. C. 1974. Complexity and organization. Pp 67–86 in K. F. Schaffner and R. S. Cohen, eds. Biennial Meeting of the Philosophy of Science Association. Reidel, Dordrecht. ———. 1994. The ontology of complex systems: levels of organization, perspectives, and causal thickets. Canadian Journal of Philosophy 20:S207–S274. Wolk, C. P. 1996. Heterocyst formation. Annual Review of Genetics 30:59–78. Wright, S. 1967. Comments on the preliminary working papers of Eden and Waddington. Pp. 117–120 in P. S. Moorehead and M. M. Kaplan, eds. Mathematical challenges to the Neo-Darwinian interpretation of evolution. Wistar Institutional Press, Philadelphia.