The non-polar probes octane, nonane, decane and ... coupled with a refractive index detector (Analysis conditions: mobile phase HPLC grade water, flow rate.
Physicochemical characterization of D-mannitol polymorphs; generation and surface energy analyses by inverse gas chromatography M.G. Cares-Pacheco1, G. Vaca-Medina2, R Calvet1, F. Espitalier1, F. Baillon1, A. Rouilly3, E. Rodier1. 1
Université de Toulouse; Mines Albi, UMR CNRS 5302, Centre RAPSODEE;
Campus Jarlard, F-81013, Albi cedex 09, FRANCE 2
Université de Toulouse; INP-ENSIACET, LCA, 310130, Toulouse, FRANCE 3 INRA;UMR 1010 CAI, 310130, Toulouse, FRANCE
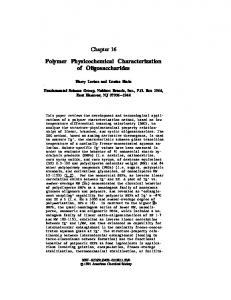
Keywords: D-mannitol, Crystallization, Polymorphism, Solid-state analytical techniques, Inverse gas chromatography 1. Introduction Pharmaceutical solids must comply with well-defined specifications in terms of biodisponibility, purity, toxicity, morphology, stability, size, etc. Most of these substances can exist in several solid-state forms: polymorphs, pseudo-polymorphs, solvates/hydrates or amorphous forms depending on the environmental generation, growth and formulation conditions. This diversity of solids forms requires a thorough understanding of solid-state phenomena that may occur in pharmaceutical solids engineering. Each one of these forms has a different crystalline structure and hence different physicochemical properties. Thus, to ensure a high quality to these organic solids, it is essential characterizing the solid-state forms, both in qualitative and quantitative ways. The characterization of pharmaceutical solids can be studied by a wide variety of analytical techniques. Over the last decade the most frequently used solid-state techniques were in decreasing order, X-ray powder diffraction (XPD), differential scanning calorimetry (DSC), infrared spectroscopy (IR) and microscopy [1]. Most authors use at least two characterization techniques; however, all these methods give information at different levels or different depths within the solid and not especially on the surface. It is well known that surface interactions play a fundamental role in mechanical operations as grinding, milling and compaction; processes commonly used in pharmaceutical formulations. Indeed, an important physicochemical property of solids is the surface energy because it reflects interfacial interactions. It seems therefore of utmost importance to examine and quantify the surface properties of a solid. Subject to a wide number of publications over the last decade, inverse gas chromatography (IGC) appears to be a powerful technique to characterise the surface properties of divided solids [2, 4]. In general, chromatography is a separation technique based on the affinity between two phases, stationary and mobile one. Moreover, IGC is a powerful technique to characterise the surface properties of a divided solid. Developed in the latest 50s, IGC is based on the physical adsorption of gas molecules on a solid surface. Unlike analytical gas chromatography (GC) where a known stationary phase is used to separate and identify an unknown product, in IGC the studied solid is the stationary phase and well identified molecules, called probes, are used to determine the interaction capacities of the unknown material packed into the column (figure 1). The solid-probe separation is the effect of the surface interaction (adsorption-desorption) between these gas molecules and the solid [3]. These physical interactions are dominated by van der Waals forces, whose magnitude depends on the probe nature, allowing then both chemical and morphological studies of divided solids. In addition, IGC allows to study the influence on solid surface of factors such as humidity [4], physical [5] and/or chemical treatments [6].
Figure 1. Principle of Inverse Gas Chromatography
D-mannitol, or hexan-1,2,3,4,5,6-hexol according to IUPAC nomenclature, is a polyhydric alcohol with the chemical formula C6H14O6. It is one of the most common excipients in pharmaceutical products due to its chemical stability and non-hygroscopicity. As an active principle, it has been used for treating renal failure and intracranial hypertension and more recently as a bronchoconstrictor [7]. Several publications in relation to D-mannitol polymorphs can be found; however they are quite confusing and sometimes even contradictory. D-mannitol can exist as four crystalline forms, three anhydrous forms namely α, β and δ and a hemihydrate one. The δ form is enantiotropically related to α and β forms. The most stable form is βmannitol and the less stable at ambient conditions is the δ form. An interesting characteristic of D-mannitol polymorphic system is its kinetic and thermodynamic stability. Indeed it has been observed that the unstable form, δ, can be stable for a period of at least 5 years at room temperature, if stored in dry environment [8]. Both polymorphic physicochemical properties and polymorphic transformation between crystalline forms of D-mannitol in crystallization, mechanical milling and thermal treatment studies have been successfully characterised by multiple solid-state analytical methods [8, 9, 10]. Surface energy analyses by IGC have highlighted the acidic nature of the β form, attributed to the high density of hydroxyl groups at mannitol surface [11]. More recently research is focused on the effect of milling and surface energy heterogeneity [12]. Despite its widespread use in pharmaceutical formulation, studies on the surface energetic properties of mannitol polymorphs have been rarely reported. The aim of this work is to highlight the differences between surface and bulk properties of anhydrous forms of D-mannitol. 2. Materials and Methods 2.1 Materials Analytical grade organic solvents, acetone and methanol, were purchased from Fluka and Across Organic respectively, both with a mass fraction purity higher than 99,5 %. High purity deionized water (18MΩ.cm) was obtained from a laboratory purification system. The non-polar probes octane, nonane, decane and undecane were purchased from Sigma, assay > 99%. D-mannitol was generously supplied by Roquette (France). The batch, Pearlitol 160C, is composed of 99% of β-mannitol mass percentage and only 1% of sorbitol. The solubility of D-mannitol was determined for each dissolution media. Due to the high sensibility of the HPLC Hi-Plex column to organic solvents, the solubility values were determined by HPLC for water and by solvent evaporation for water/acetone and methanol (dry extract method). The solubility of D-mannitol in water was found to be 157mg per g of solution at 20°C. For the mixture water/acetone with a volume ratio of 1:1 the solubility at 20°C was found to be 34mg per g of solution. For pure methanol at 60°C the solubility was found to be 5 mg per g of solution. It has to be noted that the dry extract method is less precise than the HPLC quantification method but it was the only one feasible. 2.2 Polymorphs generation The recrystallization of pure β and δ polymorphs was obtained through an antisolvent crystallization of an aqueous solution of D-mannitol by acetone according to: • Dissolution of 9g of D-mannitol in 50g of water under stirring at room temperature for at least 2 hours. • Filtration of the suspension using a büchner filter equipped with a 2µm membrane. • Addition of 50ml of acetone at room temperature, maintaining a vigorous stirring. To obtain the δ form, the crystals were allowed to grow for maximum 4 minutes. For the β form, longer time periods were used, allowing the polymorphic transformation. For the α-mannitol generation, a crystallization procedure by seeding and fast cooling was used according to: • Dissolution of D-mannitol in methanol at 60°C for 2 hours under stirring (2 g. in 250 ml. of MeOH). • Filtration of the suspension using a büchner filter equipped with a 2µm membrane. • Seeding with a pure physical α form obtained by DSC. • Fast cooling of the filtrate in a ice-ethanol bath under vigorous stirring for 30 minutes. For all samples, the same filtration, drying and storage conditions were used: Büchner filtration with a 2µm membrane, drying in an oven under vacuum, at 30°C and 200mbar for at least 3 days. Finally, all solids samples were stored in a desiccator under vacuum (6% relative humidity). In order to remove the sorbitol
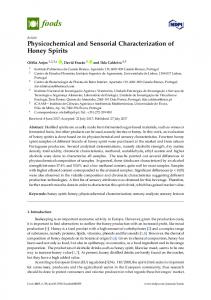
impurity from the commercial powder, at least two-recrystallization processes have been performed per organic solid. 2.2 Analytical methods The DSC measurements were performed with a DSC Q200 from TA Instrument (France). Measurements were performed on samples of 3-5 mg, in the temperature range of 20 to 200°C at a heating rate of 5°C.min-1. All data measurements are averages of at least 3 measures on 3 different samples. Thermogravimetric analyses were obtained using an ATG-DSC 111 from Setaram performing cycles from 298 to 523K at a heating rate of 5°C.min-1. Surface energy analyses of D-mannitol polymorphs were carried out using the IGC-Surface Energy Analyser (IGC-SEA) from Surface Measurement Systems (SMS, UK). Each polymorph sample was packed into pre-silanised columns of 300mm length and 4mm internal diameter. Prior to analysis, each column was conditioned at 50°C for 2 hours at 0% RH. Helium was used as a carrier gas at 10sccm and the column temperature was fixed at 30°C during the analysis. Dead volume was determined by methane injections and surface energy determination by a homologous series of n-alkane vapour (undecane, decane, nonane and octane). For all specific surface area and surface energy determinations, a standard deviation of less than 5% was estimated. For comparison purposes, all columns were filled with the necessary mass for a matching surface area of 0.5m2. 3. Results and Discussion The different crystalline forms of anhydrous mannitol α, β and δ (Figure 2), were characterized by HPLC to quantify chemical impurities and by solid-state analytical methods such as DSC, XPD, TGA, SEM, IR, Confocal Raman spectroscopy and IGC to quantify and qualify physical properties. 3.1 Powder crystallinity and purity The chemical purity of each polymorph was checked by HPLC using a Hi-Plex Ca ligand exchange column coupled with a refractive index detector (Analysis conditions: mobile phase HPLC grade water, flow rate 0.3mL.min-1, column temperature 318K). The XRD patterns (Figure 2) and the IR spectra of D-mannitol pure forms are in agreement with those published in the literature [8], even if no information on chemical purity was given. Despite the fact that each technique provides meaningful information, and no sample preparation is required, they may not be accurate enough and have their own limitations. In fact, they detected no significant differences between the commercial powder (1% of γ-sorbitol) and the recrystallized β form.
Figure 2. XPD patterns of D-mannitol polymorphs
The Raman spectra of D-mannitol polymorphs are shown in Figure 3. These are in excellent agreement with those published in the literature [8,13]. Confocal Raman spectroscopy seems to be a sensitive characterization technique, and it has been used to study polymorph mixtures. Nevertheless, no qualitative or quantitative analysis of the sorbitol presence in the commercial powder has been feasible, maybe due to the
weak intra-intermolecular behaviour differences between D-mannitol and its isomer, sorbitol or due to the poor quantities used in the analysis (1% of sorbitol). Finally, the physical purity of the samples was confirmed by thermal methods.
Figure 3. Raman spectra of D-mannitol anhydrous forms
Thermogravimetric analyses by ATG were used to ensure that no residual solvent was present in the samples. DSC analyses allowed differentiating the commercial powder from the β pure form. Indeed, sorbitol presence in the commercial powder decreases both enthalpy of fusion and melting point of β polymorph. The first endothermic peak at 81.4°C is consistent with the melting point of γ-sorbitol. The endothermic/exothermic event observed in δ form was attributed to a transformation of this crystalline form into a more stable β form. Close values of melting points between α and β mannitol indicate small energetic differences. All these results presented in table I are in agreement with the literature [7, 8, 10]. Table I. Summary of physical solid-state characterization obtained by DSC Pearlitol 160C
β - form
α - form 294.4
Enthalpy of fusion [J.g-1] (onset)
300.2 0.4
304.5
Melting point [°C] (onset)
165.6 81.4
166.7
δ - form 0.9/-2.1 melting/recrystallization
165.3
146.8 /156.2 melting/recrystallization
3.2 Morphology and size As shown in figure 4, the morphology of each polymorph and the commercial samples is different. Important differences can be also found in the literature, mostly attributed to the differences in recrystallization procedures [9, 12]. The commercial sample is formed by irregular sticks with a median volume diameter D[v, 0.5] of 64mm and a D[v, 0.9] of 250mm (Figure 4.d). β-mannitol is composed of better defined sticks with smoother surfaces (Figure 4.a) and it has a D[v, 0.5] of 26.7mm and a D[v, 0.9] of 81.7mm. In both cases, it seems that small particles get stuck on the surface of the larger ones. As expected, since β and δ-mannitol (Figure 4.c) are generated by the same method, both forms are alike with thinner sticks for δ-mannitol. Size differences are linked to crystal growth duration. The α form is the finest one with a needleshape morphology and a D[v, 0.5] of 25.3mm and D[v, 0.9] of 42.4mm (Figure 4.b).
(a)
(b)
(c)
(d)
Figure 4. SEM micrographs of D – mannitol polymorphs; (a) β-form, (b) α-form, (c) δ-form and (d) Pearlitol 160C.
3.3 Specific surface area and Surface energy Different authors have studied surface energy of D-mannitol; a dispersive surface energy noted γ sd of approximately 49mN.m-1 has been determined. In addition, D-mannitol and his stereoisomer L-mannitol have been compared by IGC at infinite dilution and molecular modelling. The authors showed that the L optical form is more energetically active than D-mannitol and suggested that this difference is related to the exposure of particular atoms at the crystal surface [11, 14]. The first approach of D-mannitol polymorphic system by surface energy characterization has been made at infinite dilution (IGC-ID), "surface adsorption at zero coverage". In the case of IGC-ID, a very low concentration of molecule probe is injected. No probe-probe molecular interactions are expected to occur and the adsorption follows Henry's law. The chromatograms have a Gaussian shape and the retention time is independent of the amount of probe injected. For some organic solids this region is almost not observable, the surface area of the samples playing here a key role. In the case of low surface area samples the monolayer capacity of the solid, nm, is easily reached (nads/nm =1, with nads the adsorbed probe amount determined by the net retention volume). Thereby a precise control of the amount injected is crucial, as an example for β and δ mannitol, the ID zone for the n-nonane as probe molecule is limited to a surface coverage of nads/nm < 0.01 and nads/nm < 0.02 respectively. For the α form a more limited ID region has been found nads/nm < 0.001. In table II, are gathered the specific surface areas, using n-nonane as probe molecule, and dispersive surface energies of different polymorphs samples obtained with IGC-SEA. Table II. D-mannitol SEA surface energy analysis following the Dorris-Gray model. Pearlitol 160C
β - form
α - form
δ - form
σ [m2.g-1]
0.42
0.39
8.5
1.01
d
71.8
40.4
74.9
39.4
γs [mN.m-1]
As shown in Table II, the α-form is the most energetically active form with 𝛾!! of 74.9 mN.m-1. While the stable form β-mannitol is less active with 𝛾!! of 40.4 mN.m-1 and not much different of δ form with 𝛾!! of 39.4 mN.m-1. Significative differences have been found between the commercial powder and the β pure form obtained by crystallisation. These differences can be attributed to the impurity presence, particle size and
morphology. Sorbitol influence was “evaluated” via the analysis of the commercial batch Neosorb P100T, constituted by γ-sorbitol, with a dispersive surface energy of 45 mN.m-1. It is well known that IGC-ID characterizes higher energy sites of the solid surface. The value obtained for the stable β form is in agreement, but lowest, with those obtained in the literature via contact angle on a single macroscopic crystal [12]. Indeed, our crystalline β-mannitol is more alike with the lowest energetically active facet (011) with a 𝛾!! of 39.5±0.4 mN.m-1 than with the more energetically active facet (010) with a 𝛾!! of 44.0±0.6 mN.m-1. Contrariwise, the results obtained for the commercial powder are significantly higher than those measured by Ho and co-workers via IGC-ID at 𝛾!! of 49.5±0.4 mN.m-1. 4. Conclusions The results obtained enlightened significant differences between bulk and surface properties of D-mannitol polymorphic system. As each technique provides unique information of the solid, the combination of these techniques allows a good understanding of the solid-state form. The combined set DSC and IGC solid-state techniques highlight both surface-bulk energetic differences and solid heterogeneity. The DSC solid-state analyses were found to be a reliable technique to determine both polymorph purity and impurity detection within all samples. IGC at infinite dilution has shown significant differences between α and β forms, with a most energetically active α mannitol with a 𝛾!! of 74.9 mN.m-1. These founding highlight the use of α polymorph as a Dry Powder Inhaler (DPI), increased by its needle-shape morphology. Hence, needle-like particles are considered to reach easier the deeper lungs with optimum therapeutic benefit. The influence of size and morphology in surface energy behaviour is the subject of separate paper currently in preparation. Acknowledgments: The authors would like to acknowledge Sylvie del Confetto for thermal solid-state measurements and Veronique Nallet for XPD measurements. Gratefully acknowledges to Roquette France for the provision of the pharmaceuticals solids used in this work.
References: [1] N. Chieng, T. Rades, J. Aaltonen. Journal of Pharmaceutical and Biomedical Analysis, 55, 618-644 (2011). [2] R. Ho, J. Heng. Kona Powder and Particle Journal, 30, 164-178 (2013). [3] J.R. Conder and C.L. Young. Physicochemical Mesuarements by Gas Chromatography (1977). [4] G. Buckton, and H. Gill. Advanced Drug Delivery Reviews, 59, 1474-1479 (2007). [5] J.Y. Heng, F. Thielmann and D. Williams. Pharm Res., 8, 1918-1927 (2006). [6] R. Ho, S. Hinder, J. Watts, S. Dilworth, D. Williams, J. Heng. International Journal of Pharmaceutics, 387, 79-86 (2010). [7] P. Tang, H. Chan, H. Chiou, K. Ogawa, M.D. Jones, H. Adi, G. Buckton. International Journal of Pharmaceutics, 367, 51-57 (2009). [8] A. Burger, J. Hetz, S. Rollinger, J.M. Weissnicht. Journal of Pharmaceutical Science, 89, 457-468 (2000). [9] G. Bruni, V. Berbenni, C. Milanese, A. Girella, P. Cofrancesco, G. Bellazzi and A. Marini. Journal of Thermal Analysis and Calorimetry, 95, 871-876 (2009). [10] V. Caron, J.F. Willart, F. Danede and M. Descamps. Solid State Communications, 144, 288-292 (2007) [11] A. Saxena, J. Kendrick, I. Grimsey, L. Mackint. International Journal of Pharmaceutics, 343, 173-180 (2007). [12] R. Ho, M. Naderi, J. Heng, D. Williams, F. Thielmann, P. Bouza, A.R. Keith, G. Thiele and D. Burnett. Pharm Res, 29, 2806-2816 (2012). [13] H. Hao, W. Su, M. Barret, V. Caron, A.M. Healy and B. Glenon. Organic Process Research & Development, 14, 1209-1214 (2010). [14] I.M. Grimsey, M. Sunkersett, J.C. Osborn, P. York and R.C. Rowe. International Journal of Pharmaceutics, 191, 43-50 (1999).