1Department of Kinesiology, California State University, Northridge, Northridge, ... The structure of soccer places great physiological stress on the players, ...
Original Research
Physiological Characteristics of Projected Starters and Non-Starters in the Field Positions from a Division I Women’s Soccer Team FABRICE G. RISSO*1, FARZAD JALILVAND‡1, ASHLEY J. ORJALO*2, MATTHEW R. MORENO*1, DESHAUN L. DAVIS*1, SAMANTHA A. BIRMINGHAM-BABAUTA*1, JOHN J. STOKES*1, ALYSSA A. STAGE*1, TRICIA M. LIU*1, DOMINIC V. GIULIANO*1, ADRINA LAZAR*1, and ROBERT G. LOCKIE‡2 1Department
of Kinesiology, California State University, Northridge, Northridge, CA, USA; 2Department of Kinesiology, California State University, Fullerton, Fullerton, CA, USA *Denotes undergraduate student author, ‡Denotes professional author
ABSTRACT International Journal of Exercise Science 10(4): 568-579, 2017. NCAA soccer features different substitution rules compared to FIFA-sanctioned matches, with a greater availability of players who can enter the game. This could influence the physiological characteristics of the field position starters (ST) and non-starters (NST) within a collegiate women’s team, which has not been previously analyzed. Thus, 22 field players from the same Division I women’s soccer squad completed: vertical and standing broad jumps; 30-meter (m) sprint (0-5, 0-10, 0-30 m intervals); pro-agility and 60-yard shuttle; and the Yo-Yo Intermittent Recovery Test Level 1. Players were defined into ST (n=10) and NST (n=12) by the coaching staff. A one-way ANOVA derived any significant (p≤0.05) between-group differences, and effect sizes were used for a magnitude-based inference analysis. Z-scores were also calculated to document worthwhile differences above or below the squad mean for the groups. The results showed no significant between-group differences for any of the performance tests. ST did have a worthwhile difference above the squad mean in the 0-10 and 0-30 m sprint intervals, while NST had a worthwhile difference below the squad mean in the 0-30 m interval. Physiological characteristics between ST and NST from the analyzed Division I squad were similar, although ST were generally faster. The similarities between ST and NST may be a function of the team’s training, in that all players may complete the same workouts. Nonetheless, if all players exhibit similar physiological capacities, with appropriate substitutions by the coach a collegiate team should be able to maintain a high work-rate throughout a match.
KEY WORDS: Association football, female athletes, sprint acceleration, maximal velocity, z-scores, smallest worthwhile change, magnitude-based inference
INTRODUCTION The structure of soccer places great physiological stress on the players, including elevated blood lactate levels and accumulation of potassium in the muscle interstitium, decreased muscle glycogen, and increased fluid loss (36). All of these factors can contribute to performance decrements, which can often demand the need for player substitutions during a match (5, 7). Factors influencing a substitution during a game can be player fatigue, the score line, experience of players, injuries, or to create match interruptions for tactical benefits (9, 32). Coaches control the substitutions and may replace players to reduce the effects of late-match fatigue across the team, or to modify tactics throughout a game (9, 42). The general structure of women’s soccer played under International Federation of International Soccer (FIFA) or National Collegiate Athletic Association (NCAA) rules are relatively similar. However, a key difference is that all players on an NCAA Division 1 roster are available as substitutes during a match. The average NCAA Division 1 soccer team roster contains 27 players (25); this means 14 players are available as replacements during a match, as opposed to 6 players in matches played under FIFA rules (11). This difference in the substitution rules amongst NCAA- and FIFA-sanctioned matches could influence the inherent physiological characteristics of players, especially for those players that regularly start. Collegiate coaches can make large-scale substitutions if they so choose, and many starting players may not be required to complete the full 90 minutes. The coaching staff may make tactical decisions that results in less playing time for the starting players, but more playing time for the extended squad as they can all be substitutes. This could influence the conditioning of collegiate soccer players, as they may not be required to play full matches (9). A player’s conditioning could influence the distance covered by high-intensity running during a match, which is of great importance to soccer players (35). For example, Vescovi (46) investigated the total high-intensity running distance covered during a match by female collegiate soccer players. By position, forwards covered approximately 475±51 meters (m), midfielders 384±25 m, and defenders 384 ± 25 m during high-intensity running efforts in the first half. During the second half forwards covered 454±47 m, midfielders 378±31 m, and defenders 364±26 m. In order to maintain these high-intensity running efforts, collegiate coaches may make tactical substitutions to limit the effects of fatigue. Fatigue toward the end of a soccer match is related to the depletion of muscle glycogen concentrations in the individual muscle fibers (7), increased muscle acidosis (12, 22), increased muscle lactate concentrations (12), as well as aerobic power corresponding to about 75% of energy expenditure (40). Given that most goals are scored during the last 10 minutes of each half (41), this requires female soccer players to be able to maintain high-intensity running efforts during the latter stages of a match to take advantage of scoring chances, and to prevent the opposing team from scoring. Lower-body strength, speed, and power are factors that have been identified as important contributors to playing time and selection in team sport athletes (15). For example,
Int J Exerc Sci 10(4): 568-579, 2017 international female soccer ST tend perform better in the 30:15 intermittent fitness test, and exhibit greater eccentric knee extensor strength measured by an isokinetic dynamometer at a velocity of 60° per second in comparison to NST (33). There has been some analysis of collegiate female soccer in the literature. Older players (the juniors) having a worthwhile superior performance VJ and SBJ, 30-meter (m) sprint, Yo-Yo Intermittent Recovery Test Level 1 (YYIRT1), and Yo-Yo Intermittent Recovery Test Level 2 (YYIRT2) compared to younger redshirt, freshman and sophomore players (30). With regards to playing positions, midfielders were faster over 5 m time when compared to defenders and goalkeepers, while defenders and midfielders covered a greater YYIRT2 distance compared to goalkeepers (29). However, Lockie et al. (29) also found that there were no significant between-position difference in VJ, SBJ, 0-5 m, 0-10 m, 0-30 m intervals, pro-agility shuttle, Arrowhead COD test, and YYIRT1 (29). This led Lockie et al. (29) to suggest similarities in the physiological characteristics of collegiate female soccer players regardless of position. Whether this is also true for ST and NST is not clear, as there has been no analysis of ST and NST in collegiate female soccer players. Notwithstanding skill levels, if ST and NST have similar capacities, then players could potentially be substituted for one another as dictated by match-play, and a greater level of high-intensity activity could be maintained throughout a game. However, there is no research that has documented the physiological capacities of ST and NST from Division 1 collegiate women’s soccer team in field tests specific to the sport. Thus, the purpose of this study was to determine if there were differences in physiological characteristics across projected ST and NST players in a Division I female soccer team. The physiological characteristics of the players were determined via field tests specific to soccer players. The field tests were: vertical jump (VJ) and standing broad jump (SBJ) performance (34); change-of-direction (COD) speed (proagility and 60-yard shuttle) (46, 47); linear speed (0-5, 0-10, and 0-30 m sprint intervals) (34, 45); and soccer-specific fitness (Yo-Yo Intermittent Recovery Test Level 1 [YYIRT1]) (18). Due to previous research that has suggested female soccer ST tend to display superior physiological characteristics when compared to NST (15, 33), it was hypothesized that the ST would perform better in the physiological tests when compared to the NST. METHODS Participants Twenty-five Division I collegiate women’s soccer players were recruited from the same team. The team had a squad of 30 players, but 5 did not participate in pre-season training due to injuries sustained prior to testing. Data was collected from the goalkeepers (n=3), but due to the dissimilarities in match-play movement demands (5), they were not included in this study. This resulted in 22 field players (i.e. defenders, midfielders, or forwards) being investigated. The team’s coaching staff were consulted to define whether players were projected to start or not start in the upcoming season, and the participant details (mean±standard deviation [SD])) for the projected ST and NST can be seen in Table 1. G*Power software (v3.1.9.2, Universität Kiel, Germany) confirmed that a sample size of 22 was satisfactory for a one-way analysis of variance (ANOVA), between factors analysis. This process ensured the data could be interpreted with a power level of 0.8 when significance was set at 0.05 (8), and a moderate International Journal of Exercise Science
569
http://www.intjexersci.com
Int J Exerc Sci 10(4): 568-579, 2017 effect level of 0.75 (16). The data collected arose during the pre-season by the team’s training staff to assess players performance (49). Thus, the California State University, Northridge ethics committee sanctioned the use of existing data. All players had completed the consent and waiver forms required for collegiate athletics participation. Table 1. Characteristics (mean±SD) of projected starters (ST; n=10) and non-starters (NST; n=12) for a Division I women’s collegiate soccer team. Age (years) Height Body Mass (m) (kg) ST 20.4±1.3 1.67±0.05 59.8±7.1 NST 20.1±1.2 1.66±0.06 62.8±6.6
Protocol The procedures utilized in this study have been adopted in previously published research (26, 27, 29, 30). This provides validity to the approach adopted in this research, and the reader is directed towards these studies for the specifics of the procedures for this research (26, 27, 29, 30). Any new tests will be detailed in full. Testing was conducted prior to gym and field sessions, and all participants were familiar with the tests. At least 48 hours was provided between each session. Four testing sessions were used in this study. Session 1 involved this VJ and SBJ, which was completed in a gym. Three field testing days (sessions 2-4) were utilized and the running tests were completed on a grass outdoor soccer field. Testing session 2 involved the pro-agility and 60-yard shuttle; session; session 3 was the 30-m sprint; and session 4 involved the YYIRT1. A 15-minute recovery was provided between the pro-agility and 60-yard shuttle, and each testing session lasted for approximately 30 minutes. The participant’s age, height, and body mass were recorded in the first session. A standardized warm-up involving jogging, dynamic stretching, and progressive linear and lateral runs were completed before each session. Except for the YYIRT1 which was completed as a group, participants rotated alphabetically by surname for each test to ensure sufficient recovery between trials (28). Participants completed all tests except for the YYIRT1 in the same order across testing sessions 1-3. Three trials were completed for the jump tests, while two trials were completed for each speed assessment. In all cases, the best trial was taken for analysis. Jump height or distance was measured in meters; sprint times were recorded to the nearest 0.01 s. Jump Testing - Vertical and horizontal leg power were indirectly assessed in this study by the VJ and SBJ, respectively. The VJ and SBJ were assessed according to the procedures documented in Lockie et al. (26) and Lockie et al. (29). Linear and COD Speed Testing - The 30-m sprint (including the 0-5 m, 0-10 m, and 0-30 m intervals), and pro-agility shuttle (Figure 1) were conducted according to the practices documented by Lockie et al. (26) and Lockie et al. (29). The 60-yard (54.86-m) shuttle was not conducted in these studies, and thus will be detailed.
International Journal of Exercise Science
570
http://www.intjexersci.com
Int J Exerc Sci 10(4): 568-579, 2017
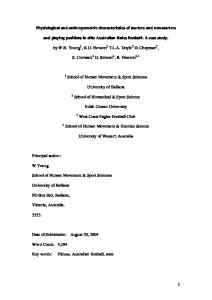
Figure 1. The pro-agility shuttle.
Figure 2. The 60-yard shuttle.
The 60-yard shuttle, shown in Figure 2, has been described as test of physical endurance, lateral speed, and coordination (23), and is novel within soccer research. The procedures used for the test followed that from previous research (27). A single timing gate (TC Timing System, Brower Timing, Utah) was used for this test (height = ~1 m; width = ~1.5 m). Participants started the shuttle from a standing start 50 centimeters behind the start line. They then ran 4.57 m (5 yards) to the first line, touched the line with one hand, before running back to touch the start line. The participant then ran 9.14 m (10 yards) to touch the second line, before running back to the start line to retouch. Lastly, participants ran 13.72 m (15 yards) to the final line, touched, and then sprinted back through the start/finish line. Two trials were completed – one where the participant faced towards the left when touching the ground, and one where the participant faced the right. The order of trials was randomized amongst the sample, and as stated, the fastest trial was analyzed in this study. Yo-Yo Intermittent Recovery Test Level 1 - The YYIRT1 was conducted according to established procedures (18, 20, 29). For the specifics of the YYIRT1 procedures and equipment set-up for this study, readers should consult Lockie et al. (29). Statistical Analysis The statistical procedures adopted for this study were based on previous research (26, 30). Analyses were evaluated using the Statistics Package for Social Sciences (Version 22.0; IBM Corporation, New York, USA). Descriptive statistics (mean±SD) were computed for each variable. Stem-and-leaf plots confirmed a normal distribution for each variable. As stated, participants were defined as projected ST and NST groups by the coaching staff, and a oneway ANOVA (p ≤ 0.05) computed any significant differences between the anthropometrical measures and performance tests. This type of analysis was conducted to minimize the chances of making Type I errors that can occur with multiple t-tests (10). Additionally, effect sizes (d) were calculated, where the difference between the means was divided by the pooled SD (4). The interpretation of d strength followed parameters set by Hopkins (16). This study also included a magnitude based inference analysis via the derivation of z-scores and worthwhile differences. Mean±SD for the z-scores were calculated for the ST and NST, and followed the methods that are illustrated in detail by Lockie et al. (26) and International Journal of Exercise Science
571
http://www.intjexersci.com
Int J Exerc Sci 10(4): 568-579, 2017 Lockie et al. (30). Briefly, and as stated by Lockie et al. (26) and Lockie et al. (30), a worthwhile z-score difference above or below the squad mean was ascertained by calculating the smallest worthwhile change (SWC) in z-score for the test. The SWC was calculated by multiplying the between-participant z-score SD by 0.2 - the typical small effect (16) As these were standardized scores, the SD equalled 1.0, and therefore the SWC is 0.2. Participants that had a z-score difference that exceeded the SWC either positively or negatively (≥0.2 or -0.2) were deemed to have a meaningful difference in that test. RESULTS There were no significant differences in age (p=0.55; d=0.24), height (p=0.85; d=0.18), or body mass (p=0.32; d=0.44) between the ST and NST. There were also no significant differences in physiological characteristics between ST and NST groups for this squad (Table 2). There was a moderate effect for the 2% quicker 0-30 m time for the ST when compared to the NST, but this was not significant (p=0.14). The mean z-scores for the ST and NST are shown in Figure 2, in addition to the SWC both above (z-score=0.2) and below (z-score=-0.2) the overall mean. The ST had a worthwhile zscore difference above the squad mean (i.e. superior performance) for SBJ distance, and 0-10 m and 0-30 m time. The NST had a worthwhile difference below the squad mean (i.e. poorer performance) for 0-30 m sprint time. There were no other test scores for either group that appeared to have a worthwhile difference from the mean. Table 2. Physiological characteristics (mean±SD) of projected starters (ST; n=10) and non-starters (NST; n=12) Division I women’s soccer field players in the: vertical jump (VJ); standing broad jump (SBJ); 0-5 meter (m), 0-10 m, and 0-30 m intervals in a 30-m sprint; pro-agility shuttle (PAS); 60-yard shuttle (60S); and Yo-Yo Intermittent Recovery Test Level 1 (YYIRT1). ST NST p ES VJ (m) 0.50±0.04 0.50±0.05 0.76 0.00 SBJ (m)
1.97±0.14
1.92±0.15
0.44
0.34
0-5m(s)
1.14±0.05
1.15±0.05
0.85
0.2
0-10m (s)
1.98±0.05
1.99±0.07
0.49
0.16
0-30m (s)
4.69±0.13
4.79±0.18
0.14
0.64
PAS(s)
5.04±0.17
5.09±0.17
0.54
0.29
60S(s)
13.45±0.40
13.51±0.32
0.68
0.17
YYIRT1 (m)
1628±481
1690±498
0.77
0.13
International Journal of Exercise Science
572
http://www.intjexersci.com
Int J Exerc Sci 10(4): 568-579, 2017
Figure 3. Z-scores (mean ± SD) and smallest worthwhile change (SWC) above or below the squad mean for projected starting and non-starting Division I women’s soccer field players in the: vertical jump (VJ); standing broad jump (SBJ); 0-5 meter (m), 0-10 m, and 0-30 m intervals in a 30-m sprint; pro-agility shuttle (PAS); 60-yard shuttle (60S); and Yo-Yo Intermittent Recovery Test Level 1 (YYIRT1).
DISCUSSION The focus of this study was to determine if there were differences in physiological capacities between ST and NST in a NCAA Division I women’s soccer team. NCAA-sanctioned soccer matches feature different substitution rules when compared to FIFA-sanctioned games, with greater availability of eligible players, and the opportunity for players to re-enter the game (37). These results have extra value, as the team investigated in this study has historically maintained a winning record within the Big West conference (38). The results indicated that there were no differences between the ST and NST with regards to participant characteristics and physiological capacities. Magnitude-based inferences also indicated that both the ST and NST from this squad were physically similar. This may be reflective of the strength and conditioning practices of the coaching staff for the team investigated in this study, the inherent physical qualities of the players (26, 27, 29, 30), or the recruiting strategies of the head coach and staff (31). Nonetheless, both the projected ST and NST may have been completing the same training sessions throughout the period leading to the time of this study, thus International Journal of Exercise Science
573
http://www.intjexersci.com
Int J Exerc Sci 10(4): 568-579, 2017 contributing to similarities within the squad. Further to this, a soccer squad that is relatively homogenous in physical stature and physiological characteristics could allow for greater flexibility in tactics and formation during a match (14), given that all positional groups are relatively similar. There were no significant differences between the groups in 30-m sprint performance (Table 2). However, the ST had a worthwhile difference above the squad mean for the 0-10 m and 030 m intervals, while the NST had a worthwhile difference below the squad mean for the 0-30 m interval, with the ST being faster (Figure 3). Magnitude-based inferences are widely accepted as a useful criterion for reflecting a meaningful difference in performance (2, 17, 48), and provides a number by which strength and conditioning specialists can judge physiological differences amongst players (2, 17). The ability to perform high-speed running actions such as: sprinting to win possession of the ball, gaining defensive advantage to clear a dangerous play, and generating opportunities to score goals or pass defending players are critical in the outcome of a soccer match (1). Greater speed over 10 m and 30 m could also assist a player to be more involved in a match so as to influence the final result (43). As the data suggested a meaningful difference in the linear speed of ST, this may have contributed to increased playing time for these players (15). In addition, with NST having an apparent meaningful disadvantage in 0-30 m speed, strength and conditioning coaches could focus more specifically on linear speed within the training programs for these players. COD ability is considered a valid criterion for soccer players, given that approximately 1300 directional changes in off-the-ball conditions may be completed during a match (44), as well as provide a different measure of performance than that from tests that feature repeated highintensity running efforts (27). Furthermore, the pro-agility and 60-yard shuttle have been used to assess COD speed in collegiate female soccer players (27, 29, 30, 46). The results of this study showed that the pro-agility and the 60-yard shuttle did not differentiate between ST and NST in a collegiate women’s soccer team (Table 2). Previous research has also shown that the proagility shuttle did not differentiate between playing positions (goalkeepers, defenders, midfielders, and forwards) in collegiate female soccer players (29). This suggests players that either start or come off the bench in the team analyzed in this study demonstrated similar COD ability as measured by the tests in this study. However, even though the pro-agility and 60-yard shuttle can assess COD speed in soccer players (27, 29, 30, 46), there may be other assessments that better isolate this ability. One example is the 505 (39). Future research in collegiate women’s soccer players could be administered using an assessment such as this, as the 505 has a simple design (the test features one 180° COD between two 5-m sprints), and has been adopted by many sports as a valid measure of COD performance (6, 39). The SBJ and VJ have both been used to monitor lower-body power throughout a soccer season (19), and commonly features when testing for talent selection in soccer (24). The results of the current study demonstrated that both ST and NST exhibited similar performance in the VJ and SBJ (Table 2 and Figure 3). Similarities in VJ and SBJ performance has also been shown across different playing positions in female collegiate soccer players (29). However, strength and conditioning coaches may need to monitor how they train leg power and jumping International Journal of Exercise Science
574
http://www.intjexersci.com
Int J Exerc Sci 10(4): 568-579, 2017 performance over the course of a season when considering ST and NST. Kraemer, French, Paxton, Hakkinen, Volek, Sebastianelli, Putukian, Newton, Rubin, Gomez, Vescovi, Ratamess, Fleck, Lynch and Knuttgen (19) showed that jump performance among collegiate female soccer ST tends to decrease throughout the second half of a competitive season, while NST maintained their power performance throughout the season. This reduction in jumping performance may be explained as a result of increased load during matches and total work planned for training throughout a season (19). Strength and conditioning coaches may be required to alter training programs to account for the increased load on collegiate female soccer players who start in order to maintain lower-body power throughout a competitive season. The YY1RT1 was designed to evaluate the intermittent-endurance ability of soccer players (20). It has been shown to be a reliable and valid measurement of match-related fitness performance in soccer (20, 27) and has been used extensively in this sport (20, 21). In this study, ST and NST demonstrated no significant differences in the YYIRT1 (Table 2), and this has also been shown in between-position comparisons in a similar population (29). It should be noted that these players covered a comparable distance in the YYIRT1 when compared to elite female soccer players (21). Krustrup, Mohr, Ellingsgaard and Bangsbo (21) documented that elite players covered a total distance of approximately 1600 m. As both the ST and NST for this team were similar, and were comparable to elite players (21), this data suggests that the coaches should have the confidence in substituting a player in a match with the expectation that player workrate across the team should be maintained. With the ability of high amounts of substitutions in an NCAA match (37), this provides multiple opportunities for a coach to potentially alter a match via tactical substitutions. There are select limitations within the study that should be acknowledged. The sample size was relatively small (n=22), as only one collegiate team was analyzed. Future research could investigate multiple Division I teams to provide a larger sample size, and potentially more generalized conclusions. Nonetheless, the size of the team analyzed is indicative of collegiate female soccer teams, and even with the group size of the ST (n=10) and NST (n=12), the interindividual variation can still be informative for coaches (14). This study did not specifically assess repeated-sprint ability (RSA), despite its stated importance to soccer (3). Gabbett (13) has designed an RSA test specific to elite female soccer players, and future research should include this test to measure this capacity especially in collegiate female soccer players. Additionally, a skill-based test (e.g. a test incorporating, dribbling, passing, and shooting) was not included in this study. Given that player skill could be determining factor in whether a player is chosen to start or come off the bench (13), this is a limitation that should be rectified in future research. In conclusion, the physiological characteristics amongst ST and NST from the analyzed Division I collegiate soccer squad were physically and physiologically similar. Some worthwhile differences measured by magnitude-based inference was observed in linear speed, with ST being faster in the 0-10 m and 0-30 m intervals, while NST were slower over 30 m. These differences in linear speed may have had some influence on player selection. However, International Journal of Exercise Science
575
http://www.intjexersci.com
Int J Exerc Sci 10(4): 568-579, 2017 both ST and NST were similar in jump, COD, and high-intensity running performance. If ST and NST represent physical similarities, with the more flexible NCAA substitution rules, a collegiate team should be able to maintain a relatively high work-rate throughout a Division I soccer match with appropriate substitutions. ACKNOWLEDGEMENTS This study received no external funding, and no authors have a conflict of interest. Thanks to Keith West, Jeff Crelling, John Lockwood, and Sarah Mock for their assistance and support of this research. REFERENCES 1. Bradley PS, Di Mascio M, Peart D, Olsen P, Sheldon B. High-intensity activity profiles of elite soccer players at different performance levels. J Strength Cond Res 24(9):2343-2351, 2010. 2. Buchheit M. The numbers will love you back in return-I promise. Int J Sports Physiol Perform 11(4):551-554, 2016. 3. Buchheit M, Mendez-Villanueva A, Delhomel G, Brughelli M, Ahmaidi S. Improving repeated sprint ability in young elite soccer players: repeated shuttle sprints vs. explosive strength training. J Strength Cond Res 24(10):2715-2722, 2010. 4. Cohen J. Statistical Power Analysis for the Behavioral Sciences 2nd ed. Hillsdale, New Jersey: Lawrence Earlbaum Associates; 1988. 5. Datson N, Hulton A, Andersson H, Lewis T, Weston M, Drust B, Gregson W. Applied physiology of female soccer: an update. Sports Med 44(9):1225-1240, 2014. 6. Draper J, Lancaster M. The 505 test: A test for agility in the horizontal plane Aust J Sci Med Sport 17 15-18, 1985. 7. Ekblom B. Applied physiology of soccer. Sports Med 3(1):50-60, 1986. 8. Faul F, Erdfelder E, Lang AG, Buchner A. G*Power 3: a flexible statistical power analysis program for the social, behavioral, and biomedical sciences. Behav Res Methods 39(2):175-191, 2007. 9. Favero T, Conte D, Neiderhausen M, Tessitore A, LaPlante M. Substitution patterns in women’s division I college soccer: Game strategy or fatigue prevention. In: International Research in Science and Soccer II. T Favero, B Drust and B Dawson eds. Taylor & Francis Group: Abingdon, England, 2016. 10. Feise RJ. Do multiple outcome measures require p-value adjustment? BMC Med Res Methodol 2:8, 2002. 11. FIFA. FIFA Laws of the Game 2015/2016. Federation Internationale de Football Association: Zurich, Switzerland. 2016. 12. Fitts RH. Cellular mechanisms of muscle fatigue. Physiol Rev (74):49-94, 1994. 13. Gabbett TJ. The development of a test of repeated-sprint ability for elite women's soccer players. J Strength Cond Res 24(5):1191-1194, 2010.
International Journal of Exercise Science
576
http://www.intjexersci.com
Int J Exerc Sci 10(4): 568-579, 2017 14. Hencken C, White C. Anthropometric assessment of premiership soccer players in relation to playing position. Eur J Sport Sci 6(4):205-211, 2006. 15. Hoffman JR, Tenenbaum G, Maresh CM, Kraemer WJ. Relationship between athletic performance tests and playing time in elite college basketball players. J Strength Cond Res 10(2):67, 1996. 16. Hopkins W. How to interpret changes in an athletic performance test Sports Sci 8:97-104, 2004. 17. Hopkins WG. Measures of reliability in sports medicine and science. Sports Med 30(1):1-15, 2000. 18. Karakoc B, Akalan C, Alemdaroglu U, Arslan E. The relationship between the yo-yo tests, anaerobic performance and aerobic performance in young soccer players. J Hum Kinet 35:81-88, 2012. 19. Kraemer WJ, French DN, Paxton NJ, Hakkinen K, Volek JS, Sebastianelli WJ, Putukian M, Newton RU, Rubin MR, Gomez AL, Vescovi JD, Ratamess NA, Fleck SJ, Lynch JM, Knuttgen HG. Changes in exercise performance and hormonal concentrations over a Big 10 soccer season in starters and nonstarters. J Strength Cond Res 18(1):121-128, 2004. 20. Krustrup P, Mohr M, Amstrup T, Rysgaard T, Johansen J, Steensberg A, Pedersen PK, Bangsbo J. The Yo-Yo Intermittent Recovery Test: Physiological response, reliability, and validity. Med Sci Sports Exerc 35(4):697-705, 2003. 21. Krustrup P, Mohr M, Ellingsgaard H, Bangsbo J. Physical demands during an elite female soccer game: Importance of training status. Med Sci Sports Exerc 37(7):1242-1248, 2005. 22. Krustrup P, Mohr M, Steensberg A, Bencke J, Kjaer M, Bangsbo J. Muscle metabolites during a football match in relation to a decreased sprinting ability. Communication to the Fifth World Congress of Soccer and Science; 2003. 23. Kuzmits FE, Adams AJ. The NFL combine: does it predict performance in the National Football League? J Strength Cond Res 22(6):1721-1727, 2008. 24. Le Gall F, Carling C, Williams M, Reilly T. Anthropometric and fitness characteristics of international, professional and amateur male graduate soccer players from an elite youth academy. J Sci Med Sport 13(1):90-95, 2010. 25. Lim JJ, Kong PW. Effects of isometric and dynamic postactivation potentiation protocols on maximal sprint performance. J Strength Cond Res 27(10):2730-2736, 2013. 26. Lockie RG, Davis DL, Birmingham-Babauta SA, Beiley MD, Hurley JM, Stage AA, Stokes JJ, Tomita TM, Torne IA, Lazar A. Physiological characteristics of incoming freshmen field players in a men’s Division I collegiate soccer team. Sports 4(2):doi:10.3390/sports4020034, 2016. 27. Lockie RG, Jalilvand F, Moreno MR, Orjalo AJ, Risso FG, Nimphius S. Yo-Yo Intermittent Recovery Test Level 2 and its relationship to other typical soccer field tests in female collegiate soccer players. J Strength Cond Res Publish Ahead of Print 2016. 28. Lockie RG, Jeffriess MD, Schultz AB, Callaghan SJ. Relationship between absolute and relative power with linear and change-of-direction speed in junior American football players from Australia. J Aust Strength Cond 20(4):4-12, 2012.
International Journal of Exercise Science
577
http://www.intjexersci.com
Int J Exerc Sci 10(4): 568-579, 2017 29. Lockie RG, Moreno MR, Lazar A, Orjalo AJ, Giuliano DV, Risso FG, Davis DL, Crelling JB, Lockwood JR, Jalilvand F. The physical and athletic performance characteristics of Division I collegiate female soccer players by position J Strength Cond Res Publish Ahead of Print 2016. 30. Lockie RG, Stecyk SD, Mock SA, Crelling JB, Lockwood JR, Jalilvand F. A cross-sectional analysis of the characteristics of Division I collegiate female soccer field players across year of eligibility. J Aust Strength Cond (24):6-15, 2016. 31. Magnusen MJ, Kim Y, Perrewé PL. Gaining a competitive edge when recruiting student-athletes: The role of political skill. Int J Sports Sci Coach (9):1291-1310, 2014. 32. Malte S, Martin L. Game interruptions in elite soccer. J Sports Sci 30(7):619-624, 2012. 33. Manson SA, Brughelli M, Harris NK. Physiological characteristics of international female soccer players. J Strength Cond Res 28(2):308-318, 2014. 34. McCurdy KW, Walker JL, Langford GA, Kutz MR, Guerrero JM, McMillan J. The relationship between kinematic determinants of jump and sprint performance in division I women soccer players. J Strength Cond Res 24(12):3200-3208, 2010. 35. Mohr M, Krustrup P, Andersson H, Kirkendal D, Bangsbo J. Match activities of elite women soccer players at different performance levels. J Strength Cond Res (22):341-349, 2008. 36. Mohr M, Krustrup P, Bangsbo J. Fatigue in soccer: A brief review. J Sports Sci 23(6):593-599, 2005. 37. NCAA. NCAA Rules and Interpretations 2014/2015. National Collegiate Athletic Association: Indianapolis, Indiana, 2014. 38. N NCAA. Big West Conference women's soccer. Available: http://www.bigwest.org/sports/wsoccer/. 2016. 39. Nimphius S, Callaghan SJ, Spiteri T, Lockie RG. Change of direction deficit: A more isolated measure of change of direction performance than total 505 time. J Strength Cond Res 30(11):3024-3032, 2016. 40. Reilly T. Energetics of high-intensity exercise (soccer) with particular reference to fatigue. J Sports Sci 15(3):257-263, 1997. 41. Reilly T. Motion Analysis and Physiological Demands. In: Science and Soccer. T Reilly and MA Williams eds. Routledge: London, England, 2003. pp. 59-72. 42. Reilly T, Drust B, Clarke N. Muscle fatigue during football match-play. Sports Med 38(5):357-367, 2008. 43. Rienzi E, Drust B, Reilly T, Carter JE, Martin A. Investigation of anthropometric and work-rate profiles of elite South American international soccer players. J Sports Med Phys Fitness 40(2):162-169, 2000. 44. Stolen T, Chamari K, Castagna C, Wisloff U. Physiology of soccer: An update. Sports Med 35(6):501-536, 2005. 45. Vescovi JD. Sprint speed characteristics of high-level American female soccer players: Female Athletes in Motion (FAiM) study. J Sci Med Sport 15(5):474-478, 2012. 46. Vescovi JD, Brown TD, Murray TM. Positional characteristics of physical performance in Division I college female soccer players. J Sports Med Phys Fitness 46(2):221-226, 2006.
International Journal of Exercise Science
578
http://www.intjexersci.com
Int J Exerc Sci 10(4): 568-579, 2017 47. Vescovi JD, McGuigan MR. Relationships between sprinting, agility, and jump ability in female athletes. J Sports Sci 26(1):97-107, 2008. 48. Winter EM, Abt GA, Nevill AM. Metrics of meaningfulness as opposed to sleights of significance. J Sports Sci 32(10):901-902, 2014. 49. Winter EM, Maughan RJ. Requirements for ethics approvals. J Sports Sci 27(10):985, 2009.
International Journal of Exercise Science
579
http://www.intjexersci.com