Pitch as a Medium: A New Approach to Psychophysical Scaling Author(s): Fred Attneave and Richard K. Olson Source: The American Journal of Psychology, Vol. 84, No. 2 (Jun., 1971), pp. 147-166 Published by: University of Illinois Press Stable URL: http://www.jstor.org/stable/1421351 . Accessed: 04/08/2014 15:35 Your use of the JSTOR archive indicates your acceptance of the Terms & Conditions of Use, available at . http://www.jstor.org/page/info/about/policies/terms.jsp
. JSTOR is a not-for-profit service that helps scholars, researchers, and students discover, use, and build upon a wide range of content in a trusted digital archive. We use information technology and tools to increase productivity and facilitate new forms of scholarship. For more information about JSTOR, please contact
[email protected].
.
University of Illinois Press is collaborating with JSTOR to digitize, preserve and extend access to The American Journal of Psychology.
http://www.jstor.org
This content downloaded from 128.138.223.67 on Mon, 4 Aug 2014 15:35:10 PM All use subject to JSTOR Terms and Conditions
PITCH AS A MEDIUM: A NEW APPROACH TO PSYCHOPHYSICAL SCALING
Fred Attneave and Richard K. Olson University of Oregon
Certain psychophysicalcontinua have a primarilymorphophoricfunction: they are the media in which patterns occur. The appropriate scale for any
such mediumis one that reflectsthe invariancespreservedin transposition behavior. The results of two experiments designed to scale pitch by transposition methods lead to the conclusion that the musical scale, not the mel scale, describes the morphophoric function of pitch. However, an abrupt
breakingpoint is evident at about 5,000 Hz, above which transposition behavioris erratic.
Psychophysics has a curiously autonomousstatus in contemporary psychology. The measurementof elementary sensations is obviously importantif sensationsare viewed as the buildingblocks of perception.Since this view has not been widely entertainedfor some five decades,however,one is entitled to wonderwhy psychophysicists go on measuringsensationswith undiminishedzeal. The basic fact that perceptionis relationally determined-that perceptual objectsowe their identity to certainrelationalinvariantsof patterns or configurations-has profoundconsequencesfor the psychophysical treatment of such commonly investigated continua as brightness,loudness,and pitch. A major defect of conventionalpsychophysicsis its failureto take these consequencesinto account. Consider the example of pitch, with which this article is specifically concerned.Rather diverse methods (summatedjnds, interval judgments,ratio judgments) yield fairly consistent results for pitch: essentially, the mel scale. (See Stevens, Volkmann, and Newman, 1937; Stevens and Volkmann, 1940.) What these 147
This content downloaded from 128.138.223.67 on Mon, 4 Aug 2014 15:35:10 PM All use subject to JSTOR Terms and Conditions
148
ATTNEAVEAND OLSON
methodshave in common,for all their diversity, is that they treat individualtones as perceptualobjects, or psychologicalunits, each of which is conceivedto have its characteristicpitch sensation, or value on the attribute of pitch. Things are differentoutside the laboratory: people rarely treat individualtones as auditory units or tie particularbehaviorsto particularpitches, nor would it be adaptive for them to operatein such a manner.A very simple case of an auditory unit with realistic object propertiesis that of a brief sequenceof tones, as in a melodic phrase.It is well known that such a sequenceis transposable:the pattern as a whole may be raisedor lowered in pitch without destroying its perceptual identity. The corollaryof this statement is that pitch is a medium,in which the same patternmay have differentlocations. An appropriatescale of pitch, so considered,is one that describes its morphophoric,or form-bearing,properties.The simplest such scale would be one on which any two perceptuallyequivalentpatterns differedonly by an additive constant.Let us inquirewhether a scale of this kind exists for pitch, and if so, what psychophysical transformationon frequencywill yield it. If musical conventionsare to be taken at face value, a logarithmic transformationgives the desired scale. Adding a constant to the log frequencyof every note in a melodymay changeits key, but not its musical identity. However, the musical scale is not in agreementwith the mel scale; a musical interval near 6,000 Hz contains more than six times as many mels as the 'same' interval near 100 Hz. This disagreementmight be interpretedin a variety of ways. One possibility is that the musical scale is right, and the mel scale wrong, with respect to pitch as a medium.At the other extreme,it might be arguedthat musical equivalenceis moreor less arbitrary-being based perhapson the structureof musical instruments, perhaps on relationships between harmonics of tones soundedtogether-and that undersomeideal conditionspeoplewould actually transposeon the mel scale. A third possibility, of course, is that the scale optimally describingequivalencesamong patterns remainsundiscovered. In the experimentsreported here, our purpose was to infer a morphophoricscale of pitch from transpositionbehavior obtained underconditionsas free of irrelevantinfluencesas possible.To this end we employedpatterns consistingof pure tones, presentedsuccessiveiy, at a level (40 db) low enough to render aural harmonics negligible over a major portion of the range investigated.
This content downloaded from 128.138.223.67 on Mon, 4 Aug 2014 15:35:10 PM All use subject to JSTOR Terms and Conditions
149
PITCH AS A MEDIUM
EXPERIMENT I
The generalplan of the first experimentwas to present the subject with tonal patterns from various parts of the frequencyspectrum, and have him reproducethese patterns in a standardmiddle region.Each patternpresentedwas madeup of only two frequencies, no more than an octave apart, alternatedwith variable durationto formsome distinctive,repetitivetemporalconfiguration. Method --Subjects--Six paid student volunteers from the University of Oregon were selected to provide different levels of musical experience and ability. We were particularly interested in whether the subject had any effective verbal structure for the classification of intervals in musical terms. The two subjects we designate as musical were able to identify common musical intervals (either by names like 'third,' 'fifth,' and so on, or by assigning the component notes to a sol-fa scale), and likewise to construct intervals with pure tones, given their values. One of these, JF, was a female voice major who, played the piano and who had sung leading roles in several local musicals. The other, DM, was a male graduate student in psychology who sang and played the guitar. None of the four subjects designated nonmusical had any definite verbal structure for describing intervals. One of them, however, RB, a male graduate student in psychology, had studied piano briefly as a small child, was strongly interested in music, and spent a great deal of time listening to both 'classical' music and jazz. The remaining three, KN, SD, and LC, were female undergraduatesnone of whom had more than a very casual interest in music. Three other nonmusical subjects were dropped from the experiment because they failed to meet a minimum performance criterion. -Materials and apparatus-The stimuli are described in essentially musical terms. Each tone is represented by a pair of numbers such as 2-5 or 6-12. The first number designates the octave in which the tone occurs; the second its position within that octave on a 12-tone or chromatic scale, each step of which is exactly one-twelfth of a log2 frequency unit. Middle C (261.6 Hz) is called 3-1; thus 3-10 is the A above middle C (440 Hz), 4-10 is the A an octave higher (880 Hz), and so on. The tones employed covered a sevenoctave range, from 1-7 (92.5 Hz) to 8-7 (11,840 Hz). The 'stimulus' to be matched on a given trial was always a temporal pattern of two such tones within an octave of each other. The sequencing mechanism consisted of a phonograph turntable (rotating at 33 rpm) on which rested a cardboarddisc extending beyond its edge. This disc was divided into 16 equal sectors, any combination of which could be cut away beyond the edge of the turntable to provide a photoelectric cam. Transparent sectors allowed a beam of light to strike a photocell; opaque sectors interrupted it. The photocell in turn controlled a circuit that switched back and forth between the two tones without temporal overlap, but without a noticeable interval between the
This content downloaded from 128.138.223.67 on Mon, 4 Aug 2014 15:35:10 PM All use subject to JSTOR Terms and Conditions
150
ATTNEAVEAND OLSON
alternating tones. Switching clicks were not altogether eliminated by the circuitry but were held to an unobtrusive level. Typical patterns (in terms of duration of successive tones) were such cycles as 113146113146..., and so on. Each of the 222226222226..., two tones occurred three times in every cycle; there were six alternations per cycle. However, the tones were not necessarily equated for total duration; therefore every trial on which a pair of tones was pulsed by a particular cam disc was counterbalancedby another trial on which the same pair was pulsed by the 'negative' of that disc, so that the higher and lower tones exchanged places. In all, 24 discs were used, 12 basic patterns and their 'negatives.' Assignment of tone pairs to discs was random, except for the counterbalancing noted above. The aim in using these rhythmic cycles was to make the object perceived a pattern or configuration,even though only two frequencies were involved. (That this aim was not altogether unrealistic is illustrated by such a familiar example as the first four notes of Beethoven's Fifth Symphony.) Given a standard or 'stimulus' pattern of this kind, the subject's task was to match it (to construct a pattern as much like it as possible) in a different frequency region. He did this by adjusting a single oscillator, since one tone of the comparison or 'response' pattern was fixed by the experimenter and served as an anchor. By means of a hand switch, the subject could freely choose at any time during a trial to listen to either the stimulus pattern or the response pattern. This switching operation was on the inputs to the photoelectric cam mechanism; therefore the stimulus and response patterns were identical in their temporal or rhythmic aspects. Over trials, 84 different pairs of tones were employed in stimulus patterns: 12 intervals (1-12 chromatic steps) were presented in each of seven octaves. The midpoint of the interval was always a C (2-1, 3-1, . . .,
8-1) in the case
of even-numberedintervals, or half a chromatic step higher in the case of oddnumbered intervals. The response pattern was invariably anchored in the 5-1 to 6-1 octave, the region between 1,046.5 and 2,093 Hz. The distance between the anchor tone in this pattern and its counterpart in the stimulus pattern was always an integral number of octaves minus half an octave (six chromatic steps). This means that a strictly musical transposition demanded the greatest possible change in key, as from C to F-sharp. The tones making up the stimulus patterns were generated by a GraysonStadler Twin 950C oscillator. Those in the response patterns were produced by two RCA WA-44C oscillators. One of the latter was located in front of the subject in a sound-attenuated room; all other major items of equipment were located in a separate control room with the experimenter. No attempt was made to calibrate the oscillators accurately for frequency. Instead, all frequencies were determined by a vernier stroboscope, Conn Instrument's Strobocon 6T4. This remarkable device provided a degree of precision far beyond the requirements of the present study, even if one liberally discounts the manufacturer'sclaim of ?-.05% accuracy. It seemed advisable to present all tones at a constant loudness. The sensation level of 40 db was chosen as a compromise between two objectives: to hold aural harmonics to an insignificant level, and to make the tones loud enough to be heard comfortably. (Results were also spot-checked at 20 db.) To maintain constant loudness, we needed to know what voltages to apply
This content downloaded from 128.138.223.67 on Mon, 4 Aug 2014 15:35:10 PM All use subject to JSTOR Terms and Conditions
PITCH AS A MEDIUM
151
to the output tranducers-a pair of Koss Pro-4 headphones--at the various frequencies represented in stimuli. This information was obtained directly (that is, without separately considering the transfer functions of phone and ear) by having four preliminary subjects adjust in amplitude each of the 85 frequencies employed (on two trials, one ascending, one descending) to match the loudness of a 1,000-Hz tone 40 db above threshold. The four resulting curves were in excellent agreement with one another, and were averaged to provide the values of output voltage subsequently used. Amplitudes of the two stimulus tones and the anchor tone of the response pattern were controlled manually by the experimenter. Uniform loudness of tones from the subject's oscillator was achieved by a mechanical linkage of controls: a springloaded arm from the amplitude knob rode on a carefully machined bronze cam attached to the frequency dial. A cardboard disc, also attached to the frequency dial, hid most of this mechanism as well as the frequency markings onrthe dial. -Procedure-Subjects were first checked for adequate sensitivity over the experimental frequency range. They were asked if the highest tone used seemed about as loud as the 1,000-Hz reference tone at 40 db. They were then spot-checked throughout the experimental range to ensure that they had no lacunae. Their ability or inability to identify musical intervals was also ascertained, as described. The task was then presented to them as simply a matching of 'patterns' or 'tunes.' They were never told that they should match patterns by musical standards, or that they should refrain from doing so, but merely that whatever sounded like the same pattern was the desired response. Subjects were familiarized with the task in a series of practice trials. The first 12 practice patterns, given on days 1 and 2, were drawn from the two octaves overlapping the response octave and extending half an octave beyond it in either direction. Feedback was given with special care to avoid imposing any particular scale on the subject's judgments. Thus, he was asked to reconsider his response if it was grossly beyond the limits of a mel match, a musical match, or anything in between; this was quite practical in view of the small range. Also, he was specifically shown his error if he reversed the ordinal relationship of the tones or if he set his tone to the same frequency as the corresponding stimulus tone. Twelve more practice trials, on days 3 and 4, were drawn randomly from the whole experimental range. On these, the subject was corrected only for qualitative errors: ordinal reversals and identity or octave matches. Three subjects who were unable to eliminate such qualitative errors (and moreover showed exceedingly high variability) were dropped after the practice trials. In the body of the experiment, the subject was given a total of eight trials (two series of four) on each of the 84 stimulus pairs. The four trials within a series represented the possible combinations of two procedural variables: (a) whether the subject adjusted the high or the low tone of the pair, and (b) whether he began the trial with his oscillator set at the high or the low end of its range. These (4 x 84) trials were given in a random order, with the restriction that a given combination of the two variables just mentioned not occur twice in succession. Assignment of temporal patterns (photoelectric cams) to trials was also random. The whole series was then repeated in a
This content downloaded from 128.138.223.67 on Mon, 4 Aug 2014 15:35:10 PM All use subject to JSTOR Terms and Conditions
152
ATTNEAVEAND OLSON
new random order, but the photoelectric cam used on any given trial was the
'negative'of that used on its counterpartin the firstseries. The subjectwas told to listen firstto the stimuluspatternand then adjust the responsepatternto matchit, switchingbackto the stimuluspatternwhen-
ever necessary. Each experimental session lasted about an hour and included 20 trials, more or less, depending on the subject's speed and endurance. He was allowed as much time as he needed to make:a setting. Results and discussion
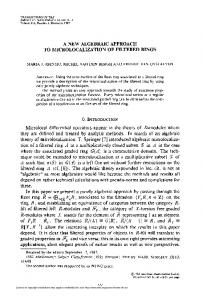
The eight responses a subject made to each stimulus pair were averaged, thus yielding a mean transposed interval value. (The averaging was all done on a log frequency scale because of the relative uniformity of variability in these terms. The means so obtained are not systematically different from medians; see Experiment II.) These values are plotted for each subject in the six graphs of Figure 1. The abscissa of each graph is essentially a log frequency scale, and a given 'column' represents stimulus intervals that have the same logarithmic midpoint.' The subject's matching interval (in the 5-1 to 6-1 response octave, 1,046.5-2,093 Hz) is shown on the ordinate in terms of chromatic steps, or twelfths of an octave, with a separate function for each stimulus interval labeled in similar terms. A graph representing perfect transposition by musical standards would thus consist of 12 horizontal straight lines intersecting the ordinate at the correspondingly numbered points. The two musical subjects, JF and DM, showed very similar behavior. To a good approximation, they transposed on a logarithmic or musical scale over the first five octaves. In the two highest octaves their curves, as shown in Figure 1, remain fairly flat for small intervals (up to about five chromatic steps), but for larger intervals a gross breakdown occurs. In the sixth (next to highest) octave, JF markedly compresses the three largest intervals and DM the seven largest ones; this dip is so extreme that in several cases a large interval is reproduced smaller than one only half its size. In the highest octave, DM shows a surprising recovery, or decompression of the large intervals (though his ordering is still by no means perfect); JF shows a similar decompression of intervals 10, 11, and 12, but a new compression of intervals 6, 7, and 9. Both JF and DM reported that high tones (above about 5,000 Hz) lacked the musical quality characteristic of lower ones. Considering that the higher tone of a pair increased in frequency as interval size increased about a given midpoint, we can inquire
This content downloaded from 128.138.223.67 on Mon, 4 Aug 2014 15:35:10 PM All use subject to JSTOR Terms and Conditions
153
PITCH AS A MEDIUM
DM
SJF
4
4,2
4-1
2-1-3-
5-
6-1
7-1
8 ?
2-1
7-3
4-
12
RB
R,,C
f
E
KN
It
91
0 6
10 ,,,T
5
s
4
12 |2
2-I
43-4
61
4-4
2-1
4
6-
7-1
e-e
740-1
12FLU
SD
If5
1
1
LC
9T
9
7-1 6.1 2-1 + 4-1 5-1 6-1 9-(I
2l 4-4 1 FREQUENCY
LEVEL
OF
STIMULUS
Fig. 1. Transposition functions for individual subjects in Experiment I. Each curve shows matching responses to a particular stimulus interval of 1 to 12 chromatic steps presented at various frequency levels. Points on the abscissa are an octave apart and represent the midpoints of stimulus intervals; 3-1 is middle C, 261.6 Hz.
This content downloaded from 128.138.223.67 on Mon, 4 Aug 2014 15:35:10 PM All use subject to JSTOR Terms and Conditions
154
ATTNEAVEAND OLSON
what frequency the higher tone had in the pair on which the subject first showed a marked (ordinal) aberration. This value was 5,587.6 Hz for JF, and 4,978 Hz for DM. (Variability data provide further evidence for a discontinuity of process in this region.) It may be that JF and DM were most confused when one tone of a pair was within the musical range and the other above it, and less so when both tones were lacking in musical quality. The four nonmusical subjects differed greatly from one another in their transposition behavior. For RB, musical intervals were roughly invariant over frequency; the only systematic deviation of his functions from horizontality (Figure 1) reflects some overestimation of small intervals at high frequencies. Although generally more variable than the musical subjects, he showed relatively less confusion at high frequencies. He did show a consistent tendency to expand small intervals and contract large ones, regardless of frequency. The performance of SD (Figure 1) seems to show a modest, irregular tendency for musical intervals to increase in apparent size with frequency, but in neither form nor degree does this variation suggest that she was transposing on anything like a mel scale. What is most striking in her results is the tremendous contraction of all but the smallest intervals, often by a factor of two or more. This might be viewed as a kind of time-order error, but its magnitude is difficult to explain. Subjects KN and LC were somewhat similar to each other in that their functions (Figure 1) tend to peak in the middle of the frequency range, and fall off toward the extremes. In Figure 2 their functions are shown in normalized form. The hypothesis that these subjects were transposing on a mel scale is quite untenable, since the function describing mels per increment in log frequency (shown with Xs in Figure 2) peaks much too high, in the 7-1 region. In principle, it would be possible to derive scales for KN and LC by averaging and integrating the functions of Figure 2. A variety of suspicions and misgivings restrain us from doing so. One disquieting possibility, suggested especially by the performance of LC, is that response intervals vary as a decreasing function of the distance of the stimulus pattern from the response region. If this were the only difficulty, it could be remedied by a counterbalancing of stimulus and response regions. Of more fundamental concern, however, are the indications that SD, KN, and LC were employing idiosyncratic judgmental or response heuristics inconsistent with
This content downloaded from 128.138.223.67 on Mon, 4 Aug 2014 15:35:10 PM All use subject to JSTOR Terms and Conditions
155
PITCH AS A MEDIUM
,
o
to6
w ,, i.6
LW
A
KN
w
LC
tl
2
.
I
0o
2 -
)- O31
4-1
5
6-1
7-1
8-1
2-1
FREQUENCYLEVEL OF
31
4-
34
6-t
7-1
8-I
STIMULUS
Fig. 2. Normalized functions for subjects KN and LC, Experiment I. Each curve from Figure 1 has been divided by the mean of its values at 5-1 and 6-1, so that all curves intersect in the middle of the response region. Musical transposition would be represented by a horizontal through 1.0; mel-scale transposition by the unconnected Xs.
the task assigned them, which was to make the response pattern sound as much like the stimulus pattern as possible. Note, for example, that a scale based on SD's intervals 2, 3, and 4 (Figure 1) would have little resemblance to one derived from her intervals 10, 11, and 12: the former functions rise steadily with frequency, more than doubling between 2-1 and 7-1, whereas the latter seem to follow a peculiar sinusoidal course, ending up about where they begin. Again, note that KN's transposition of interval 1 is markedly different from her transposition of all the others (Figures 1 and 2); also that her functions for intervals 6, 7, and 8 peak at a lower frequency than those for intervals 9, 10, 11, and 12. Any such interaction with interval size, whatever its source, clearly violates the assumptions of the scaling procedure we set out to employ. These and other considerations led us to the alternative paradigm described in Experiment II. Meanwhile, let us not lose sight of the fact that the musical subjects JF and DM gave us a close approximation to musical transposition, except in the two highest octaves, and that the behavior of RB (who, it may be recalled, was a devoted music listener, though he had no verbal categories for intervals) was also quite reasonably consistent with the musical scale.
This content downloaded from 128.138.223.67 on Mon, 4 Aug 2014 15:35:10 PM All use subject to JSTOR Terms and Conditions
156
ATTNEAVE AND OLSON
Some of the most interesting results of this experiment emerge from an analysis of variability data, which are now described. Every point in Figure 1 is a mean of eight judgments, over which three procedural variables were counterbalanced. A variability measure corresponding to each of these points was calculated simply by averaging the deviations of the eight judgments from their own mean. In Figure 3 the variability scores are plotted against interval size, with frequency level as the parameter. The heavy curve in each subject's graph is an average for the five lowest octaves, over which variability did not appear to change systematically;2 separate functions are displayed for the two highest octaves. The two musical subjects, JF and DM, showed remarkably similar patterns. Their functions for the lower octaves are approximately flat; that is, variability did not increase with interval size. Over this region, variable error of frequency settings is of the order of 2% or less, but in the two highest octaves it becomes tremendously greater. Note that both subjects showed an abrupt increase in variability, by about a factor of five, at exactly the same place in the sixth octave-at the transition from interval 6 to interval 7. This is the step in which the high tone of the pair increased from 4,978 to 5,274 Hz. (Interval size was increased by alternately raising the high tone and lowering the low tone; at this particular transition the low tone remained unchanged at 3,520 Hz.) Thus we have further evidence for a discontinuity of process at just about 5,000 Hz. We have observed already that JF and DM showed no increase in variability with interval size over the lower five octaves: for these functions the correlations are at a pure chance level, .18 and -.05 respectively. In the top octave, however, the correlation increases to .34 for JF, which is suggestive though not significant, and to .74 (p < .01) for DM. The situation is quite different for the nonmusical subjects, all four of whom showed definite increases in variability with interval size in the lower octaves, the correlations being .68 (p < .02) for RB, .76 (p < .01) for SD, .88 (p < .001) for KN, and .94 (p < .001) for LC. In none of these subjects do we observe the dramatic increase in variability at high frequencies that characterized the musical subjects, though SD does appear somewhat more variable in the top octave, and the quasi-musical RB further shows some weak suggestion of discontinuity in the 5,000-Hz region. Note that at high frequencies nonmusical subjects are actually less variable
This content downloaded from 128.138.223.67 on Mon, 4 Aug 2014 15:35:10 PM All use subject to JSTOR Terms and Conditions
157
PITCH AS A MEDIUM
40
4.03.8
.3-.
3.6
-----3.6
3.4
-
.8
8MEAN
OF
323 3.22.8 26
2-1
TO
3.4-i
6-1
".2
3202.8 26 DM A 24
JF \
24
2.2
22
i
2.0
I
2.0
. .
.8
1. 1.8
I
1.8 1.4
,
;
,.
.2
I'
,-
.2
_J
.4A
Al 1.8
1.8 1
2
4
3
5
6
7
8
9
.14
1.20
10 I
12 tl
1
2
3
4
5
6
7
8
9
10 it
12
8
9
10 11 12
A
2.0 .2
22-
S RB .0
KN
1
!
LO L
i
i.,
/ ,
234
6
7
8
9
1
11 12
4
123
6
20 2.0
1.6S A 1
1,
,1.4,1. 1
2
3
4
LC KN
'
SD
1.6
1.8
IV.
LI 5
6
78
910
11
12
T•1.
12
3468910112
STIMULUS1 INTERVAL STMLSINERVA
Fig. 3. Variability as a function of stimulus interval for individual subjects, Experiment I. The measure of variability is a mean deviation; the unit is a chromatic step, which represents a constant proportional change (about 6%) in frequency. Interval magnitude is likewise shown in chromatic steps on the abscissa. The five lowest frequency levels are averaged (heavy line); the two higher octaves are plotted separately.
than musical subjects, who were perhaps trying vainly to apply musical standards to nonmusical tones. These data strongly support the view that intervals may be represented or encoded in either an analog or a digital manner. The
This content downloaded from 128.138.223.67 on Mon, 4 Aug 2014 15:35:10 PM All use subject to JSTOR Terms and Conditions
158
ATTNEAVEAND OLSON
differential effect of interval size on variability suggests that the nonmusical subjects were representing intervals as quantities or magnitudes or distances (on what scale is an open question), whereas the musical subjects were representing them in qualitative or categorical terms up to about 5,000 Hz, but quantitatively at higher frequencies. Musical categories thus may be conceived as rigidly interconnected with one another in something like a solfeggio reference structure, the whole of which is freely transposable (below 5,000 Hz) in a log frequency medium. EXPERIMENT II
At the completion of Experiment I it was evident that those results from nonmusical subjects could not be attributed to properties of any homogeneous, underlying transposition medium, for reasons of inconsistency within, as well as between, subjects under this interpretation. We found ourselves unwilling to abandon the supposition that a well-defined pattern medium could be demonstrated in nonmusical persons, but unclear as to why our method had failed to discover it. A strong suspicion was that those subjects had based their transpositions on highly unstable representations of the patterns; reasons for such instability might be found in the poverty of the two-note patterns, in the brevity of experience with the standard on any particular trial, and in between-trial interference effects. (As indicated in the discussion of variability data, it is likely that musical subjects achieved stable representations by digital coding-by assigning tones to pigeonholes with determinate separations in the log frequency medium.) Accordingly, we sought an alternative transposition task that might avoid these possible sources of trouble in as uncomplicated a way as possible. A paradigm that recommended itself was one requiring the transposition, from long-term memory, of a simple melodic sequence, already highly overlearned, in which the component notes had always had the same frequency values during learning. Such a sequence is not easy to think of, since a familiar tune may have been heard in many keys, but it occurred to us after some consideration that the NBC chimes might meet our requirements quite well. Upon checking with the National Broadcasting Company, we were assured that the chimes had never varied in key; they are always composed of the notes G, E, and C, ending on middle C. We proceeded then with an experiment in which the subjects were asked
This content downloaded from 128.138.223.67 on Mon, 4 Aug 2014 15:35:10 PM All use subject to JSTOR Terms and Conditions
PITCH AS A MEDIUM
159
to reconstructthe pattern of the chimes out of pure tones at various places on the frequencyspectrum. Method --Subjects--Four paid volunteers, one male and three female students at the University of Oregon, were employed as subjects. All four were nonmusical in the sense defined earlier. They all stated that they had heard the NBC chimes many times, and they were able, either initially or after preliminary practice, to produce the pattern accurately at its normal frequency level. -Apparatus--Both of the RCA audio generators used earlier were now controlled by the subject, for frequency and also for loudness. The Grayson Stadler Twin oscillator, still in the experimenter's room, provided on each trial some anchor tone at a 40-db sensation level. The subject could listen, through the Koss Pro-4 headphones, to any of these three oscillators by pressing one of three button-switches mounted on a panel in front of him, between his two oscillators. The vernier stroboscope was used for all frequency readings, as before. -Procedure-The general procedure,employed on every trial, was to give the subject an anchor tone, which was designated as either the first, second, or third tone of the sequence, whereupon his task was to adjust the other two tones to make the pattern sound like the NBC chimes. Initially the subject was interviewed about his musical background (or lack thereof) and acquainted with the apparatus, particularly the oscillator controls. He was then asked to construct the chimes pattern, given the first tone at its normal frequency. Errors of two or more chromatic steps were not uncommon on this first attempt. The pattern was then set correctly by the experimenter; the subject was allowed to listen to it and immediately thereafter attempted to reconstruct it given an anchor tone. This alternation of demonstration and production was continued for 10 practice trials, by the end of which three subjects were consistently accurate within a chromatic step. The fourth subject, whose errors were greater, was given 10 more practice trials, in the course of which he attained a similar accuracy level. (Two prospective subjects never achieved this level of accuracy during the practice session and were dropped.) It should be clearly understood that the practice session involved only the standard, or untransposed, pattern, at the frequencies G = 2-8 = 196 Hz, E = 3-5 = 329.6 Hz, and C = 3-1 = 261.6 Hz. At no time during the experiment was the subject given any transposed exemplar of the pattern. However, his memory was refreshed at the beginning of each regular session by a single presentation and reconstruction of the standard pattern, as in the practice session; occasionally he made an error greater than a chromatic step and received a second practice trial. In the experiment proper, the subject was required to construct the pattern at 14 different frequency levels: the standard, 3 levels below it, and 10 above it. Adjacent levels were half an octave apart. Thus half the transpositions were within the key of C (that is, an integral number of octaves from the standard) and therefore involved the possibility of 'octave generalization,'
This content downloaded from 128.138.223.67 on Mon, 4 Aug 2014 15:35:10 PM All use subject to JSTOR Terms and Conditions
160
ATTNEAVE AND OLSON
whereas alternate transpositions were to the key of F-sharp/G-flat, which of all keys is the one most remote from C by musical standards. Except at the lowest frequency level, each of the three tones was used twice as the anchor, yielding a total of six trials at each level. Because of apparatus limitations, only the second and third tones could be used as anchors at the lowest frequency level. Each session lasted about an hour and consisted of one trial at each frequency level. Order of presentation was random. The anchor tone was randomly selected for each trial without replacement, so that after three sessions every anchor tone had been used at every frequency level, with the exception noted. This procedurewas replicated in the second three sessions. The subject was, of course, told at the beginning of each trial which of the three tones the anchor represented.He was instructed to sound only one tone at a time (more specifically, to use a single finger in pressing buttons), and to play the tones always in their proper sequence. He was further instructed to keep the variable tones equal in loudness to the anchor as he adjusted their frequencies.
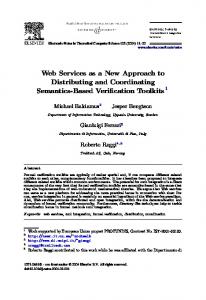
Results The NBC chimes pattern, as normally sounded, consists of an ascending interval of nine chromatic steps followed by a descending interval of four steps. We now consider the sizes of these intervals as reproduced by the subjects at various frequency levels; also, the variability of the reproduced intervals as a function of frequency. From the six trials of a subject at each frequency level, a median and an average deviation about the median were calculated for each of the two intervals. (Position of anchor tone made no consistent difference and was ignored. Medians were used to minimize the weight of occasional 'wild' responses, but averaging log frequency settings, as in Experiment I, would have yielded practically identical results.) The means of these values, over the four subjects, are graphed in Figure 4. This average function represents the performance of individuals quite well: one subject was considerably more variable than the other three, but there were no important qualitative differences of the sort encountered in Experiment I. The functions shown in Figure 4 are, for all practical purposes, horizontal straight lines. Quite simply: the chimes pattern was transposed on a musical scale, or in a log frequency medium. Intervals were consistently set a little too large; this constant-error tendency was reliable enough, but trivial in magnitude. Nothing remotely suggestive of a mel scale appears in the data. Again, the variability results are informative. Variable error (in log frequency units) is fairly uniform over the lower frequen-
This content downloaded from 128.138.223.67 on Mon, 4 Aug 2014 15:35:10 PM All use subject to JSTOR Terms and Conditions
161
PITCH AS A MEDIUM
II
grr n:
z w
a
1- 7 w
n6
5
2
69 116 92
196 330 262
221? 3136 3739 5274 2960 4186
6272 10548 8372
(STANDARD)
1-7 2-
2-7 3-1 3-7 4-I 4-7 5-1 5-7 6-1 6-7 3-6 7-1
FREQUENCY LEVEL
OF
8-1
RESPONSE
Fig. 4. The two intervals of the NBC chimes as reproduced at various frequency levels in Experiment II. Vertical lines extending 1tl mean deviation show variability. (Means were taken, over subjects, of within-subject medians and associated mean deviations.) Response intervals are measured in chromatic steps; the standard intervals were at 4 and 9 steps respectively. Adjacent frequency levels (abscissa) are separated by half an octave. Frequencies corresponding to perfect musical transposition of the pattern are specified at selected levels.
cies, up through level 6-7; see Figure 4. At level 7-1, where only the highest tone of the pattern exceeds 5,000 Hz, variability increases to more than double the average at lower frequencies. At the two highest levels-7-7 and 8-1, which lie entirely above 5,000 Hz but for one tone in the former-variability is almost four times the lower norm. Thus, in terms of both scale and variability, we find the subjects of Experiment II-all of whom were 'nonmusical'-behaving essentially as did the 'musical' subjects in Experiment I.3 A possible exception to this generalization is that variability in Experiment II was about 50% greater on the large interval than on the small one, whereas in Experiment I variability was dependent on interval size for nonmusical subjects but not for musical subjects. However, there is no certainty that this variability difference in Experiment II is attributable to interval size per se rather than to some other feature of the pattern-than to the fact that the second and smaller interval ends on the keynote or tonic, for example. It is quite clear that 'octave generalization' was not an important factor in Experiment II. If it had been, we would presumably find an alternating pattern of variable error, low at the n-1 frequency levels and high at the n-7 levels. There is, in the function for the larger interval in Figure 4, some suggestion that constant
This content downloaded from 128.138.223.67 on Mon, 4 Aug 2014 15:35:10 PM All use subject to JSTOR Terms and Conditions
162
ATTNEAVEAND OLSON
error (tendency to set the interval too large, by musical standards) alternates in this manner, but the effect, even if real, is exceedingly small. DISCUSSION
On the task of Experiment I, musical subjects transposed on a musical scale (except at high frequencies), whereas the behavior of nonmusical subjects was too idiosyncratic to permit any generalization about the scale they were using. Why the latter were so idiosyncratic remains a matter of conjecture. We have already questioned whether they were actually transposing patterns in the sense that our method presupposes. A further possibility is that their shortterm memory traces (whatever the psychophysical process on which these traces were based) were highly unstable and hence vulnerable to a variety of disturbing influences. In any case, the results of Experiment II show that musically untutored persons cannot be supposed simply to lack the musical scale. Quite the contrary: they clearly transpose in a log frequency medium when given a welldefined, highly overlearned pattern as standard. Whatever the mel may be, it is not a unit of melody; pitch as a medium has been much better described by the musician than by the psychophysicist. This is not to, say that the mel scale has no psychological reality; musically competent observers, like Stumpf, have long recognized that musical intervals are larger (on some necessarily nonmusical scale) at high frequencies than at low frequencies. There have been numerous attempts to reconcile musical pitch (or 'tonality') with pitch in the mel-scale sense, often employing the spatial model of a tonal spiral. Boring's review of these efforts ends with this remarkable conclusion: "Nowadays, with diminution of the phenomenological interest in tone, with the failure to get differential limens of tonality, and with the knowledge that the aural harmonics insistently apply the musical relations to tones, the need for this attribute has largely evaporated. The octave is, so it is thought, the tonal distance for which the harmonics-and there are always aural harmonics-interpenetrate maximally" (1942, p. 380). Our basic disagreement with Boring is perhaps clear without further belaboring, but the matter of harmonics does deserve discussion at this point. If one wishes to maintain that the musical scale is initially established in either the individual or the culture by
This content downloaded from 128.138.223.67 on Mon, 4 Aug 2014 15:35:10 PM All use subject to JSTOR Terms and Conditions
PITCH AS A MEDIUM
163
relationshipsbetween harmonics,his position, though debatable,is a tenable one. However,if the argumentis that some characteristic interpenetrationof harmonics constitutes the necessary basis for identifying a particular musical interval, or is somehow essential to the encodingof tones in musical terms, the following considerations strongly disconfirmit. First, we find musical transpositionof patterns that are entirely sequential,with no temporal overlap of tones. Second,tones were kept at a 40-db sensationlevel in both of the experimentsreported-with close precisionin ExperimentI, approximatelyin ExperimentII. At this level aural harmonicsare not phenomenallyevident, althoughthey may be detected at the lower frequencies (where higher amplitudesare requiredfor equal loudness) by the presenceof beats with a probe tone. Accordingto the curves that Fletcher (1929) obtained by the probe method, tones at the 40-db sensation level with frequenciesgreater than 500 Hz are entirely free of aural harmonics.And in our results the musical scale obtainedfor morethan three octaves above 500 Hz. Third, the two musical subjects of Experiment I still made consistently musical transpositionswhen spot-checkedat the uncomfortablylow sensationlevel of 20 db. Accordingto Fletcher'sdata, tones at this level are free of aural harmonicsdown to somewhatless than 120 Hz. Perhaps the most provocative finding of these studies is the abruptdeteriorationof musicaltranspositionthat occurredat about 5,000 Hz, both in the musical subjects of ExperimentI and in the nonmusical subjects of ExperimentII. Something changes rather dramaticallyat this level; phenomenallyit is identifiableas a loss of musical quality, whateverthat may be. The two musical subjects in ExperimentI showed a break at the very same chromaticstep. This is betweenthree and four half tones above the high end of the piano; in other words,it would appearthat just three keys could be addedto the upperend of the piano keyboardwithout exceedingthe musical range. The piccolo's highest note is about the same as the piano's, and no conventional instrumentsgo higher; pipe organs have been constructedwith notes as high as 12,000Hz, but it is not clear that this extension of range is more than a curiosity, or an organ builder'stour de force. The empiricistmay argue that tones above 5,000 Hz are unmusicalbecausethey do not occur as fundamentals in music, and the nativist may counter that they do not occurin music becausethey are unmusical;nothingin our data disproves eitherposition.
This content downloaded from 128.138.223.67 on Mon, 4 Aug 2014 15:35:10 PM All use subject to JSTOR Terms and Conditions
164
ATTNEAVE ANDOLSON
A very interesting possibility, however, is that the mel scale is dependent on a place mechanism (as indeed a mapping of mel intervals on the basilar membrane strongly suggests) but that the musical scale is based on a frequency-volley mechanism with associated neural filters. It seems evident already that the place principle cannot account for very low frequencies, or the volley principle for very high ones, but the region and extent of overlap between the two mechanisms is ambiguous. The following of sound frequencies by squads of auditory fibers has been observed up to about 4,000 Hz (Wever, 1949), and it is not implausible to suppose a real upper limit near 5,000 Hz where we find so abrupt a break in transposition performance. The argument for this hypothesis would perhaps be more convincing if subjects definitely went over from a musical scale to a mel scale at 5,000 Hz (though it is not entirely clear what this would entail); what we actually find, particularly in Experiment II, is that the musical scale still obtains at higher frequencies on the average, albeit with much greater variability. The failure of 'octave generalization' to manifest itself in Experiment II-that is, the fact that subjects transposed about as well from C to F-sharp as from C to C in different octaves-tells us something about the terms in which the pattern was stored. Bear in mind that in this experiment the transposition was from a standard held in long-term memory: if the normal chimes pattern had been presented before each trial, octave relationships might well have assumed greater importance. (Experiment I did employ shortterm memory but provided no direct opportunity for octave generalization.) The circulating short-term memory of a tonal sequence just heard, which is experienced as an auditory image extended in real time (as a melody that 'runs through one's head'), typically preserves the key or specific pitch values of the original. On the other hand, a subjectively similar image generated from long-term memory is no less determinate in key,4 but its key may or may not be that of the original. (If the reader can form a clear image of the NBC chimes, he can then go to the piano and find the three particular notes that match his image, in pitch as well as in pattern, to the nearest half tone. It is quite unlikely, however, that the key of his image-identified by the final note-will be that of C, in which he has always heard the chimes.) The long-term memory trace is encoded in terms based upon relations, or intervals, or distances on a log frequency scale. There is nothing about such a coding system that would preclude the additional or auxiliary
This content downloaded from 128.138.223.67 on Mon, 4 Aug 2014 15:35:10 PM All use subject to JSTOR Terms and Conditions
PITCH AS A MEDIUM
165
storage of information about specific pitches, or key," but it is evident that normal individuals do not, in fact, preserve this kind of information with any high degree of precision. If they did, 'absolute pitch' would be commonplace. As suggested at the beginning, pitch is only one of a number of psychophysical continua that may legitimately be studied as media. In other, fairly obvious ways, pitch is unique, and the present results, though enlightening in the case of pitch, do not tell us what to expect more generally. It will be interesting to try to quantify the morphophoric properties of other continua such as loudness, but avoiding pitfalls of the kind that we encountered with nonmusical subjects in Experiment I may require considerable care and ingenuity. Notes The research was supported in part by the Air Force Office of Scientific Research (Grant 973-66) and in part by the Advanced Research Projects Agency of the Department of Defense (Contract F44620-67C-0099).Dr. Olson is now at the University of Colorado. Received for publication August 6, 1970. 1. Strictly speaking, the midpoints of odd-numbered intervals were half a chromatic step (one twenty-fourth of an octave) higher than those of evennumbered intervals. 2. Note, however, that that variability is measured in chromatic steps, or log frequency units. In terms of frequency, what is averaged over the lower octaves is, in effect, proportional variability, with interval size held constant. 3. One of the more bizarre patterns obtained in Experiment I was that of the nonmusical subject LC (Figures 1, 2, 3). After the apparatus was rearranged for Experiment II, LC was brought back to the laboratory, and made a number of transpositions of the NBC chimes. Although the conditions under which she was run were different in detail from those later settled upon for Experiment II, her behavior on the new task was, in all essential respects, identical with that of the regularsubjects in Experiment II. 4. Why the image has to be in any key, when the memory trace presumably is not, is an interesting question (see Attneave, 1967). 5. Whether persons with 'absolute pitch' actually have stable, long-term representations for specific pitches or whether they represent key (tonality) in some different manner is quite obscure. Apparently there are individuals who can correctly identify a tone as a C, an F, or whatever, but nevertheless make octave errors (see Bachem, 1937). References Attneave, F. 1967. Criteria for a tenable theory of form perception. In Models for the perception of speech and visual form, ed. W. WathenDunn, pp. 56-67. Cambridge, Mass.: The M.I.T. Press.
This content downloaded from 128.138.223.67 on Mon, 4 Aug 2014 15:35:10 PM All use subject to JSTOR Terms and Conditions
166
ANDOLSON ATTNEAVE
Bachem, A. 1937. Various types of absolute pitch. Journal of the Acoustical Society of America 9:146-151. Boring, E. G. 1942. Sensation and perception in the history of experimental psychology. New York: Appleton-Century. Fletcher, H. 1929. Speech and hearing. New York: Van Nostrand. Stevens, S. S., and Volkmann, J. 1940. The relation of pitch to frequency. American Journal of Psychology 53:329-353. Stevens, S. S., Volkmann, J., and Newman, E. G. 1937. A scale for the measurement of the psychological magnitude pitch. Journal of the Acoustical Society of America 8:185-190. Wever, E. G. 1949. Theory of hearing. New York: Wiley.
This content downloaded from 128.138.223.67 on Mon, 4 Aug 2014 15:35:10 PM All use subject to JSTOR Terms and Conditions