Place prioritization for biodiversity content SAHOTRA SARKAR†, ANSHU AGGARWAL, JUSTIN GARSON, CHRIS R MARGULES* and JULIANE ZEIDLER** Biodiversity and Biocultural Restoration Laboratory, Program in the History and Philosophy of Science, Waggener 316, University of Texas at Austin, Austin, TX 78712-1180, USA *CSIRO Wildlife and Ecology, Tropical Forest Research Centre, PO Box 780, Atherton, Queensland 4883, Australia **Desert Research Foundation of Namibia, PO Box 20232, Windhoek, Namibia †
Corresponding author (Fax, 512-471-4806; Email,
[email protected])
The prioritization of places on the basis of biodiversity content is part of any systematic biodiversity conservation planning process. The place prioritization procedure implemented in the ResNet software package is described. This procedure is primarily based on the principles of rarity and complementarity. Application of the procedure is demonstrated with two analyses, one data set consisting of the distributions of termite genera in Namibia, and the other consisting of the distributions of bird species in the Islas Malvinas/Falkland Islands. The attributes that data sets should have for the effective and reliable application of such procedures are discussed. The procedure used here is compared to some others that are also currently in use. [Sarkar S, Aggarwal A, Garson J, Margules C R and Zeidler J 2002 Place prioritization for biodiversity content; J. Biosci. (Suppl. 2) 27 339–346]
1.
Introduction
One of the central theoretical tasks of conservation biology is to prioritize places on the basis of their biodiversity value and to devise management strategies to conserve biodiversity in these places. Traditionally, an implicit place prioritization was routinely performed when places were selected as managed forests, game reserves, national parks, etc. However, this process has almost always involved either the use of intuitive judgments of biodiversity value, concern for charismatic or useful species, or even the use of criteria completely extraneous to biodiversity conservation such as scenic value, wilderness quality or, sometimes, mere availability (Pressey et al 1996; Sarkar 1999). From the viewpoint of biodiversity conservation, the last practice in particular leads to ad hoc reservation (Pressey 1994). Management practices designed to separate biodiversity from processes that threaten it have also often been based on expert intuition rather than well-tested models.
Keywords.
However, over the last decade an explicit framework for systematic conservation planning has emerged (Margules and Pressey 2000). This paper will elaborate one part of that framework. Assume that (i) the biogeographical and other data on which conservation decisions must be made have already been collected for some region, and (ii) explicit conservation goals have been set. We now envision a four-stage process for biodiversity planning and management in that region. (i) Using the data set, and keeping the conservation goals in mind, surrogates must be selected which will represent the target of conservation (species, vegetation types, ecosystem types, or other features). This is the “surrogacy problem”. The most common surrogates used are the distributions of some species (usually vertebrates) and environmental parameters (e.g. Nix et al 2000) (average rainfall, average temperature, soil type, aspect, etc.) because these are often the only data available (Margules et al 1995). If total species diversity is the conservation goal, whether these surrogates are empirically adequate
Area selection; Falkland Islands; Islas Malvinas; Namibia; place prioritization; reserve network design J. Biosci. | Vol. 27 | No. 4 | Suppl. 2 | July 2002 | 339–346 | © Indian Academy of Sciences
339
340
Sahotra Sarkar et al
as representatives of that diversity (in the sense of being good predictors) remains an open and relatively unexplored research question. (ii) Using lists of these surrogates, these places are ordered according to their biodiversity content [as opposed to value; see (iii) below]. This is the “place prioritization problem”. This prioritized list provides a basis for the next two stages, which are highly resourceintensive and usually cannot be carried out for all places in a region. (iii) For each place, the projected futures of the entities of interest (populations, species assemblages, etc.) must be estimated. This is the “viability problem”. It is extremely difficult to solve in practice. Ideally, viabilities must be estimated for all of the actual targets of conservation, not just for the surrogates. Knowledge of these viabilities will induce a change in the ranking of places in the prioritized list, for instance, by decreasing the importance of places where viabilities are low, and the entities of interest are also found elsewhere. The re-ordered list now reflects the biodiversity value of different places. A variety of methods are available for estimating viabilities, for instance, stochastic population viability analysis (PVA) for small populations (Boyce 1992; Burgman et al 1993) and conventional ecological experimentation for larger ones (Caughley and Gunn 1996). Another approach to estimating viability is to predict threats to entire places, for example from conversion to agriculture or forestry (see, e.g. Pressey et al 1996; Cowling et al 1999). (iv) Finally, the problem of devising appropriate management practices for each place can begin, presumably starting with those places with highest biodiversity value. This is the “feasibility problem”. Socio-economic and political factors are typically extremely important at this stage. While these stages have been listed sequentially, there is feedback from stage (iv) to stage (iii) since management practices can alter viabilities. Furthermore, over time, features such as species may disappear from places, management practices may fail or succeed beyond expectations, and biological systems will evolve in response to environmental and other changes. The goal of “adaptive management” is to take these temporal factors into account and accordingly change management practices and overall conservation policy for a region. In this paper we are concerned only with stage 2 of this process. In section 2 we describe a place prioritization procedure which, in its original form, was developed in the late 1980s. It emphasizes the selection of places containing rare surrogates (the principle of “rarity”) and places which add as many under-represented surrogates as possible to a set of selected places (the principle of “complementarity”). This procedure has recently been J. Biosci. | Vol. 27 | No. 4 | Suppl. 2 | July 2002
implemented in the ResNet software package developed at the University of Texas at Austin and available for free distribution. In section 3 we give two illustrations of the use of this procedure using data sets from Namibia and the Islas Malvinas/Falkland Islands. In section 4 we discuss our results. However, our emphasis is not on any substantive conclusion about conservation policy to be drawn from these results. Rather, the points we are trying to emphasize here are methodological ones, about the types of place prioritization procedures that are effective in practice, and about the attributes data sets should have
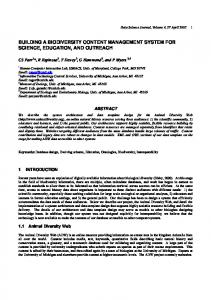
Figure 1. ResNet: The basic algorithm. The flowchart describes the basic algorithm incorporated in ResNet. Here, initialization is by rarity. No adjacency or redundancy considerations are introduced.
Place prioritization for biodiversity content for the effective and reliable use of these procedures. We hope that such data sets will soon be constructed for various Indian regions so that systematic conservation planning in India can be taken to the next level of sophistication.
2.
Prioritization procedures
We will discuss the place prioritization procedure that is incorporated in the ResNet software package which was produced at the University of Texas at Austin (Aggarwal et al 2000). Similar procedures have also been implemented elsewhere (e.g. Margules et al 1988; Vane-Wright et al 1991; Rebelo and Siegfried 1992; Pressey et al 1993). However, ResNet is unique in using dynamic memory allocation; thus there is no constraint on the size of the data set. Recent regional planning applications can be found in Faith et al (2001) and Pressey (1998). The algorithms used in ResNet are variations and extensions of one originally proposed by Margules et al (1988) (see also Nicholls and Margules 1993). If a region is divided into a set of places (on the basis of geographical coordinates, ecological boundaries, etc.) these algorithms order those places by their biodiversity content. The algorithms usually assume that a definite target has been set in the form of (i) adequate representation of each surrogate, that is, the number of selected places in which that surrogate must be present; (ii) maximum allowed area; or (iii) maximum allowed cost of a proposed set of conserved places. The goal of the algorithms is to achieve the set target efficiently by selecting as few places as possible, that together reach the conservation goal (Pressey and Nicholls 1989).
Table 1.
341
Three principles are incorporated into these algorithms: (i) Rarity: First surrogates are ordered inversely by the frequency of their appearance in the data set. Then places are ordered according to whether they contain the rarest surrogate, the next rarest surrogate, and so on, iteratively. (ii) Complementarity: Places are ordered on the basis of the number of surrogates they contain which have not met the targeted representation (if set). (iii) Richness: Places are ordered on the basis of the number of surrogates present. Richness can be used in only one part of the algorithms (the initialization part). This reflects the fact that the use of richness results in inefficient place selection (Williams et al 1996; Csuti et al 1997). The prioritization consists of two stages with an optional third stage. At stage 1 there are three choices; at stage 2 there are two choices; at the optional stage 3, two further choices. There are thus 18 different algorithms implemented in the ResNet program. Stage 1 is the initialization stage. First, places that cannot be reasonably targeted for conservation measures (for instance, because of a high population density), which are therefore “masked”, are removed from the set of potentially selected places. There are now three ways to initialize the prioritization procedure: (i) select the first place by rarity; (ii) select it by richness; or (iii) introduce a set of pre-selected places. In the case of the first two options, ties are broken arbitrarily by selecting the first place on the list (this is called “lexical order”). Thus a unique place is chosen. The third option is the relevant one when we begin with a set of reserves and attempt to build on it systematically.
Termite genera of Namibia.
Allodontermes Amitermes Ancistrotermes Angulitermes Anoplotermes Baucaliotermes Bifiditermes Coptotermes Cryptotermes Cubitermes Epicalotermes Fulleritermes Hodotermes Lepidotermes Macrotermes Microcerotermes Microhodotermes
Microtermes Neotermes Noditermes Odontotermes Okavangotermes Ovambotermes Promirotermes Psammotermes Rhadinotermes Schedorhinotermes Skatitermes Spatulitermes Termes Trinervitermes Unguitermes Unicornitermes
Figure 2. Namibia: Termite records. All cells with records of termite presence are indicated. These records compound the presence-absence and presence only data. J. Biosci. | Vol. 27 | No. 4 | Suppl. 2 | July 2002
342
Sahotra Sarkar et al
There may be more than one place initially selected through this option. Stage 2 is the iterative stage. We can now choose to introduce an adjacency constraint, that is, to prefer a place if one of its neighbours has already been selected. If this option is adopted, larger areas, or groups of areas closer together are likely to result than if it is not. Given a set of selected places, or an imposed set such as existing reserves, the problem is to find the best new one to add. The method does this by first trying to select the new place by using rarity. All places with the rarest under-represented surrogates are identified. If there is only one, it is added to the list. If there is more than one, complementarity is used to try to break ties. If there is still a tie, and if adjacency has been chosen, then adjacency is used to break ties. Final ties are broken by lexical order. This iteration continues until the target is met, that is, all surrogates are adequately represented, or the maximum allowed area or cost is exceeded. If no explicit target has been set, the procedure continues until all places are selected. The order in which these places are selected produces a ranking of the set of places on the basis of their biodiversity content. Biodiversity content is thus implicitly defined by the algorithm, and the intuition behind this approach is that diversity is adequately captured by rarity and complementarity. Figure 1 shows
the flowchart of a typical algorithm. Initialization is by rarity and the adjacency option has not been chosen. Suppose that an explicit target of surrogate representation has been set, and that a set of places has been selected. This procedure does not guarantee that some of the selected places may not have been made redundant by places selected after them, that is, they may be eliminated without causing the target of representation for any surrogate to fail. The optional stage 3 checks for redundancy. There is another choice here: we can eliminate all redundant places or we can choose not to eliminate those redundant places that are adjacent to other non-redundant selected places which, once again, tries to make potentially conserved areas as large as can be justified. First, the algorithms iterate over the list of selected places to find each one that is redundant. Note that while each one is redundant, the entire set of such places need not simultaneously be redundant. Consequently, places can be eliminated only one at a time. If there is a unique redundant place, and if adjacency has not been imposed, it is eliminated. If there is no such unique place, the redundant places are ordered by rarity with ties being broken by lexical order. Then, once again after checking for adjacency if required, the first place on the redundant list is eliminated. The entire process is iterated over all the potentially redundant places.
5% of total area 10% of totral area
Figure 3. Namibia: Place selection by representation. The red circles show the places selected if 10 representations of each termite genus is required. The blue circles show the additional places selected if 25 representations are required. The green circles show the further additional places selected if 50 representations are required; of these one turns out to be redundant as indicated by the cross. There is no redundancy when only 10 or 25 representations are required. J. Biosci. | Vol. 27 | No. 4 | Suppl. 2 | July 2002
Figure 4. Namibia: Place selection by area. The red circles show the places selected if 5% of the area of Namibia (approx. 44691 sq. km) is to be conserved; the green circles show the additional places selected if 10% of the area (89383 sq. km) is to be conserved.
Place prioritization for biodiversity content 3.
Two examples
The first data set we analyse consists of the distribution of 33 termite genera in Namibia (see table 1) (Zeidler 1997). The data are in the form of geographical “presence only” records and are derived from the National Survey of the Isoptera which was conducted in Namibia between 1964 and 1968 (Coaton and Sheasby 1972). Termite taxa presence was recorded along the public roads throughout Namibia at 16 km intervals and the geographic coordinates for each sample were recorded. This sampling bias will partly vitiate any conclusions that are drawn from our analysis but, unfortunately, this is typical of data that are available from most regions. The used data set consists of records at a 0⋅25° resolution of longitude and latitude though the original data were collected at a finer degree of resolution. Because of the resolution of the data set, we could only divide each 1° longitude × 1° latitude cell into 16 (0⋅25° longitude × 0⋅25° latitude) cells which comprise the places to be prioritized. There were 1,250 such places and, approximating Earth to a sphere, they varied in area between 676⋅7 sq. km and 738⋅5 sq. km. Figure 2 shows all the places for which there are records of termite presence. Figure 3 shows the cells selected when 10, 25 and 50 representations are chosen for each surrogate. The algorithm used did not seek adjacency. In the case of 50 representations, it also shows which cells are eliminated if redundancy is removed (with or without testing again for adjacency). Figure 4 shows the cells that are selected if we target 5% and 10% of the total area of Namibia for conservation. In all cases, initialization was by rarity. Our second data set consists of the distribution of 65 breeding bird species in the Islas Malvinas/Falkland Islands (see table 2). These species serve as surrogates in this analysis. The data were available at a 10 km × 10 km resolution. Thus, each cell (place) has an area of 100 sq. km. These are “presence–absence” data since they are the result of systematic surveys. One consequence of this is that there is no data available for some inaccessible places which comprise about 8% of the area of the cells (Woods and Woods 1997). There are 254 cells with data, as shown in figure 5.
Table 2.
Breeding birds of the Islas Malvinas/ Falkland Islands.
Common English name King penguin Gentoo penguin Rockhopper penguin Macaroni penguin
Scientific name Aptenodytes patagonicus Pygoscelis papua Eudyptes chrysocome Eudyptes chrsolophus
Common English name Magellanic penguin White-tufted grebe Silvery grebe Black-browed albatross Southern giant petrel Thin-billed prion Fairy prion White-chinned petrel Great shearwater Sooty shearwater Wilson’s storm-petrel Grey-backed storm-petrel Black-bellied storm-petrel Common diving petrel Rock shag/cormorant Imperial/king shag Black-crowned night heron Black-necked swan Domestic goose Upland goose Kelp goose Ashy-headed goose Ruddy-headed goose Flying steamer duck Falkland steamer duck Chiloe wigeon Speckled teal Crested duck Yellow-billed pintail Silver teal Cinnamon teal Red shoveler Turkey vulture Red-backed hawk Striated caracara Crested caracara Peregrine falcon Magellanic oystercatcher Blackish oystercatcher Two-banded plover Rufous-chested dotterel Magellanic snipe Falkland skua Dolphin gull Kelp gull Brown-hooded gull South American tern Barn owl Short-eared owl Tussacbird Dark-faced ground-tyrant Chilean swallow Falkland pipit Falkland grass wren Cobb’s wren Falkland thrush Rufous-collared sparrow Black-throated finch Long-tailed meadowlark Black-chinned siskin House sparrow
343 Scientific name Spheniscus magellanicus Rollandia rolland Podiceps occipitalis Diomedea melanophris Macronectes giganteus Pachyptila belcheri Pachyptila turtur Procellaria aequinoctialis Puffinus gravis Puffinus griseus Oceanites oceanicus Garrodia nereis Fregetta tropica Pelecanoides urinatrix Phalacrocorax magellanicus Phalacrocorax atriceps Nycticorax nycticorax Cygnus melanocoryphus Anser anser Chloepaga picta Chloepaga hybrida Chloepaga poliocephala Chloepaga rubidiceps Tachyerres patachonicus Tachyeres brachydactyla Anas sibilatrix Anas flavirostris Anas specularioides Anas georgica Anas versicolor Anas cyanoptera Anas platalea Cathartes aura Buteo polyosoma Phalcoboenus australis Caracara plancus Falco peregrinus Haematopus leucopodus Haematopus ater Charadrius falklandicus Charadrius modestus Gallinago magellanica Catharacta antartica Larus scoresbii Larus dominicanus Larus maculipennis Sterna hirundinacea Tyto alba Asio flammeus Cinclodes antarcticus Misciaxicola macloviana Tachycineta leucopyga Anthus correndera Cistothorus platensis Troglodytes cobbi Turdus falcklandii Zonothrichia capensis Melanodera melanodera Sturnella loyca Carduelis barbata Passer domesticus
J. Biosci. | Vol. 27 | No. 4 | Suppl. 2 | July 2002
Sahotra Sarkar et al
344
Because of the relatively high quality of this data set, we performed a more ambitious analysis than with the Namibian data set. This analysis is representative of what is relevant when we devise conservation strategies for actual implementation in the field. Of the 65 breeding bird species, 4 (ruddy-headed goose, Chloephaga rubidiceps; striated caracara, Phalcoboenus australis; Cobb’s wren, Troglodytes cobbi; and black-throated finch, Melanodera melanodera) are deemed to be at risk (Woods and Woods 1997). Suppose we want to conserve every place where species at risk have been recorded, and set a surrogate target representation of 25% for all other species, that is, for each of them, we want to conserve at least one-fourth of the places where they have been recorded. The ResNet software can be used in two ways to achieve this goal. First, we can set the number of places in which each of the species at risk recorded, as the targeted representation for the other species at onefourth the number of their records. Second, we can initialize the procedure by selecting all places with records of species at risk, and then try to achieve a 25% representation target for the other species. Both methods give the same results, which is not unexpected, given the small size of the data set. Figure 6 shows the results; 182 cells are selected.
We first want to make three points about the attributes that data sets should have to make procedures such as the one described in section 2 reliable and effective for policy-making.
We want to emphasize that the results of the last section should not be used to infer any implication about conservation policy in Namibia or the Islas Malvinas/ Falkland Islands. There is no reason to suppose that termite genera are adequate surrogates for any other taxa in Namibia. At the very best, if we are solely concerned with bird conservation, the results obtained for the Islas Malvinas/Falkland Islands indicate a direction in which further analysis should go.
(i) These procedures assume that surrogate data are in the form of geographical presence-absence records. However, when biological (rather than environmental) surrogates are used, what is often available in practice is presence-only records, that is, records of observations of the surrogates without systematic searches. The extent to which this sort of data vitiates conclusions drawn is not known. One way of avoiding this problem is to predict the wider spatial distribution patterns by modelling the probable distribution of surrogates in areas which have not been systematically surveyed (see e.g. Austin and Meyers 1996; Deadman and Gimblett 1997; Hilbert and van den Muyzenberg 2002; Hutchinson et al 1996; Margules and Nicholls 1987). However, a preferable though resource-intensive option is to carry out the systematic surveys that produce presence-absence records (see e.g. Austin and Heyligers 1989; Austin and Adomeit 1991). (ii) These procedures operate on a list of surrogates for each place as the basic data structure. This point deserves emphasis: summary statistics, such as the number of surrogates present at a place (richness), are not sufficient. This implies that, if place prioritization is part of the objectives of a conservation program, field data, which are often collected in the form of surrogate lists, should not be compounded into summary statistics. (iii) Especially in the case of the Namibian data set, the resolution of the digitized data is too poor to be useful for detailed conservation planning. Data recorded in the field are usually at a much higher degree of resolution especially since the advent of cheap GPS technology. It is important that geographical data not be treated before digitization in such a way that resolution is lost. If some
Figure 5. Islas Malvinas/Falkland Islands: Breeding bird records. All cells with records of breeding bird presence are indicated. These are all presence-absence data.
Figure 6. Islas Malvinas/Falkland Islands: Place selection by representation. The 182 selected places are shown. All cells with records of species at risk and 25% of the places with other species were selected.
4.
Discussion
J. Biosci. | Vol. 27 | No. 4 | Suppl. 2 | July 2002
Place prioritization for biodiversity content application requires coarse-grained data, treatment can easily reduce resolution after digitization while the converse is not true. Finally, turning to the place prioritization procedures themselves, we wish to make two important points. (i) Procedures such as the one described in section 2 are heuristic in the sense that they do not guarantee that the optimal solution has been found, that is, it is not possible to select some smaller set of places that also satisfy the set target. If the target is set as a number for the representation of each surrogate and adjacency considerations are not introduced, it is well-known that there exists a class of algorithms, based on linear programming, which finds the optimal solution. However, in the one case where such a solution was tested using actual data, for terrestrial vertebrates of Oregon with a target of one representation, the optimal solution was only marginally better than those found by complementarity-based algorithms initialized using rarity (Csuti et al 1997). Meanwhile, these optimal algorithms are much more difficult to implement and much less computationally efficient (Pressey et al 1996). We plan to provide a general implementation of these algorithms in future generations of ResNet though we are not convinced that they will prove to be practically useful. Moreover, it is far from clear that there are such algorithms when adjacency considerations have to be introduced, when targets are set using areas and costs, or if we have to build on an existing selected set (for instance, when we are trying to extend an existing system of protected places). (ii) ResNet can only introduce cost considerations as a global constraint. An alternative framework, implemented in the Target software package (Faith and Walker 1996a,b), tries to optimize biodiversity content and cost considerations iteratively at each step that a place is selected. This approach has the advantage of allowing more sophisticated cost considerations than ResNet. However, it has the disadvantage that the relative weights given to biodiversity and cost have to be set arbitrarily. We are also trying to develop multiple criteria decisionmaking procedures that will combine the strengths of both approaches.
Acknowledgments Work on this paper was supported by a University of Texas Research Grant to SS and Research Internship to JG. For the Falkland Islands data set we thank Robin Woods; for help in obtaining that data set we thank Jonathan Meiburg. For the Namibian data set we thank the Biosystematics Division of the Plant Protection Research Institute, Pretoria, South Africa for allowing
345
use of the original data from the National Survey of the Isoptera; this research was funded by the “Tropenökologisches Begleit Programm” (Ecology Support Program) (TÖB) of the German Agency for Technical Cooperation in support of Namibia’s National Programme to Combat Desertification.
References Aggarwal A, Garson J, Margules C R, Nicholls A O and Sarkar S 2000 ResNet Ver 1⋅1 Manual (Report. Biodiversity and Biocultural Conservation Laboratory, University of Texas) Austin M P and Adomeit E M 1991 Sampling strategies costed by simulation; in Nature conservation: cost effective biological surveys and data analysis (eds) C R Margules and M P Austin (Melbourne: CSIRO) pp 167–175 Austin M P and Heyligers P C 1989 Vegetation Survey Design for Conservation: Gradsect Sampling of Forests in NorthEastern New South Wales; Biol. Conserv. 50 13–32 Austin M P and Meyers J A 1996 Current Approaches to Modelling the Environmental Niche of Eucalypts: Implications for Management of Forest Biodiversity; For. Ecol. Manag. 85 95–106 Boyce M S 1992 Population Viability Analysis; Annu. Rev. Ecol. Syst. 23 481–506 Burgman M, Ferson S and Akçakaya H R 1993 Risk assessment in conservation biology (New York: Chapman and Hall) Caughley G and Gunn A 1996 Conservation biology in theory and practice (Boston: Blackwell Science) Coaton W G H and Sheasby J L 1972 Preliminary Report on a Survey of the Termites (Isoptera) of South West Africa; Cimbebasia Mem. 2 1–129 Cowling R M, Pressey R L, Lombard A T, Desmet P G and Ellis A G 1999 From Representation to Persistence: Requirements for a Sustainable Reserve System in the Species-Rich Mediterranean-Climate Deserts of Southern Africa; Diver. Distrib. 5 51–71 Csuti B, Polasky S, Williams P H, Pressey R L, Camm J D, Kershaw M, Kiester A R, Downs B, Hamilton R, Huso M and Sahr K 1997 A Comparison of Reserve Selection Algorithms Using Data on Terrestrial Vertebrates in Oregon; Biol. Conserv. 80 83–97 Deadman P J and Gimblett H R 1997 Applying Neural Networks to Vegetation Management Plan Development; AI Appl. 11 107–112 Faith D P, Margules C R and Walker P A 2001 A biodiversity conservation plan for Papua New Guinea based on biodiversity trade-offs analysis; Pac. Conserv. Biol. 6 304– 324 Faith D P and Walker P A 1996a Diversity – TD; in BioRap Volume 3. Tools for assessing biodiversity priority areas (eds) D P Faith and A O Nicholls (Canberra: The Australian BioRap Consortium) pp 63 –74 Faith D P and Walker P A 1996b Integrating Conservation and Development: Effective Trade-offs between Biodiversity and Cost in the Selection of Protected Areas; Biodiver. Conserv. 5 417–429 Hilbert D W and van den Muyzenberg J 2002 Using an Artificial Neural Network to Characterize the Relative Suitability of Environments for Forest Types in a Complex Tropical Vegetation Mosaic; Diversity Distrib. 5 (in press) J. Biosci. | Vol. 27 | No. 4 | Suppl. 2 | July 2002
346
Sahotra Sarkar et al
Hutchinson M F, Belbin L, Nicholls A O, Nix H A, McMahon J P and Ord K D 1996 BioRap Volume 2. Spatial Modelling Tools (Canberra: The Australian BioRap Consortium) (http:// cres.anu.edu/biorap/tools.html) Margules C R and Nicholls A O 1987 Assessing the Conservation Value of Remnant Habitat ‘Islands’: Mallee Patches on the Western Eyre Peninsula, South Australia; in Nature conservation: The role of remnants of native vegetation (eds) D A Saunders, G W Arnold, A A Burbidge and A J M Hopkins (Sydney: Surrey Beatty) pp 89– 102 Margules C R, Nicholls A O and Pressey R L 1988 Selecting Networks of Reserves to Maximize Biological Diversity; Biol. Conserv. 43 63–76 Margules C R and Pressey R L 2000 Systematic Conservation Planning; Nature (London) 405 242–253 Margules C R, Redhead T D, Faith D P and Hutchinson M F 1995 Guidelines for using the BioRap methodology and tools (Canberra: CSIRO) Nicholls A O and Margules C R 1993 An Upgraded Reserve Selection Algorithm; Biol. Conserv. 64 165–169 Nix H A, Faith D P, Hutchinson M F, Margules C R, West J, Allison A, Kesteven J L, Natera G, Slater W, Stein J L and Walker P 2000 The BioRap Toolbox: A national study of biodiversity assessment and planning for Papua New Guinea (Canberra: Centre for Resource and Environmental Studies, Australian National University) Pressey R L 1994 Ad Hoc Reservations: Forward of Backward Steps in Developing Representative Reserve Systems; Conserv. Biol. 8 662–668 Pressey R L 1998 Algorithms, politics and timber: An example of the role of science in a public, political negotiation process over new conservation areas in production forests; in Ecology for everyone: Communicating ecology to scientists, the public and politicians (eds) R T Wills, R J Hobbs and M D Fox (Sydney: Surrey Beatty) pp 73–87
J. Biosci. | Vol. 27 | No. 4 | Suppl. 2 | July 2002
Pressey R L, Ferrier S, Hager T C, Woods C A, Tully S L and Weinman K M 1996 How Well protected Are the Forests of North-Eastern New South Wales? – Analyses of Forest Environments in Relation to Tenure, Formal Protection Measures and Vulnerability to Clearing; For. Ecol. Manage. 85 311–333 Pressey R L, Humphries C J, Margules C R, Vane-Wright R I and Williams P H 1993 Beyond Opportunism: Key Principles for Systematic Reserve Selection; Trends Ecol. Evol. 8 124– 128 Pressey R L and Nicholls A O 1989 Efficiency in Conservation Evaluation: Scoring versus Iterative Approaches; Biol. Conserv. 50 199–218 Pressey R L, Possingham H P and Margules C R 1996 Optimality in Reserve Selection Algorithms: When Does It Matter and how much?; Biol. Conserv. 76 259–267 Rebelo A G and Siegfried W R 1992 Where Should Nature Reserves Be Located in the Cape Floristic Region, South Africa? Models for the Spatial Configuration of a Reserve Network Aimed at Maximising the Protection of Floral Diversity; Conserv. Biol. 6 243–252 Sarkar S 1999 Wilderness Preservation and Biodiversity Conservation – Keeping Divergent Goals Distinct; BioScience 49 405–412 Williams P, Gibbons D, Margules C, Rebelo A, Humphries C and Pressey R 1996 A Comparison of Richness Hotspots, Rarity Hotspots, and Complementary Areas for Conserving Diversity of British Birds; Conserv. Biol. 10 155–174 Woods R W and Woods A 1997 Atlas of breeding birds of the Falkland Islands (Oswestry: Anthony Nelson) Vane-Wright R I, Humphries C J and Williams P H 1991 What to Protect? – Systematics and the Agony of Choice; Biol. Conserv. 55 235–254 Zeidler J 1997 Distribution of termites (Isoptera) throughout Namibia – environmental connections, MSc thesis, University of the Witwatersrand, Johannesburg, South Africa