Published February 29. Planktonic primary production and microbial respiration measured by 14c assimilation and dissolved oxygen changes in coastal waters ...
MARINE ECOLOGY PROGRESS SERIES Mar Ecol Prog Ser
Published February 29
Planktonic primary production and microbial respiration measured by 14cassimilation and dissolved oxygen changes in coastal waters of the Antarctic Peninsula during austral summer: implications for carbon flux studies J. Aristegui*, M. F. Montero, S. Ballesteros, G . Basterretxea, K. van Lenning Facultad d e Ciencias del Mar, Universidad d e Las Palmas d e Gran Canaria, E-35017 Las Palmas d e Gran Canaria, Canary Islands, Spain
ABSTRACT Oxygen consumption a n d production a n d carbon fixation by micro-organisms were m e a sured siinultaneously in coastal surface waters near the Antarctic Peninsula Although there wds a good qualitative agreement between the oxygen and carbon measurements, total daily water-column integrated carbon incorporation measured by radiocarbon uptake in the particulate fraction underestimated net community production measured by the oxygen method by 29 to 54 % (using a photosynthetic quotient of 1 5) Unaccounted-for exudation of dissolved organic carbon d u n n g the 14C uptake experiments may explain this discrepancy Respiratory carbon losses by micro-organisms (largely phytoplankton) ranged between 10 and 50% of gross production the highest values corresponding to the more productive stations These estimates a r e , however, slightly conservative, since they refer to the upper 30 m of the water column, corresponding approxlinately to the euphotic zone in this region Our results show that microbial respi~ationis a n important part of the carbon flux of coastal Antarctic plankton Unless it is considered in carbon flux models, the contribution of higher trophic levels to the carbon fluxes in marine food webs may b e seriously overestimated
KEY WORDS. Primary production. Microbial respiration. Carbon a n d oxygen fluxes . Coastal Antarctic waters
INTRODUCTION
Coastal waters near the Antal-ctic Peninsula support highly productive ecosystems where extensive phytoplankton blooms develop throughout the austral spring and summer (Holm-Hansen & Mitchell 1991, Comiso et al. 1993, Sullivan et al. 1993). These areas may therefore represent key sites where the 'biological pump' (Volk & Hoffert 1985, Longhurst & Harrison 1989) transports organic carbon below the mixed layer, and consequently sequesters atmospheric CO2. However, Huntley et al. (1991) have suggested that airbreathing top predators might return as much as 20 to
O Inter-Research 1996 Resale of full artlcle not perrnltted
25% of the photosynthetically fixed carbon to the atmosphere, causing these ecosystems to be inefficlent as a carbon sink. Moloney (1992; see also Huntley et al. 1992) questioned Huntley et al.'s (1992) conclusions, arguing, among other things, that phytoplankton respiration was not accounted for in their food web model. Therefore, Huntley et al.'s (1992) calculations began with net production rather than total production, increasing the apparent contribution of all heterotrophs to the carbon flux. Huntley et al. (1992) may have ignored phytoplankton respiration in their model because there were at that time no reliable direct measurements from coastal Antarctic waters. Furthermore, published respiration data for the Antarctic Ocean as a whole are few and
192
Mar Ecol Prog Ser 132: 191-201, 1996
contradictory. Williams (1984),in a review paper. cites (unpublished) values of community respiration from Pomeroy and coworkers, rangi.ng from 0 to 0.5 pm01 O2 1-' d-' for the Antarctic. These figures contra.st with the higher oxygen consumption rates (0.5 to 3.69 pm01 O2 1-' d-l) obtained by Robinson & Williams (1993) from the upper 100 m of the water column, between the Falkland Islands and So'uth Georgia, near the Antarctic Convergence. The latter data agree, however, ~ v i t h oxygen consumption measurements obtained in the Arctic Ocean by Harrison (1986) and, more recently, in coastal Antarctic waters by Aristegui & Montero (1995). Phytoplankton respiratory losses in the Antarctic have also been est~matedby 14Ccell-labelling experiments. However, results obtained with this method are controversial, since phytoplankton and microheterotrophs are capable of fixing carbon in the dark (Li & Dickie 1991, Geider 1992, Li et al. 1993). This might partly explain the variability in the few published results. Tilzer & Dubinsky (1987) estimated carbon respiratory losses lower than 10 % of the gross production in the eastern region of the Bransfield Strait. In contrast, Lancelot et al. (1991) found respiration to account for 50 % of gross production in the case of the phytoplankton of the marginal ice zone of the Weddell and Scotia Seas. In the present study we have directly measured the relationship between plankton community respiration and gross oxygen production in the upper layers of selected stations of coastal Antarctic ecosystems. We have also simultaneously estimated 14C uptake by phytoplankton. Our aim was to assess the contribution of microbial communities to the respiratory flux of inorganic carbon in surface waters of near-shore Antarctic regions, where top predators have been considered to be responsible for a major leak in the biological carbon pump (Huntley et al. 1991).
MATERIAL AND METHODS Station locations. Data were collected during the cruise 'BIOANTAR 93' on board the 'B10 Hesperides', during February 1993. In situ incubations were carried out at 4 stations, which represented different hydrological and biolog~calconditions of Antarctic coastal waters. These stations were (Table 1): S1, in shelf waters of the Antarctic Peninsula, in the Bransfield Strait; S2, in the Gerlache Strait; S3, in Hanusse Bay, near the polar circle, at the marginal ice zone; and S4, in the interior bay of Deception Island, Bransfield Strait. Conditions at these stations varied from waters with moderate chlorophyll [-l mg chlorophyll a (chl a) m-3] and a deep ( > l 0 0 m) mixed layer ( S l ) , to the
Table 1. Station locations, depths and sampling dates in Fehruary 1994
Stallon S1 S2 S3 S4
Latitude (S) Long~tude(W] Depth (m) Date 63" 48'55" 64" 13' 10" 66'44' 22" 62' 57' 10"
61" 12' 10" 61" 19' 18" 67" 34' 10" 60" 37' 53"
656 540 611 156
5 Feb 10Feb 12 Feb 14 Feb
highly stratified waters of S4, where phytoplankton was blooming (>7 mg chl a m-3). Hydrographic and optical measurements. At each station, temperature, salinity and density were recorded through the water column with a Neil Brown Mark 111 CTD system. Temperature and conductivity from the CTD sensors were calibrated against readings of reversing thermometers and salinity analyses (Autosal 2000) of discrete samples. Water samples between the surface and 60 m were collected in 12 1 Niskin bottles attached to a rosette frame. Photosynthetically active radiation (PAR) was measured through the water column with a 4n light sensor (Biospherical Co., San Diego, CA, USA). The depth of the euphotic zone (ZEZ)was taken as extending to the depth at which scalar PAR fell to 1% of surfa.ce values. Nutrients and chlorophyll. Samples of nitrate (nitrate + nitrite) and ammonia were immediately analyzed on board after being collected. All the analyses were done in triplicate, using conventional chemical techniques (Parsons et al. 1984). Chl a was estimated fluorometrically by means of a Turner Designs fluorometer, previously calibrated with pure chl a (Sigma Co., St. Louis, MO, USA), following the recommendations of Yentsch & Menzel (1963) and Holm-Hansen et al. (1965). Sample aliquots of 50 to 250 m1 were filtered through GF/F filters and also through 2 pm polycarbonate membrane filters. Pigments were extracted in cold acetone (90%) for 24 h, and fluorescence was measured before and after acidification, allowing the separate estimation of chl a-like pigments and phaeopigments. Microbial abundance. Phytoplankton samples were preserved in Lugol's solution (Parsons et al. 1984) and stored in the dark. Subsamples were settled in 50 m1 chambers and cells counted with an inverted microscope. Heteroflagellates were counted by epifluorescence microscopy fol101,vingthe protocol of Haas (1982). Samples were fixed in glutaraldehyde (6%)and stained with proflavine before being filtered through 0.2 pm dark polycarbonate membrane filters. Bacteria were enumerated in DAPI-stained preparations (Porter & Feig 1980) by epifluorescence microscopy. Photosynthetic carbon fixation rates. Primary production was determined by the '*C method (Steeman-
Aristegui et al.. Carbon and oxygen fluxes In coastal Antarct~c~ v a t e r s
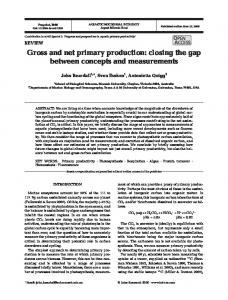
Time (hours)
Fig. 1 Time-senes measurements of dissolved oxygen concentration in water samples incubated inside replicate dark bottles at Stns S1 and S2 (1 m depth) Each measurement corresponds to the mean value of 4 replicates Vertical bars indicate + l SD
Nielsen 1952). At each i n situ station, water was collected before dawn from depths between 0 and 60 m. Eight duplicate samples were incubated during daylight (12 to 14 h) in 100 m1 polycarbonate bottles hanging on a drifter array at the depths from which they had been collected. Dark samples were incubated on board, in thermostatized baths reproducing i n situ temperatures. Each of the bottles was spiked with 8 to 15 pc1 of I4C-bicarbonate, the greater amount being added to samples with lower phytoplankton abundance. Following each incubation, samples were filtered on GF/F filters and acidified with l m1 HC1 (10%) for 18 h to drive off inorganic carbon. After this, filters were immersed in 6 m1 of Aquasol I1 (NEN) for 24 h, and the incorporated 14C beta-emission measured in a liquid scintillation counter using an external standard as a reference. At the beginning of each incubation a sample was filtered and used as a blank reference. In order to measure the radioactivity added to the samples, a 100 p1 aliquot of the 14C-bicarbonatesolution was mixed with 1 m1 of Protosol (NEN)and 5 m1 of Aquasol 11, and measured in the same scintillation counter. Community production and community respiration. Net community production, community respiration and gross production were determined by the oxygen method (Strickland 1960). Each water sample (the same used for the I4C experiments) was gently mixed and distributed with a silicone tube to 16 borosilicate bottles (100 m1 nominal volume): 6 initial, 6 light and 4 dark. Bottles were filled and samples fixed in a controlled-temperature room at 1 * 1°C. Light bottles were incubated i n s ~ t ualong with the ''C bottles. Dark bottles were incubated on board in refrigerated baths (+O.l°C)at in situ sea temperature for 24 h. Dissolved
193
oxygen was measured with the Winkler technique, following the recommendations of Carrit & Carpenter (1966), Bryan et al. (1976) and Grasshoff et al. (1983). The entire contents of the bottle were titrated in about 3 min. The titration was controlled by a n automated system, with colorimetric end-point detection (Williams & Jenkinson 1982). The precision achieved in replicates corresponded to a coefficient of variation of better than 0.08 %. Time-series incubations were performed to confirm that the respiration rate was constant throughout the expenments (Fig. 1 ) .Net community production was estimated as the difference between the light and initial bottles; community respiration as the difference between the initial and dark bottles; and gross production as the difference between the light and dark bottles.
RESULTS Hydrography, nutrients, chlorophyll and microbial distribution
The 4 stations represent different situations characteristic of coastal Antarctic waters during the austral summer Stn S1 (Antarctic Peninsula shelf) had a deep ( > l 0 0 m) mixed layer, with a uniform vertical distribution of chlorophyll and nutrients (Table 2, Figs. 2-4). The low percentage of chlorophyll > 2 pm indicated dominance by picoplankton. Diatoms were almost absent and larger phytoplankton were mostly represented by small cryptophytes (Table 3 ) . This station exemplifies the region of intense mixing a n d instability in the Bransfield Strait which results from the confluence of Weddell Sea and Gerlache Strait waters. Development of diatom bloon~sis inhibited by the deep mixed layer (Sakshaug & Holm-Hansen 1984, Kopczynska & Ligowski 1985). At Stn S2 (Gerlache Strait), the near-surface stratification of the water column was associated with increased abundance of phytoplankton 2 2 pm. Cryptophytes, although fewer than at S1, were still abundant, but the growth of small ( 2 pm (Tables 2 & 3, Figs. 2-4). Stn S3 (Hanusse Bay) exemplifies marginal ice zone waters where large diatom blooms develop (Broke1 1985, Kopczynska & Ligowski 1985, Knox 1990, Jacques & Panouse 1991, Lancelot et al. 1993). The temperature profile at this station (Fig. 2) showed a n irregular distribution caused by vertical mixing of melting Ice. Comparatively low nitrate values ( < l 2 my-at. were found in the mixed layer, probably as result of their consumption by the diatom bloom (Table 2; Fig. 3). Large diatoms like Rhizosolenia spp. and
Mar Ecol Prog Ser 132: 191-201, 1996
194
Table 2. Depth distributions of nitrate (NO3-),ammonia (Nit,+), chlorophyll a collected with GF/F (chl a) and polycarbonate membrane (chl a > 2 pm) filters, net community production (NP), gross production (GP) and community respiration (R) (*l SD) obtained by the oxygen method. I4C uptake by phytoplankton (14C).and apparent molar photosynthetic quotients [ap PQ(gross02/14C)]from the euphotic zone at Stns S1 to 54. NP and "C measurements refer to dayhght incubations (-13 h ) , R refers to 24 h Stn
Depth (m)
S1
S2
S3
S4
1 10 15 20 30 40 60 1 5 10 15 20 30 45 60 1 5 10 15 20 30 45 60 1 5 10 15 20 30 45 60
NO2-
NH,'
(mg-at. m-') 23.7 24.6 21.8 24.1 18.3 22.5 23.4 17.4 17.8 17.1 18.8 20.0 21.0 22.6 25.6 12.0 10.6 11.4 11.5 10.1 11.4 21.2 22.7 16.8 18.5 16.9 20.1 21.0 20.7 22.2 19.4
0.32 0.21 0.37 0.34 0.34 0.35 0.35 0.38 0.40 0.40 0.45 0.53 0.47 0.43 0.42 0.37 0.37 0.34 0.33 0.38 0.42 0.52 0.43 0.24 0.21. 0.24 0.26 0.31 0.33 0.37 0.52
Chl a
Chla > 2 pm
(mg m-3) 1.03 1.10 0.93 0.93 0.91 0.88 0.30 1.55 1.06 0.84 0.65 0.35 0.31 0 17 0.15 3.51 3.78 5.04 5.43 3.83 3.51 1.01 0.05 7.39 6.80 4.78 2 13 0 47 0 30 0.17 0.11
0.08 0.08 0.08 0.08 0.08 0.09 0.05 0.41 0.43 0.31 0.28 0.21 0.18 0.10 0.09 3.87 4.43 4.82 5.88 5.15 5.26 1.06 0.04 6.83 6.07 2.80 1.21 0.18 0.13 0.06 0.05
Chaetoceros sp, were responsible for most of the chlorophyll, which formed a sub-surface maximum below the productivity maximum (compare Figs. 4 & 5). The chlorophyll maximum may have been a result of the progressive sinking of the bloom. Phytoflagellate concentrations were lower than at S1 and S2, but heteroflagellates were more abundant (Table 3). Stn S4 (Deception Island) represen.ted calm waters with a well-developed warm layer near the surface. This layer contained a prasinophyte-dominated bloom, and the resulting shading restricted the euphotic zone to the first 15 m (Table 2, Figs. 2-4). Blooms of small flagellates are common in Antarctic open-ocean waters (Weber & El-Sayed 1987).Also, they have been ascribed to later successional stages in neritic communities (Broke1 1985, Knox 1990, Jacques & Panouse 1991, Lancelot et al. 1993).However, Schloss & Estrada (1994) have recently suggested that the change of
NP (mg O2 ,,,-3 d-l )
*
104 0 3.1 100.0 r 2.1 97.3 -r 1.7 85.6 i 3.0 55.3k5.1
R (mg 0, m-3
d-l)
11.5 i 3.0 13.0 i 2.5 13.9 i 1.9 14.6 i 1.2 7.7i5.0
GP (mg O2 m-3 d-l )
"C (mg C m-3 d.' 1
ap PQ (gross-Od
115.5 i 2.0 113.0 i 1.9 111.2 i 1.3 100.0 i 3.1 63.0i5.1
13.8 12.6 12.3 9.9 6.1 4.4 0.8 75.1 i 3.7 41.5 i 4.9 116.6 i 4.4 15.9 79 6 + 7.2 14.7 60.4 i 7.0 19.2 i 5.0 88.0 i 7.9 13.0 i 2.4 101 0 ? 9.4 15.3 44.4 i 3.1 13.0 i 4.9 57 4 4.9 10.3 5.4 9.1 k 3.1 1 2 . 9 i 1.5 2.4 3.8 i 3.4 9.1 i 2.6 4.9 + 1.9 0.7 -4.2 i 2.6 0.3 412.1 2.7 149.8 i 5.7 1561.9 z 7.4 73.7 433.9 8.2 149.8 i 7.4 583.7 t 9.0 106.7 327.4 8.0 166.6 i 8.2 494.0 i 6.2 34.0 173.7 6.7 168.2 i 6.1 341.9 i 5.9 30.9 27.4 79.0 + 1.6 157.4 + 4.9 236.4 i 5.0 10.1 3.3 161.3 + 10.8 171.3 i 11.2 29.1 0.2 0.1 1 0 2 1 . 3 i 11.4 178.1 + 1 9 1199.4 i 15.6 203.0 38.3 199.0 i 5.5 129.8 + 4.3 328.9 i 6.4 4.3 i 5.8 118.3 t 2.8 1 2 2 . 6 i 8.8 5.7 1.2 -1.2.2 i 1.7 40.8 2 2.7 28.6 2.5 0.5 -20.3+1.7 4 5 . 4 i 2 . 9 25.1k2.5 0.7 0.3 0.3
*
"C)
2.9 3.2 3.2 3.5 3.4
2.3 1.6 2.3 1.9 13
* * * *
*
*
dominance from diatoms to flagellates may be relateu to the presence of water masses of different origin. Heteroflagellates and bacteria were more abundant at S4 than at the other stations (Table 3), suggesting that, even during phytoplankton blooms, microbial loop processes were ~mportant.
Carbon fixation and oxygen evolution Vertical profiles of rates of gross production (GP),net community production (NP) and community respiration (R), as well as carbon fixation (14C),are shown in Fig. 5. Both oxygen and carbon units are expressed in mg m-3 h-'. In general, there is a good agreement in the shape of the GP and I4C profiles. Moreover, the correlation between the 2 variables is high)\ s i g n ~ f i cant (r2 = 0.89, log-log scale) (Fig. 6 ) . However, the
Aristegui et al.: Carbon and oxygen fluxes in coastal Antarct~cwaters
195
magnitude of both measurements differs T e m p e r a t u r e ("C) T e m p e r a t u r e ("C) considerably, leading to mean apparent pho0.7 0.8 0.9 1.0 0.0 0.5 1.0 1.5 2.0 2.5 l " " " ' 0 tosynthetic quotients (moles O2/I4C)greater o than 2 (Table 2 , Fig. 7 ) . 10 Integrated carbon uptake rates for the upper 60 m, measured by '*C, lay between 20 0 3 and 1.5 g C m-' d-'. This 5-fold variabil5 ity does not seem unusual for coastal waters 5 30 near the Antarctic Peninsula. Holm-Hansen Q 40 & Mitchell (1991) reported primary production rates of 0.1to 3 . 4 g C m-2 d-' for the Ger50 lache and Bransfield Straits during spring and summer. Furthermore, large interan60 nual variabilities in average pigment con34.0 34.1 34.2 33.0 33.5 34.0 centration (Comiso et al. 1993) and annual l I I I ' I ' I ' I ' I mass flux rates (Wefer & Fischer 1991) have 27.30 27.35 27.40 26.4 26.7 27.0 27.3 27.6 been reported for coastal areas, suggesting that time-dependent mechanisms influence -0.4 -0.3 -0.2 -0.1 0.0 1.0 1.2 1.4 1.6 1 . 8 2.0 I phytoplankton distribution and productivity. o o Respiration rates, expressed either in vol10 110 ume units or integrated over the water column, were also very variable (up to 1 order S < 4:120 of magnitude) among stations (Table 2). The ';j. 20 , > ; ' lower values are similar to the upper range ,> 30 30 ';' >,, of rates given by Williams (1984) for the ; Antarctic Ocean. However, Robinson & A 40 40 ic; .i ,' Williams (1993) reported respiration rates #. C' :. 50 near the Antarctic Convergence which a r e 50 7' 2 ., more similar to our data (see also Aristegui & 60 60 I Montero 1995). 32 33 34 33.9 34.0 34.1 Daily (-13 h) oxygen and carbon balances 0 Salinity (PSU) S a l i n i t y (PSU) for the upper 30 m a r e shown in Table 4. This l ' I ' I ' I m I I I i depth approximately coincided with the mean 25.5 26.0 26.5 27.0 2 7 . 5 27.1 27.2 27.3 -3 euphotic zone depth (34 17 m ) ,calculated as S i g m a Theta (Kg m ) 0 Sigrna T h e t a ( K g m - = ) the 1 '% surface light penetration depth from Fig. 2. Vertical profiles of temperature ("C),salinity (PSU)and sigrna theta several stations in the studied area, including (kg m- 3 , at Stns S1 to S4 the 4 in situ ones. Oxygen was transformed to carbon using a molar PQ (photosynthetic quotient) of 1.5 and a n RQ (respiratory quotient) of 1. We biology of coastal ecosystems in the vicinity of the Antarctic Peninsula. This variability underlines the assumed that nitrate w a s the main source of nitrogen importance of adequate sampling to overcome errors consumption by phytoplankton, since ammonia concentration in the water column was low compared with in the estimation of productivity in the area. The stanitrate concentration (Fig. 3). According to this, total tions are located in one of the most productive areas daily water-column integrated carbon incorporation of the Antarctic Ocean, where extensive phytoplankmeasured by radiocarbon uptake in the particulate fracton blooms have been reported (Comiso et al. 1993). However, daily productivities may range over more tion underestimated net community production meathan 1 order of magnitude on scales of tens of kilomesured by the oxygen method by 29 to 54 %. ters (Holm-Hansen & Mitchell 1991). Overall, our I4C fixation values a r e in the same range a s those DISCUSSION reported for other Antarctic coastal areas (see Walsh 1989 for references), and Stn S3 (at the marginal ice Daily primary production zone) showed integrated productivity greater than 1 g C m-2 d-' (Table 4), comparable to that of the most The stations selected for this study demonstrate the productive coastal regions (Holm-Hansen & Mitchell wlde variability that exists in the hydrography and 1991).
-
'B
,.I i ;1
0
*
196
Mar Ecol Prog Ser 132: 191-201, 1996
Nitrate ( m g - a t '0
20
15
0.0 0 2 3
0.4
25
0.6
08
10
00
Ammonia ( m g - a t
m
-3
)
15
02
Total Chlorophyll a (mg m - ) 20
0.4
25
0.6
0.8
m-3) o
Fig. 3. Vertical profiles of nitrate (mg-at. (mg-at. m-') at Stns S1 to S4
Chlorophyll a > 2 p m ( m g
and ammonia collected Fig. 4. Vertical profiles of chlorophyll a (mg with GF/F filters (total chlorophyll) and polycarbonate membrane filters (chlorophyll > 2 pm) at Stns S1 to S4
Apparent photosynthetic quotients
Fig. 5. Vertical profiles of gross production ( G P ) , net cornmunity production (NP) and community respiration (Rjobtained by the oxygen method (in mg 0, m-' h-'), and I4C uptake by phytoplankton (in mg C m-3 h-') at Stns S1 to S4
The comparison of the I4C and oxygen data shows, however, that our I4C measurements of carbon uptake underestimated both gross and net production calculated from oxygen changes. Apparent molar PQ(gross02/14C)and PQ(net-02/14C)values calculated from our results (Table 2, Fig. f ) , were on average higher than the theoretical upper PQ boundaries calculated by Williams & Robertson (1991) for conventional photosynthetic products. The latter authors attribute high PQ values to unshared systematic errors in the O2 and 14Cmethods. Analytical errors in the 14Cmethod, however, are more likely to be the cause of high PQ values, since in the O2 method the enhancement of lightinduced respiration in light bottles (the most significant error of the method) leads to a n underestimation of gross production. Williams (1993) pointed out the ' C within the cell and the resrecycling of respiratory ' piration of freshly fixed 14Cas two of the main reasons accounting for an upward shift in the apparent PQ values. In this context, Li & Harrison (1982) found that non-linearity of 14C uptake in Arctic plankton, caused by catabolic loss of radiocarbon, might lead to an underestimation of true gross production by 40% after 24 h.
Aristegui et al.: Carbon and oxygen fluxes in coastal Antarctic waters
197 -
Table 3. Depth distributions of cell abundances of the most representative phytoplankton groups (diatoms, prasinophytes and cryptophytes), heterotrophic flagellates and bacteria at Stns S1 to S4 Station S1
S2
S3
S4
Depth (m)
Diatoms (cells ml-l) 7 14 16 2
Cryptophytes (cells ml-')
Prasinophytes (cells m]-')
Heteroflagellates (cells ml- ')
100
1300 1650 1000 1400 700 700 1700
10 10 1
1 10 15 20 30 40 60
-
2580 1320 2180 2330 2090 1000 1000
1 5 10 15 20 30 45 60
16 150 37 771 70 26 11 7
640 800 190 140 160 15 42 15
1 5 10 15 20 30 45 60 1 5 10 15 20 30 45 60
470 550 900
60 60 47
900 960 54 15
20 6
9 43 20 66 17 15
-
Log Gross Production Fig. 6. Relationship between gross production obtained by the oxygen method (in mg 0, m'3 h-') and uptake (in rng C mr3 h-'). Data are log-transformed; line of best fit 1s shown (r' = 0.89, n = 22)
'v
100 161 161 161 100 53 31 107
-
Bacteria (X
1O2 cells rnl-'1
--
2350 3350 2150 3150
2750 2000 1800 2100 1850 1850 800 800
1650 1900 2700 2250 2100
2 1 1
1500 2600 1600 2450 1500 1750 1100 700
1500 2300 2500 2200 2350 2600 2750 2100
5000 1300 1000 540
4500 3750 4200 4000 5000 3700 2500 2500
3700 5300 4700 5100 6500 4000 3000 5500
-
-
-
-
2200
Apparent PQ
Fig. 7. Frequency distnbution of apparent gross and net molar photosynthetic quotients [ ( g r o s ~ - O ~ / ' ~(net-02/14C]], C), calculated from the euphotic zone at Stns S1 to S4
Mar Ecol Prog Ser 132: 191-201, 1996
198
Table 4. Depth integrated values of ''C uptake by phytoplankton, and gross production (GP) and community respiration (R) calculated by the oxygen method. GP, R and "C measurements refer to daylight ~ncubations(-13 h). Respiratory losses of GP in oxygen (02) and carbon (C)units are calculated. A photosynthetic quotient of 1.5 and a respiratory quotient of 1 (mol:mol)were used to transform oxygen to carbon (see text for details). ZEZ:depth of the euphotic zone at each station Station
(m) S1
58
Range (m)
GP R R "C uptake GP (mg C m-2) (mg 0, m-') (mg C m-2) (mg O2m-2) (mg C m
0-30 0-60
4 l9
3 1.6
2,
R/GP (0,)
R/GP (C)
(%)
(%)
2760
690
188
71
6.8
10.3
S2
35
0-30 0-60
279 308
1571
393
236
89
15.0
22.6
S3
30
0-30 0-60
1303 1525
8194
2049
2269
85 1
27.7
4 1.5
S4
15
0-30 0-60
620 63 1
4133
1033
1385
520
33.5
50.3
An additional source of error in the calculation of apparent PU may arlse from unaccounted-for dissolved organic carbon (DOC) exudated by cells during the incubation period (Williams & Robertson 1991). In our study no correction was made for either phytoplankton I4C respiratory losses or excretion. Therefore, we are not able to quantify the magnitude of these errors. Phytoplankton excretion could be, however, a primary explanation of the high PQ observed, according to recent results published from polar sea studies. From changes in the concentration of ambient nutrient pools, Karl et al. (1991b) estima.ted that at least 40 to 50% of photosynthetically fixed carbon may accumulate as DOC in the euphotic zone of Bransfield and Gerlache Strait waters. This loss could account for the difference found between our estimates of net primary production from 0, change and net particulate C assimilation from I4C uptake. High concentrations of DOC have been reported for water samples collected from the Bransfield Strait during the austral summer (Bolter & Dawson 1982). Supporting these observations, David.son & Marchant (1992) reported high concentrations of dissolved organic matter coinciding with a Phaeocystis bloom in another coastal Antarctic area. These findings also agree with recent experiments carried out during a spring bloom in the Barent Sea. Passow et al. (1994) and Vernet et al. (1994) observed that an average 50 to 70% of the primary production was released as extracellular carbon by phytoplankton during the u.ptake expenments. Pomeroy & Wiebe (1993) showed evidence that bacterial growth and respiratory rate may be limited by substrate availability in low temperature environments. Therefore, a large DOC pool or flux might have important implications on the abundance and metabolism of bacteria in coastal waters near the Antarctic Peninsula. Karl et al. (1991a), however, found that in these areas bacterial population dynamics were uncoupled from
photoa.utotrophic processes during the seasonal bloom. Moreover, bacterial numbers were lower than expected in relation to the chlorophyll concentrations found. Our results (Table 3) show similarly low bacterial numbers for the 4 stations, although we do not know if there were differences in their metabolic activities. Despite the latter evidence we can not be sure of the causes that produced our observed high PQ. For instance, Tilzer & Dubinsky (1987) calculated lower extracelIular losses (between 9 and 12.4 % of total 24 h production) by phytoplankton from the Bransfield Strait. A more detailed simultaneous study of carbon (I4Cand CO2)and oxygen fluxes in this coastal Antarctic region considering soluble organic material exudated by phytoplankton during 14C uptake experiments is needed in order to clarify this problem. In any case, there is increasing evidence that particulate 14C assimilation measurements underestimate primary production in Antarctic waters. Minas & Minas (1992) obtained, in open-ocean Antarctic waters, estimates of daily average new production (from observations of nitrate removed from the water column) of the same magnitude as, or even higher than, estimates of production from 14Cuptake measurements. Karl et al. (1991a) observed that although microbial biomass was clearly dominated by phytoplankton in the Bransfield and Gerlache Straits during some periods of the year, autotrophic production (by the I4C method) appeared to be only a small portion of total microbial production (by the [3H]-adenine method). This suggests that autotrophic production could have been severely underestimated by the I4C method.
Water column balance
Oxygen fluxes from the upper 30 m (approximately the euphotic zone for these coastal waters) showed
Aristegui et al.: Carbon and oxygen fluxes ~n coastal Antarctic waters --
positive net production at all stations. Integrated respiration accounted for 7 to 34 9;) of the GP in oxygen units and 10 to 50% in carbon units (Table 4). These percentages are higher than the estimated value ( < l 0 % of GP) derived by Tilzer & Dubinsky (1987) from I4C uptake experiments for phytoplankton in the Bransfield Strait. The contribution of phytoplankton to microbial respiration in Antarctic coastal waters is not well known, but is certainly high. In most marine ecosystems microheterotrophs contribute a large part of total microbial respiration (Pomeroy & Johannes 1966, 1968, Williams 1981a, b, Harrison 1986, Iriarte et al. 1991). However, in coastal Antarctic waters phytoplankton seem to dominate microbial respiration. Several studies (Lancelot et al. 1991, Estrada et al. 1992, Martinez & Estrada 1992, Aristegui & Montero 1995) have shown that community respiration is closely related to chlorophyll or primary production in Antarctic coastal waters. Our respiration data also show a correlation with total chlorophyll (r2 = 0.69, log-log scale) and chlorophyll > 2 pm (r2 = 0.87, log-log scale), suggesting that most respiration in the euphotic zone was due to large phytoplankton. This agrees with the conclusions of Karl et al. (1991a) that phytoplankton play the main role in community metabolism in the Bransfield and Gerlache Straits. Carbon fluxes calculated by Lancelot et al. (1991) in the Scotia a n d Weddell Seas using a coupled physicalbiological model yielded average phytoplankton respiratory losses of 5 0 % of GP, while microheterotrophic respiration (due to bacteria and protozoa) accounted for 25 to 30% of GP. The planktonic food web described by Lancelot et al. (1991), in which 71 % of the net primary production is assimilated in the microbial food web, may differ from the hypereutrophic diatom-dominated ecosystems found in Antarctic coastal waters (Huntley et al. 1991, 1992), where phytoplankton and bacterioplankton population dynamics are uncoupled (Karl et al. 1991a). However, it illustrates the importance of phytoplankton respiratory losses to the overall photosynthetically fixed carbon. If w e were to conclude that most of the community respiration at high chlorophyll concentrations is d u e to phytoplankton, then Lancelot et al.'s (1991) calc'ulations on phytoplankton respiratory losses would broadly agree with the values we obtained from our 2 more productive stations (S3 and 5 4 ) . Considering that on average 40% of GP is lost by phytoplankton respiration during phytoplankton bloom situations, the carbon flux model proposed by Huntley et al. (1991) for hypereutrophic coastal Antarctic ecosystems should be reconsidered. These authors did not include phytoplankton respiration in their model, a n d as a result they increased the imputed
199 -
heterotrophic contribution to the carbon flux budget (Moloney 1992). Recalculations of their data including phytoplankton respiratory losses of 40%0 of GP would lead to respiratory losses by air-breathing top predators of about 7 % . Recent estimations of carbon consumption rates by top predators, derived from animal densities in coastal Antarctic ecosystems (Franeker et al. 1994),suggested that less than 0.5 '% of primary production is being returned to the atmosphere, even in areas where top predators are abundant. This value is still far lower than the recalculated value obtained after considering phytoplankton respiration. Huntley et al. (1991, 1992) assumed in their model that more than 90% of net primary production was (either directly or indirectly) channeled to macrozooplankton. However, although particle sedimentation in the Antarctic Peninsula area may be largely mediated by krill (Wefer et al. 1982, 1988, Dunbar 1984, Bodungen et al. 1987), sedimentation of intact cells and rapid sinking of diatom resting spores (Bodungen et al. 1986, Liebezeit 1987, Karl et al. 1991b, Leventer 1991) is another important pathway for carbon export not considered in Huntley et al.'s (1991) model. Furthermore, Banse (1995) has recently questioned the gross growth efficiencies used by Huntley et al. (1991) in their carbon flux model. According to Banse (1995),the use of lower growth efficiencies in the model [characteristic of field populations, instead of the higher growth efficiencies of individuals used by Huntley et al. (1991))would lead to a leaking to the atmosphere of 5 3 % of the net primary production by air-breathing top predators. In summary, our results show that all phytoplankton losses (including exudation a n d respiration) must be carefully considered to interpret carbon fluxes in coastal Antarctic regions. Microbial respiration represents a considerable loss of photosynthetically fixed carbon in productive ecosystems in the waters around the Antarctic Peninsula. This loss is in all instances much higher than the respiratory loss due to top predators. Acknorvledgements. This work was supported by project 'Oceanografia Dinamica y Productividad e n el Estrecho d e Bransfield, durante el Verano Austral' (Comision Interministerial d e C'lcncia y Tecnologia). The authors acknowledge M. Rodriguez for nutrient analysis. M. Garcia for CTD data, and P Tett for critical revicw of the manuscript. Mre also thank 2 anonymous reviewers for their comments and suggestions.
LITERATURE CITED Aristegu~J , Montero M F (1995) Plankton community respirat ~ o nin Bransfield Stralt (Antarctic Ocean) during austral spring. J Plankton Res 17:1647-1659 Banse K (1995) Antarctic marine top predators revisited: homeotherms do not leak much CO, to the air Polar Biol 15:93-104
200
Mar Ecol Prog Se
Bodungen B von, Fisher G , Nothig EM, Wefer G (1987) Sedimentation of krill faeces during spnng development of phytoplankton in Bransfreld Strait, Antarctica Mitt Geol Palaeontol Inst Univ Hamburg 62:49-164 Bodungen B von, Smetacek VS, Tilzcr hlxl, Zeitzschel B (1986) Primary production and sedimentation during spring in the Antarctic Peninsula region. Deep Sea Res 33: 177-194 Bolter M, Dawson R (1982) Heterotrophic utilisation of biochemical compounds in Antarctic waters. Neth J Sea Res 16:315-332 Broke1 K von (1985) Primary production data from the southeastern Weddell Sea. Polar Biol 4:75-80 Bryan JR, Riley JP, Williams PJLeB (1976) A procedure for making precise measurements of oxygen concentration for productiv~tyand related studies. J Exp Mar Biol Ecol 21.191-197 Carrit DE. Carpenter J H (1966) Comparison and evaluation of currently deployed modifications of the Winkler method for determining dissolved oxygen in seawater: a NASCO Report. J Mar Res 24:287-318 Comlso JC. McClain CR, Sullivan CW, Ryan JP, Leonard CL (1993) Coastal Zone Color Scanner pigment concentrations in the Southern Ocean and relationships to geophys~ c a surface l features. J Geophys Res 98:2419-2451 Davidson AT, Marchant HJ (1992) Protist interactions and carbon dynamics of a Phaeocystis-dominated bloom at a n Antarctic coastal site. Polar Biol 2:387-395 Dunbar RB (1984) Sediment trap experiments on the Antarctrc continental margin. Antarct J US 19 70-71 Estrada M, Martinez R. Mathod S (1992) Respiratory electron transport activity in plankton of the Weddell and Scotia Seas during late spring-early summer: relationships i v ~ t h other biological parameters Polar Biol 12:35-42 Franeker JA van, Bathmann U , Mathot S (1994) Southern Ocean carbon fluxes: the role of top predators EOS 75(suppl):177 Geider RJ (1992) Respiration: taxation without representat ~ o n ?In: Falkowsky PG, Woodhead AD (eds] Primary productivity and biogeochem~calcycles In the sea. Plenum Press, New York, p 333-360 Grasshoff K, Ehrhardt M, Kremling K (1983) Methods of seawater analysis Verlag Chemie, Deerfield Beach, FL Haas L (1982) Improved epifluorescence microscopy for observing plankton~cmicro-organisms. Ann Inst Oceanogr, Paris 58:261-266 Harrison WG (1986) Respiration and its size dependence in microplankton popu.lations from, surface waters of the Canadian Art~c.Polar Biol 6:145-152 Holm-Hansen 0, Lorenzen CJ, Holmes RW, Strickland JDH (1965) Fluorometric determination of chlorophyll. J Cons Int Explor Mer 30:3-15 Holm-Hansen 0, M~tchellBG (1991) Spatial and temporal distribution of phytoplankton and primary production in the western Bransfield Strait region. Deep Sea Res 38: 961-980 Huntley ME, Lopez MDG, Karl DM (1991) Top predators in the Southern Ocean: a major leak in the brological carbon pump. Science 253:64-66 Huntley ME, Lopez MDG, Karl DM (1992) Response to the comment of Moloney CL. Science 257:259-260 Iriarte A, Daneri G , Garcia VMT, Purdie DA, Crawford DW (1991) Plankton community respiration and i.ts relationship to chlorophyll a concentration in marine coastal waters. Ocean01 Acta 14:379-388 Jaques G , Panouse 54 (1991) Biomass and composition of size fract~onatedphytoplankton In the Weddell-Scotia Conflu-
ence area. Polar Biol 11:315-328 Karl DM, Holm-Hansen 0 ,Taylor GT, Tien G , Blrd DF (1991a) hlicrobial biomass and productivity in the western Bransfield Strait, Antarctica during the 1986-1981 austral summer. Deep Sea Res 38:10291055 Karl DM, Tilbrook BD, Tien G (1991b) Seasonal coupl~ngof organic matter production and particle flux In the western Bransf~eldS t r a ~ tAntarctica. , Deep Sea Res 38:1097-1126 Knox C;A (1990) Prlmary production and consumption in hfcMurdo Sound. Antarctica. In: Kerry KR, Hempel G (eds)Antarctic ecosystems. Ecologrcal change and conservatron. Springer-Verlag, Berlin, p 115-128 Kopczynska EE, Ligolvski R (1985) Phytoplankton composltion and biomass distribution in the southern Drake Passage, the Bransfield Strait and the adjacent waters of the Weddell Sea in December 1983-January 1984 (BIOMAXSIBEX) Pol Polar Res 6:65-77 Lancelot C, Billen G, Veth C, Becquevort S, Mathot S (1991) Modelling carbon cycling through phytoplankton and microbes in the Scotia-Weddell Sea area during sea ice retreat Mar Chem 35:305-324 Lancelot C, Mathot S, Veth C, Baar H de (1993) Factors controlling phytoplankton ice-edge blooms in the marginal ice-zone of the northwestern Weddell Sea during ice retreat 1988: field observations and mathematical modelling. Polar Biol 13:377-387 Leventer A (1991) Sediment trap diatom assemblages from the northern Antarctic Peninsula region. Deep Sea Res 38:1127-1143 Li WKW, D~ckiePM (1991)Light and dark uptake in dimly lit oligotrophic waters: relation to bacterial activity. J P1,lnkton Res 13(suppl):29-44 Li WKtL', Harrison WG (1982) Carbon flow Into the end-products of photosynthesis in short and long incubations of a natural phytoplankton population. Mar Biol 72:175-182 Li WKW, Irwin BD, Dickie PM (1993) Dark fixation of ''C. variations related to biomass and productivity of phytoplankton and bacteria. Limnol Oceanogr 38:483-494 L~ebezeitG (1987) Particulate carbohydrate fluxes in the Bransf~eldStrait and the Drake Passage. Mar Chem 20 255-264 Longhurst AR. Harrison WG (1989)The biological pump: profiles of plankton production and consumption in the upper ocean. Prog Oceanogr 22:47-123 mar tint?^ R, Estrada M (1992) Respiratory electron transport activity of microplankton in the Weddell Sea during early spring: Influence of the ice cover and the ice edge. Polar Biol 12:275-282 Minas HJ, Minas M (1992) Net community production In 'High Nutrient-Low Chlorophyll' waters of the troprcal and Antarctic Oceans: grazing vs iron hypothesis. Oceanol Acta 15145-162 Moloney CL (1992) Carbon and the Antarctic marine food web. S c ~ e n c e257:259 Parsons TR, Maita Y . Lalli CM ( 1 984) A manual of chem~cal and biological methods for seawater analysis. Pergamon Press, Oxford Passow (1, Wassmann P, Vernet M (1994)A new hypothesis on the fate of extracellular carbon released by phytoplankton in Arctic shelf waters. EOS 75(suppl):116 Pomeroy LR. Johannes RE (1966) Total plankton respiration. Deep Sea Res 13:971-973 Pomeroy LR, Johannes RE (1968) Occurrence and respiration of ultraplankton m the uppc'r 500 m of the ocean. Deep Sea Res 15381-391 Pomeroy LR. Wiebe \VrJ (1993) Energy sources for microbial food webs Mar Microb Food Webs 7:101-118
'v
Aristegui et al.: Carbon and oxygen fluxes in coastal Antarctic waters
20 1
Porter KG, Feig YS (1980) The use of DAPI for identifying and counting aquatic microflora. Llmnol Oceanogr 25:943-947 Robinson C, Williams PJLeB (1993) Temperature a n d Antarctic plankton community respiration. J Plankton Res 15: 1035-1051 Sakshaug E, Holm-Hansen 0 (1984) Factors governing pelagic production in polar oceans. In: Bolis L, Gilles R (eds) Marine phytoplankton a n d productivity. SpringerVerlag, New York, p 1-17 Schloss I, Estrada M (1994) Phytoplankton composition in the Weddell-Scotia Confluence area during austral spring in relation to hydrography. Polar Biol 14:77-90 Steeman-Nielsen E (1952) The use of radio-active carbon (I4C)for measunng organic production in the sea. J Cons lnt Explor Mer 18:117-140 Strickland JDH (1960) Measuring the production of marine phytoplankton. Bull Flsh Res Bd Can 122:l-172 Sullivan CW, Arngo KR, McClain CR, Comiso J C , Firestone J (1993) Distnbutions of phytoplankton blooms in the Southern Ocean. Science 262:1832-1837 Tilzer MM, Dubinsky Z (1987) Effects of temperature and day length on the mass balance of Antarctic phytoplankton. Polar Biol 7:35-42 Vernet M, Matrai PA, Rue1 J (1994) Photosynthetic carbon production at the ice e d g e in the Barents Sea: cellular and extracellular carbon pools. EOS 75(suppl):127 Volk T, Hoffert M1 (1985) Ocean carbon pumps, analysis of relative strengths and efficiencies in ocean-driven atmospheric CO2changes. Geophys Monogr 32:99-110 Walsh J J (1989) Arctic carbon sinks: present and future. Global Biogeochein Cycles 3:393-411 Weber LH, El-Sayed SZ (1987) Contributions of the net, nanoand picoplankton to the phytoplankton standing crop and primary productivity in the Southern Ocean. J Plankton Res 9:973-994
Wefer G , Fisher G (1991) Annual primary production and export flux in the Southern Ocean from sediment trap data. Mar Chem 35:597-613 Wefer G, Fisher G, Fiitterer D, Gersonde R (1988) Seasonal particle flux in the Bransfield Strait, Antarctica. Deep Sea Res 35:891-898 Wefer G, Suess E, Balzer W, Liebezeit G. Muller PJ, Ungerer CA. Zenk W (1982) Fluxes of biogenic components from sediment trap deployment in circumpolar waters of the Drake Passage. Nature 299:145-147 Williams PJLeB (1981a) Microbial contribution to overall plankton community respiration-studles in enclosures In. Grice GD. Reeve MR (eds) Marine mesocosms: biological and chemical research in experimental ecosystems Springer-Verlag, Berlin, p 305-321 Willlams PJLeB (1981b) Microbial contribution to overall marine plankton metabolism: direct measurements of resp ~ r a t ~ oOcean01 n Acta 4:359-364 Wllllams PJLeB (1984) A review of measurements of resplratlon of marine plankton populations. In: Hobble J A , Williams PJLeB (eds) Heterotrophic activity in the sea. Plenum Press, New York, p 357-389 Williams PJLeB (1993) Chemical a n d tracer methods of measuring plankton production. ICES Mar Sci Symp 197:20-36 Williams PJLeB. Jenlunson NW (1982) A transportable rnicroprocessor-controlled precise Winkler titration suitable for field station a n d shipboard use. Limnol Oceanogr 27: 576-584 Williams PJLeB, Robertson J E (1991) Overall planktonic oxygen and carbon dioxide metabolisms: the problem of reconciling observations and calculation~of photosynthetic quotients J Plankton Res 13 (suppl):l53-169 Yentsch CS, Menzel DW (1963) A method for the determlnation of phytoplankton chlorophyll and phaeophytln by fluorescence Deep Sea Res 10:221-231
This article was submitted to the editor
Manuscript first received: May 3, 1995 Revised version accepted: October 2, 1995