chloric acid mixture, by extracting the analyte from the digest, or both. In addition, high ashing temperatures may be needed to drive off interfering inorganic.
CLIN. CHEM. 27/1, 68-72 (1981)
Polarized Zeeman-Effect Flameless Atomic Absorption Spectrometry of Cadmium, Copper, Lead, and Manganese in Human Kidney Cortex Patricia A. Pleban,1 Julius Kerkay, and Karl H. Pearson2 We used polarized Zeeman-effect flameless atomic absorption spectroscopy to quantitatively measure cadmium, copper, lead, and manganese in a nitric acid digest of lyophilized human kidney cortex. Within-run coefficients of variation for cadmium, copper, lead, and manganese, 15.3, 177.2, 84.2, and 56.3 .tg/L, respectively, were 4.1, 6.3, 3.7, and 5.6%, respectively. Between-run coefficients of variation were 6.9, 5.5, 5.9, and 6.3%, respectively, for cadmium, copper, lead, and manganese concentrations of 135.1, 12.8, 2.72, and 3.80 ig/g, respectively. For cadmium, copper, lead, and manganese digest concentrations (mean ± SD) of 15.3 ± 0.6, 41.4 ± 2.6, 9.4 ± 0.6, and 20.9 ± 0.4 ig/L, respectively, the detection limits were 5.2 tg/L for copper, 1.2 .tg/L for both cadmium and lead, and 0.8 jzg/L for manganese. Assays were linear to 75 .tgIL for cadmium, 100 tg/L for manganese, and 200 g/L for copper and lead. Average analytical recoveries for the four metals ranged between 95 and 101 Because these metals were quantitated in the same digest of kidney cortex, the values for each digest gave a tracemetal profile for each autopsy specimen. %.
Additional tervals
Keyphrases: toxicology
#{149}
trace elements reference infl(jtrifiQfl tissue analyses .
.
.
Environmental and nutritional studies have prompted interest in measurement of trace elements in human kidney cortex, because this tissue accumulates heavy metals such as cadmium and lead and is rich in mitochondria that concentrate manganese and copper. Electrothermal flameless atomic absorption spectroscopy offers good sensitivity, operational simplicity, and relatively inexpensive instrumentation, compared with other available techniques such as neutron activation analysis and x-ray fluorescence. However, determination of the analyte metal in a complex matrix such as tissue suffers from chemical and spectral background interferences from other matrix constituents (1-3). Therefore, it is often necessary to remove these interferences by wet digestion with a nitric acid!perchloric acid mixture, by extracting the analyte from the digest, or both. In addition, high ashing temperatures may be needed to drive off interfering inorganic salts (4-6). These timeconsuming pretreatments are a source of contamination or analyte loss (4). In particular, the presence of chloride in the matrix leads to loss of cadmium and lead as their volatile chlorides at high ashing temperatures (>400 #{176}C) (7).
Department of Chemistry, Cleveland, OH 44115. Present
address:
Department
The
Cleveland
of Chemical
University, Norfolk, VA 23508. 2 Also with the Division of Laboratory
State
Sciences, Medicine,
University, Old Dominion
The Cleveland
Clinic Foundation, Cleveland, OH 44106. Address correspondence to this author at Cleveland State University. Presented in part at the 176th national meeting of the American Chemical Society, Miami Beach, FL, September 1978 (Abstract ANAL-51). Received July 14, 1980; accepted Sept. 12, 1980.
68
CLINICAL CHEMISTRY, Vol. 27,No. 1,1981
Conventional deuterium-lamp background correction requires that both the intensity and beam alignment of the hollow cathode lamp and the deuterium continuum lamp be matched (8). It is difficult to match intensities for wavelengths below 200 nm and above 350 nm, owing to the emission characteristics of the deuterium lamp. In addition, background absorbances greater than 0.4 A cannot be corrected (9). Recently, a background correction system based on the polarization characteristics of the Zeeman-effect has become commercially available. Analyte-shifted Zeeman-effect atomic absorption spectroscopy offers accurate and reproducible background correction during atomization for broad-band molecular absorption, light scattering, and wavelength-dependent radiation. The background is corrected for by placing the graphite cuvette in the field of a 1.1-T (11-kG) permanent magnet. During atomization, the magnetic field produces splitting of the electronic states of the analyte. The nonshifted, or w, component, which is polarized parallel to the magnetic field, is located at the original transition wavelength; wavelengths of the o’ and a+ components, which are polarized perpendicular to the magnetic field, are shifted bathochromically and hypsochromically, respectively. A rotating Senarmont quartz polarizer, placed between the hollow cathode lamp and the graphite cuvette, polarized the radiation of the hollow cathode lamp alternately parallel and perpendicular to the magnetic field. Thus, the parallel radiation contains background absorption and analyte absorption, whereas the perpendicular radiation contains only background absorption. Background absorption is corrected for by electronically subtracting the perpendicular absorbance from the parallel absorbance. Correctable background absorbances, which somewhat depend upon the element being analyzed, are generally 1.7 A or less. Koizumi etal. (10) described in detail the theory and instrumentation of analyte-shifted Zeemaneffect flameless atomic absorption spectroscopy. This method is ideally suited for direct analysis of trace metals in biological matrixes. Cadmium, copper, lead, and manganese can be quantitatively measured in the same simple nitric acid digest of kidney cortex after low temperature ashing, thus giving a trace-metal profile for each autopsy specimen.
Materials and Methods Apparatus We used a Zeeman-effect flameless atomic absorption spectrometer, Model 170-70 (NSI Hitachi, Mountain View, CA 94043), equipped with a R955 photomultiplier tube (Hamamatsu Corp., Middlesex, NJ 08846), sensitive to lowultraviolet wavelengths. Both cup-type and tube-type graphite cuvettes (Naka Works, Hitachi Ltd., Katsuta Ibaraki, 312, Japan) were used foranalyses. Atomic absorption signals were recorded with a fast-response, dual-pen recorder (Hitachi Model 056), which allowed simultaneous monitoring of analyte and background absorption. Thus we could determine whether the background absorbance remained below the correctable value, 1.7 A. The spectrometer is equipped with two gas-flow systems. The first, a “sheathing” system, protects the furnace assembly
Table 1. Instrument Settings and Conditions for the Analyses Cadmium
Dry
Ash
Atomize
Ar carrier gas, L/min Ar sheath gas, L/min Wavelength, nm Band pass, nm Scale expansion, A Pen response Lamp current, mA Cuvette, type
step, 40 s, 20 A, (100#{176}C) step, 40 s, 40 A, (250 #{176}C) step, 8s, 200 A, (1800 #{176}C) 0.6 2 228.8 1.1 0.5 Fast (1) 7.5 cup
and electrodes from oxidation. The second system, the carrier gas, flows from the ends of the cuvette to the central portion and tends to maintain the metal vapor in the homogeneous portion of the magnetic field. The flow of carrier gas was regulated with an external flow meter (Lab Crest Scientific Glass Co., Warminster, PA 18974), which allowed the gas flow to be adjusted from 0 to 100 mL/min. Argon gas was used for both flow systems. Tissue specimens were washed with a pressurized stream of distilled de-ionized water from a Teflon-lined tank, then lyophilized (Labconco Freeze Dryer 5, Model 75050; Labconco Corp., Kansas City, MO 64132, equipped with a Welch vacuum pump, Model 1402; Sargent Welch Co., Skokie, IL 60076). All polypropylene tubes and linear polyethylene volumetric ware were soaked overnight in nitric acid (6 mol/L, ACS reagent grade; Fisher Scientific, Pittsburgh, PA 15219), then rinsed with distilled de-ionized water before use. Volumetric ware (Nalge Co., Rochester, NY 14602) was used for standard preparations. Polypropylene 12 X 75 mm tubes with caps (Falcon, Cockeysville, MD 21030) were used for all digestions and dilutions. Eppendorf automatic pipets (Brinkmann Industries, Westbury, NY 11590) were used for all analyses.
Reagents “Ultrex” grade 70% nitric acid (J. T. Baker Chemical Co., Phillipsburg, NJ 08865) was used for all tissue dissolutions and assays. NBS Bovine Liver Standard Reference Material, SRM 1577 (National Bureau of Standards, Washington, DC 20234) was used for the recovery studies of all metals. Cadmium working standard, 1 mg/L, was prepared in dilute (3.6 mL/L) nitric acid from 1.000 g/L cadmium atomic absorption standard (Instrumentation Laboratory, Lexington, MA 02173). Copper working standard, 1 mgIL, was prepared in dilute (72 mL/L) nitric acid from 10.000 g/L atomic absorption standard (Sargent Welch Co.). Lead working standard, 1 mg/L, was prepared in distilled de-ionized water from a 1.000 g/L atomic absorption standard (Fisher Scientific Co.). Manganese working standard, 1 mg/L, was prepared in dilute (72 mL/L) nitric acid from 1.000 g/L manganese atomic absorption standard (Fisher Scientific Co.).
Copper
Lead
Man9an.se
step, 40 s, 20 A, (115#{176}C) step, 40 s, 40 A, (380 #{176}C) step, 8s, 310 A, (2900 #{176}C) 0.1 3 324.7 2.2
step, 40 s, 20 A, (100#{176}C) step, 40 s, 60 A, (360 #{176}C) step, 8s, 290 A, (2400 #{176}C) 0.05 4 283.3 1.1
step, 40 s, 20 A, (115#{176}C) step, 40 s, 40 A, (380 #{176}C) step, 8s, 260 A, (2500 #{176}C) 0.1 3 279.5 1.1
0.5
0.3
0.5
Fast (1) 10 tube
Fast (1) 10 cup
Fast (1) 10 tube
Collection and PrepartionofSamples Kidney cortex specimens with normal appearance were collected at autopsy from the lower pole of the left kidney. The tissue, 1.0 to 2.0 g wet weight, was placed in an acid-washed plastic container and stored at -20 #{176}C until lyophilization. The tissue specimen (halved when duplicate assays were performed) was weighed to the nearest 0.1 mg wet weight. The outer surface was then cleaned with a pressurized stream of distilled de-ionized water to remove outer surface contamination. The tissue was transferred to an acid-washed tube, the tube was inserted in liquid nitrogen for 20 s, and the frozen specimen was then lyophilized (usually 14-16 h). We then weighed the lyophilized tissue, added 2 mL of “Ultrex” grade 70% nitric acid to it, and allowed the mixture to stand for 24 h (this step may be completed more quickly by warming the mixture to 50#{176}C). A reagent blank was prepared at this time.
SpectroscopyProcedure For cadmium analyses we used a 300-fold dilution of the nitric acid digest: a 10-L aliquot of the well-mixed digest was transferred to 3 mL of distilled de-ionized water, with use of the reverse pipetting technique (11). Both copper and manganese were analyzed for in the same 10-fold dilution, prepared by transferring 0.1 mL of well-mixed digest to 0.9 mL of distilled de-ionized water, with use of the reverse pipetting technique. We analyzed for lead in a twofold dilution of the digest, using the reverse pipetting technique for the transfer. A 10-zL aliquot of the diluted digest was transferred to the graphite cuvette of the electrothermal atomizer and analyzed with the instrument settings and conditions shown in Table 1. The average absorbance of duplicate pipettings was used (triplicate pipettings were made if duplicates differed by more than ±5%). The cadmium absorbance signal for the kidney cortex specimens, corrected for the reagent blank, was compared with values from a standard curve prepared from data on 10, 50, 75, and 100 tg/L cadmium standards in dilute (3.6 mL/L) nitric acid. For the copper analyses, a standard curve was prepared by making standard additions to the diluted digest of 0, 50, 100, 150, and 200 zg/L copper working stancLINIcAL CHEMISTRY, Vol. 27, No. 1, 1981
69
6O 40
GF 50
-
L
L
D 30 4O
C
E
20
E
2
B
#{149} Cd
A
0
a Cu
Pb oMn
A
LLL
i4o 170 200 230 20
L
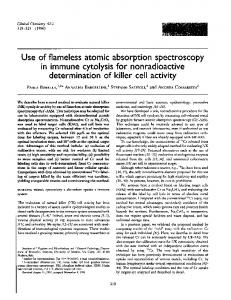
Fig. 1. Recorder tracings of a lead standard-additions analysis for a diluted digest of kidney cortex A. endogenous(31.4zg/L); B, endogenous + 50 zg/L; C. endogenous + 100 tg/L; 0, endogenous + 150 LgIL: E. triplicate analyses of another diluted kkkwy digest (36.3 g/L). Top trace is a simultaneous recording of the background with (F) the ash cycle backgroundabsorption and (0) the atomization cycle background absorption. Bottom trace,full scale 0.3 A
then subtracting theendogeneous copper concentration togive 0,50, 100, 150, and 200 g/L copper.The final standard curve for copper was made by using a composite of three such standard addition analyses. The absorbance signal for a specimen, corrected for the reagent blank, was compared with this standard curve. Lead analyses were performed by using a standard additions curve for 0, 50, 100, and 150 zg of lead per liter, prepared in a manner similar to that for the copper analyses. Similarly, manganese absorbance signals, corrected for the reagent blank, were compared with a standard curve prepared from 25, 50, 75, and 100 zg of manganese per liter in dilute (72 mL/L) nitric acid. Figure 1 shows the recorder tracings of a standard additions analysis for lead in a diluted kidney digest. dard,
EstimatedResidualBloodVolume blood in the kidney cortical by determining the hemoglobin by a cyanmethemoglobin method (12). Residual
estimated
40
tissue was roughly content of the tissue
#{149} Cd
Cu
30 E
aPb oMn
a’
Atomization Current, A Fig. 3. Effect of atomization current on the absorbance signals of cadmium, copper, lead, and manganese in a nitric acid digest of kidney cortex
Analytical Recovery Recovery of the metals was determined by use of six 0.1 -g portions of NBS Bovine Liver Standard Reference Material to which 2 mL of “Ultrex” 70% nitric acid was added. To five of the six samples we added cadmium (50 zg/L), lead (100 g/L), and manganese (50 tg/L), to give metal concentrations comparable with those in kidney cortex. Because copper concentration is substantially higher in liver than in kidney cortex, adding copper was unnecessary. The sixth sample was used to determine the endogeneous metal concentration.
Resultsand Discussion Lyophilization
Step
To check reproducibility, we made duplicate determinations for percent nonvolatile solids in 18 lyophilized kidney cortex specimens. Between-run differences in percentage of nonvolatile solids ranged from 0 to 3.4%; three-fourths of these results differed by 300 g/L being considered abnormal (17). Thus, lead contribution from residual blood would range from 0.05 to 0.11 tg/g of ly. ophilized tissues or