David B. STEPHENS, Richard E. THOMAS, John F. STANTON and Brent L. IVERSON1. The Department of Chemistry and Biochemistry, The University of Texas ...
127
Biochem. J. (1998) 332, 127–134 (Printed in Great Britain)
Polyclonal antibody catalytic variability David B. STEPHENS, Richard E. THOMAS, John F. STANTON and Brent L. IVERSON1 The Department of Chemistry and Biochemistry, The University of Texas at Austin, Austin, TX 78712, U.S.A.
We have performed a systematic variability study of polyclonal antibody catalysis by using five rabbits immunized with the same hapten. Important results from this work are the following. (1) Similarities were observed in the catalytic polyclonal antibodies derived from all five rabbits. Four of the five rabbits produced polyclonal samples that were nearly the same in terms of catalytic activity, whereas the fifth rabbit, designated as rabbit 2, displayed a somewhat higher level of catalytic activity. The catalytic activities (as kcat}kuncat) of these polyclonal samples were similar to that from the best murine monoclonal antibody that had been previously elicited by the same hapten. (2) Titre was not an accurate indicator of polyclonal antibody catalytic activity. (3) A mathematical analysis to describe a distribution of Michaelis– Menten catalysts was performed to help interpret our results. (4) Kinetic analysis indicated that the binding parameters of the different samples were remarkably homogeneous, because one or two components were all that were required to fit the on-rate and off-rate data satisfactorily. Interestingly, the most active catalytic polyclonal sample, that from rabbit 2, displayed the slowest off-
rate (so slow it could not be measured) and thus the highest overall affinity. (5) Catalytic analysis of eluted fractions of antibody from a substrate column indicated that each polyclonal sample was also relatively homogeneous in terms of catalytic parameters. The main conclusion of our study is that for this hapten–animal system, the overall catalytic immune response is relatively consistent at two levels. Consistent catalytic activity was observed between the polyclonal samples elicited in the different animals, and the elicited hapten-specific polyclonal antibodies were relatively homogeneous in terms of binding and catalytic parameters within each immunized animal. The observed similarities of the catalytic activity in the different animals is surprising, because the immune response is based on specific binding of antibodies to hapten. There is no known selective pressure to maintain consistent levels of catalytic activity. Our results can therefore be interpreted as providing evidence that for this hapten there is a fixed relationship between hapten structure and catalytic activity and}or consistent genetic factors that dominate the catalytic immune response.
INTRODUCTION
binding and catalytic properties are relatively homogeneous within the polyclonal samples from each animal. The great majority of previous catalytic antibody studies have utilized monoclonal antibodies. In contrast, antibody catalysis has been reported in polyclonal antibody preparations isolated from the sera of immunized animals [8–19]. Compared with monoclonal antibody studies, the investigation of antibody catalysis with polyclonal antibodies is substantially faster and far less expensive. Furthermore, polyclonal antibodies are representative of the entire immune response, making them well suited to systematic studies such as the present one that seek to uncover general trends involved with antibody catalysis. A picture is emerging of polyclonal antibody catalysis that indicates that high-affinity polyclonal samples are functionally surprisingly homogeneous [18–20]. Previous studies have uncovered homogeneous binding activity [20] as well as catalytic activity [15,17–19] among polyclonal antibodies isolated from within an individual immunized animal. A related question involves the relative variability of catalytic activity observed in different animals immunized with the same transition state analogue hapten. A previous polyclonal study on three sheep immunized with a phosphate hapten reported a 4-fold variation in Km and a 31-fold variation in kcat for the catalytic hydrolysis of a carbonate substrate observed at different time points ranging from 22 to 100 weeks [10]. Significantly, every one of the 13 samples isolated from these sheep displayed catalytic activity [10]. Other polyclonal studies of more than one animal uncovered similar values of apparent Km and apparent kcat when samples were taken at the same time point [17]. The present work seeks
Catalytic antibodies combine the exquisite specificity of antibody recognition with catalytic activity, affording programmable control over the catalysed reactions [1–7]. The production of catalytic antibodies generally depends on the immune system of an animal to deliver antibody binding pockets complementary to a designed hapten. Various strategies have been employed to turn antibody complementarity into catalytic activity [1,2]. Even though catalytic antibodies are products of the immune system, few experiments have been focused on understanding how the immune system generates catalysts. Such fundamental information will provide important insights into the relationships that exist between hapten structure, catalytic activity and the overall immune response. For example, important questions that have received little attention concern how much intrinsic variability exists in the binding as opposed to the catalytic parameters of the antibodies elicited by the same hapten in a given animal as well as between different animals. We report here a systematic study on five different rabbits immunized with the same hapten under the same regimen. Similarities were observed in the catalytic polyclonal antibodies derived from all five of the rabbits. In fact, the polyclonal antibodies derived from four of the rabbits were extremely similar, whereas the polyclonal antibodies derived from the fifth, designated rabbit 2, displayed a somewhat higher level of catalytic activity. A detailed kinetic analysis of the binding parameters of the individual samples, as well as a catalytic analysis of the fractions eluted from a substrate column, revealed that both the
Abbreviations used : kcat, catalytic rate constant, calculated as Vmax/2[IgG], where [IgG] is measured through quantitative inhibition experiments with hapten, and Vmax and Km are the maximum catalytic velocity and Michaelis constant respectively derived from the Lineweaver–Burk analysis ; koff, dissociation rate constant ; kon, association rate constant ; kuncat, rate of reaction in the absence of added catalyst ; KLH, keyhole limpet haemocyanin. 1 To whom correspondence should be addressed (e-mail biverson!utxvms.cc.utexas.edu).
128
Scheme 1
D. B. Stephens and others
Structure of the phosphonium hapten 1 and trityl ether substrate 2
to explore further the variability of the polyclonal catalytic immune response in rabbits. The variability of polyclonal antibody catalysis was investigated by immunizing five male New Zealand white rabbits from a heterozygous population with the triarylphosphonium hapten 1 (Scheme 1) conjugated to keyhole limpet haemocyanin (KLH). The positive charge on 1 is intended to resemble the positive charge developed during the acid-catalysed hydrolysis of trityl ether compounds such as substrate 2 [11,21]. Thus the resulting antibodies are expected to utilize primarily charge complementarity in the antibody-binding pocket to effect catalysis. The rate-limiting transition state for trityl ether hydrolysis probably involves significant carbocation character and thus a trigonal planar shape of the trityl moiety. Unfortunately, the phosphonium group of the hapten is tetrahedral, so it is unlikely that antibodies complementary to 1 accelerate the trityl ether hydrolysis reaction on the basis of geometric complementarity to the transition state. The antibody-catalysed trityl hydrolysis reaction was chosen because it offers some important advantages for the present study. In particular there is no known enzyme analogue in serum to complicate catalytic assays, and a wellcharacterized monoclonal antibody is available for comparison [21].
EXPERIMENTAL All chemicals were purchased from Aldrich Chemical Company unless otherwise noted and were used without further purification. Analytical HPLC was performed using a HewlettPackard 1090M liquid chromatograph with diode array detection and a Hewlett-Packard 79994A analytical workstation.
Tritylase hapten and substrate synthesis The tris(4-methoxyphenyl)-(6-carboxyhexyl)phosphonium bromide hapten 1 and the 4,4«,4§-trimethoxytrityl ether substrate 2 were synthesized in accordance with published procedures, and the hapten 1 was conjugated to KLH (Pierce) for immunizations, or to BSA (Sigma) for hapten-specific ELISA, as described [11].
Immunizations Five male New Zealand white rabbits (approx. 2.3 kg) from a heterozygous population (R & R Rabbitry, Pipe Creek, TX, U.S.A.) were bled to obtain control serum, then injected subcutaneously on the dorsal surface between the shoulder blades with a 0.5 ml suspension of a 1 mg}ml solution of the 1–KLH conjugate mixed with an equal volume of Freund’s complete adjuvant (Gibco Laboratories) for the initial injection or Freund ’s incomplete adjuvant for subsequent injections. The animals were immunized at 21 day intervals. All immunizations were performed with the same batch of 1–KLH by using exactly the same injection techniques. Seven days after the fifth and final injection, the rabbits were exsanguinated and this serum was used for all experiments.
Determination of total IgG concentration in serum For the direct ELISA measurement of total serum IgG concentration, a 96-well microtitre plate was prepared for serial dilution with 25 µl of a 1 mg}ml solution of BSA in PBS [10 mM phosphate}120 mM NaCl (pH 7.2)] in all but the first column of wells. Two of the wells in the first column received 50 µl of a 1 : 250 dilution in PBS of purified rabbit IgG solution of known of 14. concentration, as measured by assuming an A" % cm, " #)! The other wells in the first column received a 1 : 250 dilution of the different rabbit sera in PBS. The samples were then serially diluted 1 : 2 across the plate, which was then dried overnight at room temperature. The next morning, the plate was fixed by treatment with methanol for 10 min, then blocked for nonspecific binding by incubation with 50 µl of a 1 mg}ml BSA}PBS solution per well for 1 h at 37 °C. The blocking solution was removed, and 25 µl of a 1 : 500 dilution of goat-anti-(rabbit IgG) conjugated to horseradish peroxidase (Pierce) in 1 mg}ml BSA}PBS was applied to all wells and incubated for 1 h at 37 °C. The plate was then flushed 10 times with distilled water and the 2,2«-azinobis-(3-ethylbenzothiazoline-6-sulphonic acid) indicator solution (Pierce) was put in each well. After development for 30 min, the microtitre plate was read by an automated ELISA
Polyclonal antibody catalytic variability
129
plate reader (Bio-Tek Instruments Model EL311). The concentration of IgG present in the serum samples was derived by a comparison with the standard lanes containing the known concentration of purified IgG antibody.
small aliquot and quantification of product revealed a substitution of 25 µmol of trityl groups per ml of resin.
Immunoglobulin isolation and purification
Two buffer systems were prepared : a 0.2 M Tris binding buffer, pH 8.5, and a 0.2 M Mes elution buffer, pH 5.5. The substrate matrix material (1.0 ml) was loaded in an HR 10}10 column (Pharmacia LKB). The polyclonal sample, purified from sera by using the procedure outlined above, was loaded on the column in binding buffer, pH 8.5, at a flow rate of 0.5 ml}min. Elution with binding buffer continued (approx. 50 ml total at a flow rate of 1.0 ml}min) until all detectable protein had ceased to be eluted as monitored at 280 nm. The pH 5.5 elution buffer was then used at the same flow rate, and fractions were taken at 1 h and 12 h. The flow rate for the 12 h elution fraction was decreased to 0.01 ml}min after collection of the 1 h fraction. Dialysis with PBS and concentration by ultrafiltration was performed on each fraction, including the material that passed through the column eluted with binding buffer. Catalytic assays were performed as described previously ; bicinchoninic acid (Pierce) was used for determination of protein concentration.
Serum samples were separated from cells, 2 vol. of 60 mM sodium acetate, pH 4.0, were then added and the sample pH was adjusted to 4.8. Octanoic acid was added dropwise with constant mixing to a final concentration of 0.17 M in each sample ; mixing was continued for 30 min. The samples were centrifuged at 5000 g for 10 min, after which time the pellets were discarded and the resulting supernatants were dialysed against three changes of PBS buffer, pH 7.2, overnight at 4 °C, using 50 kDa cut-off tubing (Spectra}Por 7 ; Spectrum Medical Industries). The dialysed samples were then mixed with equal volumes of saturated (NH ) SO and stored overnight at 4 °C. Centrifugation at 3000 g %# % for 30 min yielded the crude IgG precipitate that was then dissolved in a small volume of PBS and dialysed as above. After dialysis the samples were applied to an HR10}10 column filled with Protein G-Sepharose 4 Fast Flow (Pharmacia LKB) on an FPLC system (Pharmacia LKB) with ImmunoPure Binding and Elution Buffers (Pierce). The purified IgG samples were concentrated by ultrafiltration (Centricon 30 ; Amicon). The concentrations of the purified IgG samples were determined by A . #)! All purified samples were stored at ®20 °C when not in use.
Catalytic assay The catalytic assays were performed in a total volume of 20 µl and a total IgG concentration of 19.4 µM (3 mg}ml) with substrate 2 concentrations of 25–200 µM in PBS ; all reactions were performed at 25 °C. Background reactions in identical PBS buffer were performed, both in the presence of IgG isolated by the same procedure from sera of the same rabbits taken before immunization and in the absence of IgG. Inhibition titrations were performed similarly to the rest of the catalytic reactions, except that the given amount of hapten 1 was incubated with the antibodies for 30 min before the addition of 50 µM substrate 2. Reactions for the Lineweaver–Burk studies were run for durations chosen to allow approx. 10 % conversion of substrate into products. All reactions were quenched with an equal volume of acetonitrile, and the precipitated IgG was removed by brief centrifugation. HPLC analysis of substrate and product levels was performed on a SynChropak RP-8 (SynChrom) reversephase column kept at 0 °C during the run. With a flow rate of 1 ml}min and isocratic elution with acetonitrile}water (11 : 9, v}v), the starting material (2) and the product trityl carbinol were eluted at 5.1 and 6.7 min respectively. Reaction rates were determined from peak integrations calibrated with authentic samples. All reactions for both the inhibition and Lineweaver–Burk analysis were repeated in triplicate and the results were averaged. Errors estimated from the observed S.D. were ³5 %.
Substrate chromatography
Attempted immunoaffinity purification Exsanguination sera (5 ml) from rabbits 2 and 4 were treated as published previously [22] : each was passed down a CM-Affi-Gel Blue (Bio-Rad) column (20 ml bed volume), precipitated with 50 % (NH ) SO , dialysed against PBS and then passed down a %# % hapten affinity column (1.4 ml bed volume) composed of hapten 1 covalently attached to EAH Sepharose 4B (Pharmacia), with [1-ethyl-3-(dimethylamino)propyl]carbodi-imide (Pierce) and Nhydroxysulphosuccinimide (Pierce) used as coupling reagents. Three successive elutions were performed on these hapten affinity columns with 8 ml each of : 1 M phosphate, pH 4.0 ; 1 M phosphate, pH 2.0 ; 6 M guanidinium chloride, in accordance with a published procedure [22]. All eluates were dialysed three times against PBS, pH 7.2, and concentrated by Centricon 30 (Amicon) ultrafiltration. All fractions were analysed for protein concentration by A and for binding activity by hapten-specific #)! ELISA, with an initial protein concentration of 1 mg}ml by A . #)! Immunoaffinity column elution fractions were assayed for catalytic activity by HPLC as detailed below. A monoclonal antibody, the tritylase catalytic antibody 37C4 [11], was also separated from BSA}PBS serum analogues by the same immunoaffinity media. Importantly, none of the monoclonal antibody was detected in the sample after passage through the column. Attempts were made to elute the bound antibody with a variety of conditions : low pH (0.5 M acetic acid, pH 2.3), high ionic strength (5 M LiCl), chaotropins (6 M thiocyanate), 10 % (v}v) dioxane}PBS, 25 % (v}v) ethylene glycol}3 M MgCl and a # saturated solution of free hapten 1. Column fractions were again assayed by hapten-specific ELISA for binding activity, and by HPLC for catalytic activity as detailed below.
Substrate affinity material preparation
IAsys procedure
Epoxy-Sepharose 4B (Sigma) was washed with ten times the resin volume of 0.5 M Na CO and mixed with 1 M 6-amino# $ hexanol in the same buffer for 12 h. The material was then washed with ten times the resin volume of pyridine and reacted with a 1 M solution of 4,4«,4§-trimethoxytrityl chloride in pyridine for 12 h. The product material was washed with ten times the resin volume of fresh pyridine and acetonitrile to remove all unreacted material, then dried in acuo for 24 h. Hydrolysis of a
All kinetic binding experiments were performed with an IAsys real-time kinetic binding system (Fison), with the manufacturer’s protocols. Hapten–BSA was conjugated to the carboxymethyl cuvette with [1-ethyl-3-(dimethylamino)propyl]carbodi-imide as described by the manufacturer. Total antibody concentrations of 10–20 µM were used for the association experiments, and competing free hapten maintained at 1 mM was utilized in the dissociation measurements. Associations were allowed to proceed
130
D. B. Stephens and others
until the plot of refractivity change became asymptotic, and dissociations were run until refractivity returned to preassociation levels, except in the sample from rabbit 2 in which dissociation was not observed.
RESULTS Five male New Zealand white rabbits received identical hapten–carrier}adjuvant mixtures on the same schedule ; an initial injection of hapten 1–KLH conjugate in Freund’s complete adjuvant, followed by four subsequent injections of the 1–KLH conjugate in Freund’s incomplete adjuvant at 21 day intervals. One week after the fifth and final injection, serum samples were removed from each of the five rabbits. The antigen-specific titre, determined by sandwich ELISA [23], as well as the total IgG concentration present, determined by a direct ELISA procedure, are listed in Table 1. A 6-fold and 2-fold variation in serum titres and serum total IgG concentrations respectively were observed in the five different rabbits. Polyclonal IgG antibodies were isolated from the serum samples with a three-step procedure consisting of octanoic acid precipitation, (NH ) SO precipitation and affinity chroma%# % tography with immobilized Protein G. After isolation, the antibody samples were concentrated by ultrafiltration. This procedure isolated IgG polyclonal antibodies presumably without introducing any bias with respect to antigen-binding characteristics. The catalytic activities of the purified IgG fractions were analysed with substrate 2 and an HPLC assay. The IgG antibody samples isolated from all five of the immunized rabbits displayed significant catalytic activity for the hydrolysis of substrate 2. Importantly, this activity was quantitatively inhibited with hapten 1, and a careful titration was used to find the minimum amount of 1 required to eliminate the catalytic activity in each sample. This value provided a measure of the fraction of total IgG antibody-binding pockets in the samples that were catalytic and}or bound hapten with high affinity. As listed in the bottom row of Table 1, these fractions displayed an 8-fold variation between the different animals and were qualitatively correlated with the serum antibody titre. In other words a larger amount of catalytic and}or hapten-specific antibody was generally found for the samples that also displayed a higher serum titre. The notable exception was rabbit 5, which had a lower than expected titre. Representative inhibition data are shown in Figure 1. The substrate concentration dependence of catalytic activity was measured for the different IgG preparations. A representative Lineweaver–Burk plot is shown as an inset to Figure 1. A mathematical analysis was performed to give a better understanding of the effects of a heterogeneous distribution of catalysts on such plots. If one presumes that each constituent in an ensemble of catalytic antibodies obeys Michaelis–Menten kinetics and
Table 1
Figure 1
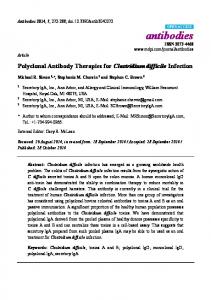
Representative inhibition and Lineweaver–Burk plots
The results presented are from the polyclonal antibody sample derived from rabbit 5. For the inhibition plot, the normalized reaction velocity is plotted as a function of hapten 1 concentration, reported as antibody-binding-site equivalents. The minimum amount of hapten required for complete inhibition is used to estimate the percentage of the polyclonal antibody sample that is catalytic and/or binds hapten with high affinity. Each reaction was performed by incubating the indicated amount of hapten 1 with 3 mg/ml total concentration of polyclonal antibodies for 30 min followed by the addition of substrate 2 to a final concentration of 50 µM in PBS, pH 7.4. The reaction was monitored as described [11]. The inset shows the Lineweaver–Burk plot for the polyclonal antibodies isolated from the same rabbit catalysing the hydrolysis of substrate 2. Each data point on the plots is an average of three independent measurements, and errors are estimated at ³5 % on the basis of the S.D. of the averaged values. The line corresponds to the best fit of the data as determined through linear regression.
behaves independently, the observed rate of reaction is given by a simple sum over the individual contributions :
0
i
1
[S] KM(i)[S]
rateobs ¯ 3kcat(i)[Ab(i)]
(1)
Here kcat(i) and Km(i) are the catalytic parameters for the ith antibody that is present in concentration [Ab(i)], and [S] is the concentration of substrate being used. However, the reciprocal rates are not additive, necessitating a different interpretation of the traditional Lineweaver–Burk plot of 1}rateobs against 1}[S]. For such a mixture of catalysts, the slope of a Lineweaver–Burk plot is given by
0 0
1 1:
KM(i) (K ¥ 1 (i)[S])# M ¯ slope ¯ # ¥(1}[S]) rate 1 3ikcat(i)[Ab(i)] KM(i)[S] 3ikcat(i)[Ab(i)]
0 1
9
(2)
The most important consequence for the present study is that
Immunological parameters determined for the polyclonal samples isolated from the five different rabbits
The hapten-specific antibody/total IgG entries refer to the fraction of hapten-specific and/or catalytic antibody in the overall polyclonal sample as determined by the hapten inhibition studies of catalytic activity. The other values were determined as described in the Experimental section. Parameter Total [IgG] in serum (mg/ml) Hapten-specific serum titre Hapten-specific antibody/total IgG
Rabbit number …
1
2
3
4
5
Average
3.9 5400 0.16
5.0 3200 0.08
7.6 1500 0.04
8.4 9000 0.31
5.1 2700 0.22
6.0 4400 0.13
131
Polyclonal antibody catalytic variability Table 2
Catalytic parameters determined for the polyclonal samples isolated from the five different rabbits
All values in the Table are termed apparent because they characterize the polyclonal sample as a whole. The apparent kcat values were obtained by dividing the observed Vmax values by the concentration of hapten-specific and/or catalytic antibodies in each polyclonal sample as determined by the hapten inhibition studies. Parameter Apparent Apparent Apparent Apparent
Rabbit number …
Vmax (µM/min) Km (µM) kcat (min−1) kcat/kuncat
this slope depends on the substrate concentration, [S]. In other words, a mixed or heterogeneous sample of Michaelis–Mententype catalysts catalysing the same reaction with different catalytic parameters should produce Lineweaver–Burk plots that exhibit some small amount of curvature as [S] is varied. Detailed mathematical simulations using the above equation reveal that this curvature is not large except with mixtures of catalysts with unrealistically large variation in kcat and Km values. The outcome is that linear Lineweaver–Burk plots can be used to derive the catalytic parameters for our polyclonal samples but they should not be considered as reliable evidence for, or against, homogeneity of catalysts within the samples. In other words, the observed error in our HPLC measurements based on the S.D. of replicate runs is ³5 %, and this uncertainty is larger than the curvature that would be present on a Lineweaver–Burk plot from a mixture of all except the most extremely different catalysts. It is therefore not surprising that in the present study all of the polyclonal antibody samples produced Lineweaver–Burk plots that were linear within error. The Lineweaver–Burk plots yielded the apparent Vmax and apparent Km values listed in Table 2. These values are termed ‘ apparent ’ to emphasize that they characterize the polyclonal samples as a whole. Use of the fractions determined in the inhibition studies to estimate the catalyst concentration permits the calculation of the apparent kcat values also listed in Table 2 [11,13–17]. In addition, the values of apparent kcat}kuncat can be calculated ; these are also listed in Table 2. For four of the samples (rabbits 1, 3, 4 and 5), the catalytic parameters are extremely similar ; the apparent Km values varied by only a factor of 3 and the apparent kcat values were all 0.02 or 0.03 min−". Interestingly, the apparent Km of 31 µM and apparent kcat of 0.02 min−" determined in a previous rabbit polyclonal study with the same hapten also fitted within these narrow ranges [11]. In contrast, the sample from rabbit 2 in the present study displayed a somewhat higher level of catalytic activity than the others ; the apparent Km and kcat values were 5 µM and 0.06 min−" respectively. It is intriguing that both of these values are somewhat out of the range observed in the other animals, displaying the highest apparent kcat and lowest apparent Km values in the study. The best murine monoclonal antibody, 37C4, elicited previously by the same phosphonium hapten displayed a Km of 31 µM and a kcat of 0.043 min−" under the same reaction conditions [21]. Thus the catalytic polyclonal antibodies in rabbits 1 and 3–5 were very similar, but slightly less efficient than the best murine monoclonal. In contrast, the entire polyclonal sample from rabbit 2 was catalytically more efficient (higher apparent kcat and}or apparent kcat}Km) than the monoclonal 37C4. It should be noted that high serum titre, commonly used to decide which mice should be used for hybridoma production, was not a good indicator of polyclonal antibody catalytic activity in our study. Rabbit 4 displayed the highest titre but below
1
2
3
4
5
Average
0.19 37 0.03 190
0.19 5 0.06 380
0.05 70 0.03 190
0.28 31 0.02 125
0.19 93 0.02 125
0.18 47 0.03 190
Table 3 Kinetic parameters determined for the different polyclonal samples with an IAsys real-time kinetic binding system, with the manufacturer’s protocols Two entries under a given rabbit indicate values determined by two parameter fits of the IAsys kinetic data. Total antibody concentrations of 10–20 µM were used for the association experiments ; competing free hapten maintained at 1 mM was utilized in the dissociation measurements. Increasing the number of parameters past those reported failed to improve the residuals of the fits. Abbreviation : n.d., none detected. Parameter kon (M−1[s−1) koff (s−1)
Rabbit number …
1
2
14 200 10 700 737 0.0132 n.d. 0.0011
3
4
5
3.05¬105 8820 8540 1780 171 366 0.0022 0.005 0.0246 0.0019 0.00141
average catalytic activity, whereas rabbit 3 showed the lowest titre but an average catalytic activity. Rabbit 2 displayed an average titre, despite having the highest observed catalytic activity. Titre was a rough indicator of quantity of haptenspecific antibody present, but not the quality of the catalysts. To the extent that these results are generalizable to other haptens, the results in Table 2 can serve as a useful calibration for comparative studies involving sets of related haptens. In other words, if different haptens are injected into different rabbits and the catalytic activities of the resulting polyclonal antibodies are compared, a more than 3-fold difference in apparent kcat is required before that difference should be considered significant. Several lines of evidence indicate that the observed catalytic activity in the polyclonal samples is the result of specific antibody catalysis and not enzymic impurities or non-specific protein effects. First, serum samples taken from the same five rabbits before injection with the hapten were subjected to the same purification routine to yield purified IgG, and they showed no titre or catalytic behaviour. That is, the rates of hydrolysis of 2 for these so-called ‘ preimmunization ’ samples, even after prolonged (at least 48 h) incubation, were identical with background rates determined under the same conditions in buffer alone. Secondly, as described, the catalysed reactions were inhibited quantitatively by hapten 1, as expected for antibody catalysis induced by immunization with this hapten. Finally, we are aware of no natural enzyme catalysis of trityl ether hydrolysis. The kinetics of binding to hapten of the different polyclonal samples were remarkably homogeneous, having only one or two predominant components, on the basis of a detailed kinetic analysis performed with an IAsys real-time binding kinetics instrument (Fison). The on-rate and off-rate data are shown in Table 3. A high concentration of hapten (1 mM) was used in the dissociation buffer to limit rebinding during the dissociation measurements. The best fits to the data were obtained with one-
132 Table 4
D. B. Stephens and others Results of substrate chromatography
Polyclonal samples from the indicated rabbits were loaded on Sepharose 4B covalently modified with trityl ether substrate with 0.2 M Tris/HCl buffer, pH 8.5. The wash fraction contained the antibodies not retained on the column at pH 8.5. The column was eluted with 0.2 M Mes buffer, pH 5.5, with a 0.01 ml/min flow rate. Fractions were collected after 1 h (column fraction 1) or 12 h (column fraction 2) and analysed for catalytic activity. Apparent kcat (min−1) Fraction Wash fraction Column fraction 1 Column fraction 2
Rabbit number …
1
2
0 0 0.01 0.12 0.001 0.13
3
4
5
23
0 0.05 0.04
0 0.03 0.03
0 0.04 0.04
0 0.13 0.08
parameter fits for kon of the sample from rabbit 2, and koff for the sample from rabbit 4. Two-parameter fits were required for the remaining samples. Increasing the number of parameters in the fits past the number shown in each case failed to improve the quality of the fit as judged by the residual values. Note that the presence of additional major components and}or a Gaussian distribution of different hapten-specific antibodies in the samples would have been easily identified in this analysis. No measurable dissociation was observed over the course of 4 h for the sample from rabbit 2. Such behaviour indicates that the entire polyclonal sample from rabbit 2 had an extraordinarily high overall affinity for hapten. Interestingly, the polyclonal antibodies from rabbit 2 were also the most efficient catalysts. To obtain a low-resolution view of the relative homogeneity of the catalytic parameters within each sample, chromatography was performed with a substrate column strategy. A trityl ether substrate was covalently attached to Sepharose 4B (Pharmacia). The polyclonal samples were loaded in an HR10}10 FPLC column packed with the trityl ether-Sepharose 4B with 0.2 M Tris}HCl, pH 8.5, a pH at which both the background and catalytic reactions were suitably slow. The column was washed with this pH 8.5 buffer until non-specific antibody was no longer eluted from the column, then the buffer was switched to 0.2 M Mes, pH 5.5, and eluted at a slow (0.01 ml}min) flow rate. Fractions were collected during the pH 5.5 elution at intervals of 1.0 and 12.0 h. The long elution times and slow flow rate were needed to accommodate the relatively slow catalysis observed with these polyclonal samples. Presumably the antibodies interacted not only with the substrate via binding in the binding pocket but also non-specifically via hydrophobic interactions. The non-specific hydrophobic interactions could have been responsible for the observed disappointing overall recoveries of IgG from samples, ranging from 40 % to 60 %. Because the trityl substrate was cleaved during the pH 5.5 elution, each substrate column could be used only once. The different fractions obtained from the substrate column were analysed for catalytic activity. It was expected that antibody catalysts with different catalytic parameters would be eluted from the column at different rates, dependent on a combination of kcat and Km. Thus the substrate columns were expected to be able to fractionate each sample on the basis of the catalytic parameters, and thereby provide the first qualitative, albeit lowresolution, measure of catalytic homogeneity within a polyclonal sample. Catalytic activity was observed in each of the fractions eluted from the substrate columns at pH 5.5. The values of kcat determined by a Lineweaver–Burk analysis are listed in Table 4. Because presumably only hapten-specific antibodies were present
in these eluted fractions, no concentration correction was used in the apparent kcat calculation. As expected, the antibodies that passed through the column at pH 8.5, before the pH 5.5 elution, displayed no catalytic activity but there was some hapten-binding activity, as determined by ELISA. A striking feature of the data in Table 4 is that the catalytic activities for the different fractions from rabbits 2–5 were the same within error. Thus, like the binding kinetics, the catalytic parameters within these polyclonal samples seem to be relatively homogeneous. Somewhat larger differences are seen when the fractions from different rabbits are compared. The values of kcat determined for these different fractions were approximately double those determined with the entire polyclonal samples (Table 2) from the same rabbit. One explanation for these findings is that perhaps the majority of catalytic activity resides in approximately one-half of the hapten-specific fraction ; it was this active fraction that was eluted from the column. The noncatalytic, yet hapten-specific, fraction might have remained bound to the substrate column during the elution. The situation was somewhat different for the sample from rabbit 1. The observed kcat values of the eluted fraction 1 was only one-half of that observed with the entire polyclonal sample. The second eluted fraction retained significantly less catalytic activity. Thus, for these hapten-specific antibodies, the most catalytic fraction was retained on the column, presumably due to some non-specific, perhaps hydrophobic, interactions. Alternatively, the catalytic activity could have been limited owing to antibody denaturation during the pH 5.5 elution. This latter explanation is consistent with the second fraction’s exhibiting significantly less catalytic activity, because it was exposed to the pH 5.5 elution conditions for a longer period. In light of the observed lack of any differences observed with different fractions from the same polyclonal samples in four out of the five cases, a control experiment was performed to verify that the substrate column could fractionate antibodies from a single sample on the basis of different catalytic activities. Equal amounts of polyclonal IgG from rabbits 2 and 3 were combined and eluted from the column. In this case, the eluted fractions showed demonstrably different catalytic activities. The first fraction eluted displayed the higher catalytic activity that was identical with that seen with the sample from rabbit 2. The second fraction collected showed noticeably lower activity, intermediate between that seen in the samples from rabbit 2 and rabbit 3. Presumably there was a more equal mixture of rabbit 2 and rabbit 3 antibodies in this second fraction, whereas the first fraction was composed primarily of the catalysts from rabbit 2. Thus the substrate column does indeed seem to separate on the basis of catalytic parameters. To the extent that this is true, the similar activities seen between the different fraction eluted from the same samples suggests there is a surprisingly high degree of homogeneity in the catalytic parameters within each sample. As an alternative to the use of immobilized substrate for chromatography, a column with hapten covalently attached to EAH Sepharose 4B was used in an effort to effect the affinity purification of the catalytic portion of the polyclonal samples. These hapten columns were loaded with polyclonal samples from rabbits 2 and 4 ; as expected, the catalytic antibodies were quantitatively retained on the column, whereas non-specific antibodies passed through. Unfortunately, attempted elution with several published procedures involving pH changes, differing ionic strength, chaotropins and various organic solvents failed to elute any active catalytic antibodies. As a control, the catalytic monoclonal antibody 37C4 was also loaded on the column ; it too was not eluted in catalytically active form. An ELISA analysis indicated that only traces of binding activity was eluted.
Polyclonal antibody catalytic variability It thus seems that, for these antibody samples, the antibody– antigen interaction cannot be dissociated under conditions that retain active antibody. This result underscores the dangers inherent in using hapten affinity chromatography when attempting to isolate the catalytic fraction of a polyclonal sample.
DISCUSSION The present study has analysed the variability of the catalytic immune response at two different levels ; within each haptenspecific polyclonal sample as well as between polyclonal samples from different animals immunized with the same hapten preparation
Homogeneity within each rabbit The real-time kinetics data indicate that the overall associations and dissociations within each hapten-specific polyclonal sample can be described by one or two parameters only. Furthermore a low-resolution picture of the catalytic parameters within each sample determined through substrate chromatography indicated that the catalytic parameters for the catalytic fraction of the polyclonal antibodies within each animal are relatively homogeneous as well. Taken together, these results paint a relatively homogeneous picture in terms of the binding and catalytic functions of the immune response inside each animal, being limited to one or two predominant components. Note that these conclusions relate to function only. There are no results in this study concerning the primary amino acid sequences for the hapten-specific antibodies present in each animal. Nevertheless a straightforward explanation for our results would be that the primary sequences of the hapten-specific antibodies display a corresponding level of relative homogeneity as well. Our observed catalytic homogeneity is consistent with previous immunological studies in which genetically restricted families have been observed in the variable-region amino acid sequences of different murine monoclonal antibodies elicited by the same hapten [24–27]. Along these same lines, five different catalytic murine monoclonal antibodies were reported that have related sequences and catalytic mechanisms [28]. Perhaps more relevant is the recent report of a rabbit polyclonal sample that displayed remarkably homogeneous kinetic binding behaviour during the course of detailed spectroscopic analysis [20]. In addition, with a more accurate assay (release of nitrophenolate) for the catalysed reaction than is possible for trityl hydrolysis reactions, linear plots of [S]} against [S] were obtained for the sheep polyclonal antibody-catalysed hydrolysis of carbonate esters. The observed linearity was taken as evidence for homogeneity within each sheep polyclonal sample [19].
Similarity between different rabbits The relative uniformity of the catalytic parameters in Table 2 is intriguing considering that the five individual immune systems were independently selecting antibodies on the basis of affinity for hapten, presumably not catalytic activity with substrate. If we assume that these results are not purely coincidental, they can provide important insights into the catalytic immune response. In particular, two explanations for the origins of antibody catalytic activity in different animals, operating alone or in combination, could explain the observed similarity of catalytic activity in the five rabbits. First, it could be that the antibodies in the different animals have unrelated amino acid sequences in the complementary determining regions. In this case, different antibodies that recognize the same hapten with high affinity provide similar
133
levels of catalytic rate enhancement because of some fixed relationship between hapten structure and the nature of the relevant transition state and}or catalytic mechanism. Such a scenario implies that catalysis is primarily derived from transition-state stabilization. Thus a given hapten design would be predicted to produce antibodies with levels of catalytic activity that are related to how closely that hapten resembles the actual rate-limiting transition state of the catalysed reaction. To be valid, comparisons should be made at similar times in the immune responses [17]. In support of this hypothesis, the best monoclonal antibody elicited by the same phosphonium hapten in a different species, namely the mouse, displayed a level of catalytic activity similar to that seen in the polyclonal antibodies of all five rabbits in the present study. In addition, phosphonate or phosphate haptens, which can be rationalized as being better mimics of actual transition states, produce reproducibly better polyclonal and monoclonal antibody catalysts than the phosphonium hapten–trityl ether substrate system studied here [15]. A second explanation for our results is that the amino acid sequences of the catalytic antibody-binding pockets in the five different animals are related, having arisen from a restricted set of germ-line variable region genes in the population. This latter genetic explanation is especially important in rabbits, in which heavy chain diversity results from recombination rather than the utilization of large numbers of gene segments. In this model, genetically related binding pockets give rise to similar catalytic activities. The different catalytic parameters displayed by rabbit 2 could be the result of somatic mutation or perhaps the use of a different predominating germ line sequence in this rabbit relative to the other animals. It is important to keep in mind that these two explanations, one based on structural considerations of the hapten and the other based on genetic concerns, are not mutually exclusive. They could both describe parts of the observed situation. The overall picture that emerges from this work is one of functional homogeneity of the rabbit polyclonal catalytic immune response within each animal, with relatively modest differences between responses in different animals. In addition, each rabbit polyclonal sample exhibits catalytic activity that is similar to the best murine monoclonal antibody elicited by the same hapten. Thus relatively inexpensive and facile rabbit polyclonal studies might be useful predictors for the level of catalytic activity that will be elicited in the most active murine monoclonals. Future work will explore the distribution of different antibody catalysts present in the different samples, as well as the genetic relationships between the amino acid sequences of the catalysts. The genetic analysis in particular will be able to distinguish between the two proposed explanations of our data. We thank Dr. Dean Appling and Dr. George Georgiou for helpful discussion. We gratefully acknowledge financial support from the Searle Foundation (Chicago Community Trust) and an NSF PYI award no. CHE-9157440 to B. L. I.
REFERENCES 1 2 3 4 5 6 7 8
Lerner, R. A., Benkovic, S. J. and Schultz, P. G. (1991) Science 252, 659–667 Schultz, P. G. and Lerner, R. A. (1993) Acc. Chem. Res. 26, 391–395 Napper, A. D., Benkovic, S. J., Tramantano, A. and Lerner, R. A. (1987) Science 237, 1041–1043 Nakayama, G. R. and Schultz, P. G. (1992) J. Am. Chem. Soc. 114, 780–781 Janda, K., Shevlin, C. G. and Lerner, R. A. (1993) Science 259, 490–493 Hsieh, L. C., Yonkovich, S., Kochersberger, L. and Schultz, P. G. (1993) Science 260, 337–339 Sinha, S. C., Keinan, E. and Reymond, J.-L. (1993) Proc. Natl. Acad. Sci. U.S.A. 90, 11910–11913 Gallacher, G., Jackson, C. S., Searcey, M., Badman, T., Goel, R., Topham, C. M., Mellor, G. W. and Brocklehurst, K. (1991) Biochem. J. 279, 871–881
134 9 10 11 12 13 14 15 16 17 18 19
D. B. Stephens and others Gallacher, G., Searcey, M., Jackson, C. S. and Brocklehurst, K. (1992) Biochem. J. 284, 675–680 Gallacher, G., Searcey, M., Jackson, C. S., Goel, R., Mellor, G. W. and Brocklehurst, K. (1993) Eur. J. Biochem. 214, 197–207 Stephens, D. and Iverson, B. L. (1993) Biochem. Biophys. Res. Commun. 192, 1439–1444 Gallacher, G. (1993) Biochem. Soc. Trans. 21, 1087–1090 Stephens, D. B., Wilmore, B. H. and Iverson, B. L. (1994) Bioorg. Med. Chem. 2, 653–658 Wilmore, B. H. and Iverson, B. L. (1994) J. Am. Chem. Soc. 116, 2181–2182 Iverson, B. L. (1995) Chemtech 25, 17–21 Wallace, M. B. and Iverson, B. L. (1996) J. Am. Chem. Soc. 118, 251–252 Shreder, K. R., Thomas, R., Wallace, M. B., Helms, E. and Iverson, B. L. (1996) Isr. J. Chem. 36, 215–220 Carter, S., Resmini, M., Simms, C., Sreedharan, S. K., Gallacher, G. and Brocklehurst, K. (1997) Biochem. Soc. Trans. 25, 86S Resmini, M., Vigna, R., Simms, C., Barber, N., Hagi-Pavli, E. P., Watts, A. B., Verma, C., Gallacher, G. and Brocklehurst, K. (1997) Biochem. J. 326, 279–287
Received 12 January 1998 ; accepted 11 February 1998
20 Shreder, K., Hariman, A. and Iverson, B. L. (1995) J. Am. Chem. Soc. 117, 2673–2674 21 Iverson, B. L., Cameron, K. E., Jahangiri, G. K. and Pasternak, D. S. (1990) J. Am. Chem. Soc. 112, 5320–5323 22 Schultz, P. G. and Jacobs, J. W. (1988) in Environmental Influences and Recognition in Enzyme Chemistry (Liebman, J. F. and Greenberg, A., eds.), pp. 303–335, VCH Publishers, New York 23 Harlow, E. and Lane, D. (1988) in Antibodies, pp. 553-612, Cold Spring Harbor Laboratory, Cold Spring Harbor, NY 24 Kabat, E. A., Wu, T. T., Reid-Muller, M., Perry, H. M., and Gottesman, K. S. (1987) Sequences of Proteins of Immunological Interest, 4th edn., National Institutes of Health, Bethesda, MD 25 Kaartinen, M., Griffiths, G. M., Markman, A. F. and Milstein, C. (1983) Nature (London) 304, 320–324 26 Berek, C. and Milstein, C. (1988) Immunol. Rev. 105, 5–26 27 Slaughter, C. A. and Capra, J. D. (1983) J. Exp. Med. 158, 1615–1634 28 Angeles, T. S., Smith, R. G., Darsley, M. J., Sugasawara, R., Sanchez, R. I., Kenten, J., Schultz, P. G. and Martin, M. (1993) Biochemistry 32, 12128–12135