Article pubs.acs.org/JPCB
Polymorphism in Cisplatin Anticancer Drug M. Paula M. Marques,*,†,§ Rosendo Valero,† Stewart F. Parker,‡ John Tomkinson,‡ and Luís A. E. Batista de Carvalho*,† †
Research Unit “Molecular Physical Chemistry”, Faculty of Science and Technology, University of Coimbra, 3004-535 Coimbra, Portugal ‡ ISIS Facility, SFTC Rutherford Appleton Laboratory, Chilton, Didcot OX 11 0QX, United Kingdom § Departament of Life Sciences, Faculty of Science and Technology, University of Coimbra, 3001-401 Coimbra, Portugal S Supporting Information *
ABSTRACT: This study reports a combined experimental and theoretical study of the solid-state polymorphism of the anticancer agent cisplatin. A complete assignment was performed for the inelastic neutron scattering (INS) and Raman spectra collected simultaneously for cisplatin, at different temperatures, with a view to obtain reliable and definitive evidence of the relative thermal stability of its α and β polymorphic species. A marked temperature-dependent hysteresis was observed, as previously reported in the literature. Theoretical calculations were carried out at the density functional theory level, using a plane-wave basis set approach and pseudopotentials. A detailed comparison with the experimental Raman and INS data showed that the α polymorph is present at the lowest temperatures, whereas the β form occurs near room temperature. Furthermore, regions of coexistence of both forms are identified, which depend on the working mode (heating or cooling). These findings imply that Raman spectroscopy allows clear identification of the α and β polymorphs at a given temperature and can unambiguously discriminate between them. Elucidation of the polymorphic equilibrium of this widely used anticancer drug is paramount for its pharmaceutical preparation and storage conditions.
■
INTRODUCTION Discovery of the antiproliferative properties of the square planar Pt(II) complex cis-diamminedichloroplatinum(II) (cisPt(NH3)2Cl2, cisplatin) by Rosenberg in the 1960s1,2 prompted its use to treat several types of cancer, such as testicular, head, and neck.3 However, acquired resistance to the drug4 and undesirable side effects including oto-, neuro-, and nephrotoxicities are severe limitations to its clinical use. In the wake of the success of cisplatin, thousands of cisplatin analogues were synthesized and evaluated with the aim of lessening or removing its toxic side effects, overcoming resistance, and providing oral bioavailability. A crucial aspect that affects the efficacy of pharmaceuticals is their polymorphism, where different crystal packing arrangements are in an equilibrium dependent on the ambient temperature and pressure. Preparation and storage conditions prior to administration are prone to affect this polymorphic equilibrium, changing properties such as density, solubility, and rate of dissolution. For cisplatin, the solid product obtained in patented production methods5,6 is reported to be the β polymorph. Until recently, only the crystal structure of the α species had been determined, through low-resolution X-ray diffraction.7 Furthermore, due to the limitations of this technique, the positions of the NH3 hydrogen atoms could not be resolved. A recently reported combined X-ray scattering and neutron diffraction study yielded the structures of both the α and β polymorphs with high resolution, including the location of the hydrogen atoms8 which is crucial in order to reveal the hydrogen-bonding network (H···Cl interactions) © 2013 American Chemical Society
within the lattice. This study also showed that cisplatin’s polymorphs easily interconvert with temperature, which was to be expected given that the α form is only 1 kJ mol−1 (calculated) more stable.8 Vibrational spectroscopy is known to be a method of choice for unmasking subtleties in the study of molecular structure, a first step in establishing quantitative structure−activity relationships (QSARs) for this kind of anticancer drug. In particular, theoretical quantum spectroscopy has emerged as an important complementary tool for the assignment of experimental spectra, to assist in the characterization of molecular structures and conformations.9,10 Considerable effort has been devoted to determining the electronic structure and conformational preferences of cisplatin,11−24 but the work addressing its vibrational frequencies and intensities has not yet attained a complete interpretation of the vibrational data.13,14,16−18,21,22,24 In fact, it was not until recently that a complete assignment of the experimental Raman17,18 and inelastic neutron scattering (INS)21 spectra of cisplatin was carried out, in studies reported by our group. However, the correspondence of these spectra with a given polymorph was not yet clear. Thus, the aim of the present work was to study the polymorphic equilibrium of cisplatin by experimental vibrational spectroscopy coupled to a unified theoretical methodology that takes into account the real periodicity of the solid Received: April 9, 2013 Revised: April 26, 2013 Published: May 3, 2013 6421
dx.doi.org/10.1021/jp403486z | J. Phys. Chem. B 2013, 117, 6421−6429
The Journal of Physical Chemistry B
Article
molecular crystals.35 In particular, this and other models used to include dispersion into DFT functionals have often enabled the reproduction of the experimental stability of different organic crystal polymorphs.36−40 For the Perdew−Zunger41 LDA approach, in turn, normconserving pseudopotentials of Von Barth−Car42 type for the H and N atoms and of Bachelet−Hamann−Schlüter43 type for Cl atoms, were used. For Pt, a plane-wave-based norm-conserving relativistic pseudopotential was built to be applied with the Perdew−Zunger LDA functional, by solving the all-electron Pt atom with the configuration (Xe) 4f14 5d8 6s2 6p0. The “atomic” code by Dal Corso, included in the Quantum Espresso distribution, was chosen, considering 10 valence electrons and a cutoff of 74 Ry for the pseudopotentials. Multiple projectors were defined for each component of the angular momentum, namely one 6s, one 6p, and two 5d. The accuracy and transferability of this pseudopotential were tested by performing zero temperature total energy calculations for the solid face-centered cubic structure of the Pt metal and for one isolated cisplatin molecule. A good agreement was found between the computed and experimental values of the lattice parameters, for both the metal and cisplatin. For the PBE and PBE-D2 approaches, Vanderbilt44 ultrasoft pseudopotentials were used for all atoms, those for Pt and Cl including a nonlinear core correction.45 The atomic positions in cisplatin were optimized starting from the experimental structure and keeping the unit cell parameters constant at these experimental values. The unit cell parameters and initial atomic positions for the two polymorphs were those reported by Ting et al.8 For ease of reference, the corresponding crystal cell parameters are comprised in Table S1 (Supporting Information). A cutoff energy of 70 Ry for the LDA calculations and 40 Ry for the PBE and PBE-D2 calculations, and a Monkhorst−Pack46 grid of 3×3×3 to sample the Brillouin zone, were found sufficient to attain convergence. The dynamical matrix was calculated at the optimized geometries using Density Functional Perturbation Theory47 and was diagonalized to obtain the vibrational normal-mode frequencies and wavenumbers. To calculate Raman activities, Si, third-order derivatives with respect to electric fields and atomic displacements were calculated.48 The Raman activities straightforwardly derived from the Quantum Espresso program cannot be compared directly with the experiment. The expression that relates the Raman differential scattering cross sections with the Raman activities is16
crystal used to record the spectra. Simultaneous INS and Raman scattering data were obtained as a function of temperature (both heating and cooling cycles), and density functional theory using a plane-wave basis set (DFT-PW) and pseudopotential approaches was applied. The use of plane waves (with periodic boundary conditions) as basis functions to solve the DFT Kohn−Sham equations is currently one of the most successful methods to deal with extended systems such as crystalline solids.
■
THEORETICAL AND EXPERIMENTAL METHODS Calculation of the Raman and INS Spectra. DFT calculations were performed using plane wave pseudopotential25 expansions as implemented in the PWscf (plane-wave selfconsistent field) code from the Quantum Espresso26 package and run on the Milipeia27 cluster. The local density approximation (LDA) functional, with norm-conserving pseudopotentials, and the Perdew−Burke−Ernzerhof (PBE)28 density functional, based on the generalized-gradient approximation (GGA), were employed with ultrasoft pseudopotentials. Additionally, a correction for van der Waals dispersion interactions was added to the PBE functional following a semiempirical scheme of Grimme,29,30 as implemented in PWscf by Barone et al.:31 PBED2, where “D2” meaning added dispersion according to the 2006 model of Grimme.30 In this approach, the total energy for a given DFT functional is represented by E DFT‐D = E DFT + Edisp
(1)
The first term on the right is the standard exchange and correlation DFT energy, and the dispersion term (when periodic boundary conditions are applied) is a sum over atom pairs in the unit cell and over lattice parameters,31 Edisp = −
1 2
∑ C6ij[∑ | rij⃗ + R⃗|−6 fdamp (| rij⃗ + R⃗|)] i,j
R⃗
(2)
where the damping function is given by −1 ⎧ ⎡ ⎛ | r ⃗ + R⃗ | ⎞⎤⎫ ⎪ ⎪ ij fdamp (| rij⃗ + R⃗|) = s6⎨1 + exp⎢ −d⎜⎜ − 1⎟⎟⎥⎬ ⎢ ⎝ r0 ⎪ ⎠⎥⎦⎪ ⎣ ⎩ ⎭
(3)
In eqs 2 and 3, ri⃗ j represents the interatomic distance vector, R⃗ are lattice vectors, C6ij are coefficients calculated for each atom pair by C6ij = (C6iC6j)1/2, s6 is a density functional-dependent scaling parameter, d is a parameter that controls the range of the damping function, and r0 are the sum of the van der Waals radii of each atom pair, i.e., r0 = r0i + r0j For the cisplatin system computed at the PBE-D2 level, the following values were used: d = 20;s6 = 0.75; for hydrogen, C6H = 0.14, r0H = 1.001; for nitrogen, C6N = 1.75, r0N = 1.452; for chlorine, C6N = 5.07, r0N = 1.639; and for platinum, C6Pt = 81.24, r0Pt = 1.611. The C6 coefficients are in J·nm6·mol−1 and the radii in Å. The sum in eq 2 is truncated when the distance |ri⃗ j + R⃗ | becomes larger than 100 Å. The LDA density functional and the norm-conserving pseudopotentials were chosen since in Quantum Espresso this is the only functional and choice of pseudopotentials that permits computation of Raman activities. The PBE GGA functional is expected to improve on the geometries and frequencies obtained with LDA and, in particular, to afford a better reproduction of the H···Cl hydrogen bond distances and energies.32,33 Inclusion of dispersion interactions through the PBE-D2 approach, even if it is one of the simplest approaches to that aim,34 has been recently found to yield accurate geometries and interaction energies in
∂σi (2π )4 h (v0 − vi)4 = Si 45 8πcvB ∂Ω i i
(4)
h and c representing the Planck constant and the speed of light, respectively, ν0 and νi standing for the frequency of the laser exciting radiation and the normal-mode frequencies, respectively, and Bi being a temperature factor, presently considered as 1. The laser frequency was set to 12 739 cm−1, corresponding to the 785 nm line of a diode laser (see below). Following eq 4, the theoretical Raman intensity was calculated according to I = C(v0 − vi)4
Si vi
(5)
where C is a constant. In order to simulate the line width of the experimental bands, an artificial and temperature-dependent uniform Lorentzian broadening was introduced using the SWizard49,50 program (revision 4.6). For the PBE and PBE-D2 functionals, the intensities were also calculated at the LDA level, 6422
dx.doi.org/10.1021/jp403486z | J. Phys. Chem. B 2013, 117, 6421−6429
The Journal of Physical Chemistry B
Article
where Q (Å−1) is the momentum transferred to the sample, vk is the energy of a vibrational mode, ui (Å) is the displacement vector of atom i in mode k, σ is the neutron scattering cross section of the atom, and αi (Å) is related to a mass-weighted sum of the displacements of the atom in all the vibrational modes. The harmonic frequencies (energies) of the vibrational modes correspond to eigenvalues, and the displacements to eigenvectors, of the dynamical matrix calculated by the DFT-PW method.
The theoretical INS transition intensities were obtained from the calculated normal-mode eigenvectors of the quantum mechanical calculations, and the spectra were simulated using the dedicated aCLIMAX51 program. Experimental Vibrational Spectroscopy. The simultaneous INS and Raman experiments were carried out at the ISIS Pulsed Neutron and Muon Source of the Rutherford Appleton Laboratory (United Kingdom), on the TOSCA spectrometer, an indirect geometry time-of-flight, high-resolution (ca. 1.25% of the energy transfer), broad-range spectrometer.52 A Renishaw inVia Raman spectrometer was used, with a 300 mW Toptica 785 nm diode laser fiber-optically coupled to a specially designed center-stick inserted in a 100 mm bore cryostat (liquid helium or closed-cycle refrigerator), as previously described.53 The laser beam was focused (upon vertical adjustment) in a spot size of ca. 50 μm diameter through a 1 mm thick sapphire window, using a 20× magnification achromatic lens (14 mm working distance). The temperature was measured using calibrated rhodium−iron resistance thermometers (accuracy ca. 5 mK) attached to both the cryostat heat exchanger and the sample can. The sample, 3 g of solid powder from Sigma (99.99%), was wrapped in a 4 × 4 cm2 vanadium foil (in order to allow collection of diffraction data), which filled the beam, and placed in a special can with a sapphire window lid. Data were recorded in the energy range from 24 to 4000 cm−1 and from 100 to 3200 cm−1, respectively, for the INS and Raman spectra. In contrast to the optical vibrational techniques, there are no selection rules for INS; thus (in principle) it yields all the fundamental vibrations and overtones as well as combination bands. In particular, combinations of internal vibrations with external modes lead to the so-called phonon wings, which increase in importance at large energy transfer.
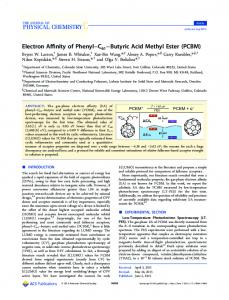
Figure 1. Structural representation of cisplatin’s polymorphs (coordinates from ref 8).
RESULTS Theoretical Geometric Parameters for α and β Polymorphs. Figure 1 shows the α and β polymorphs presently calculated for cisplatin. In both polymorphs, the cisplatin molecules organize themselves in planes along the a axis and are stacked along the c axis. The hydrogen atoms in the −NH3 groups are oriented equally in all molecules and are therefore eclipsed along the c axis between two consecutive cisplatins. The main difference between the polymorphs is in the parallel disposition of the planes along the b axis in the α polymorph, and in the alternate
since the calculation of Raman intensities for PBE functionals is not implemented in Quantum Espresso. Inelastic neutron scattering spectroscopy is particularly well suited to study materials containing hydrogen atoms, since the scattering cross section for hydrogen (1H, about 80 barns) is much larger than that for most other elements (at most ca. 5 barns). The neutron scattering cross section of an element (σ) is a characteristic of each isotope and independent of the chemical environment. During the scattering event, a fraction of the incoming neutron energy can be used to cause vibrational excitation, and the vibrational modes with the largest hydrogen displacements will dominate the spectrum. Therefore, INS will be particularly important in solids in which the molecular units are linked together by hydrogen close contacts, such as cisplatin, and the lowest-frequency vibrations are expected to be most affected. The intensity of each vibrational transition is normally expressed in terms of the so-called dynamic structure factor S*i (Q,vk), which has the simplified expression, for a given atom i, Si*(Q , vk) =
(Q 2ui2) ⎛ Q 2αi2 ⎞ ⎟ exp⎜ − 3 3 ⎠ ⎝
(6)
■
Table 1. Experimental and Theoretical Bond Lengths (Å) and Angles (deg) for α-Cisplatin
a
bond/anglea
exp value
LDA
PBE
PBE-D2
bond/anglea
exp value
LDA
PBE
PBE-D2
(Pt1)−(N2) (Pt1)−(N1) (Pt1)−(Cl1) (Pt1)−(Cl2) (N1)−(H1) (N1)−(H2) (N1)−(H3) (N2)−(H4) (N2)−(H5) (N2)−(H6) (N2)−(Pt1)−(N1) (N2)−(Pt1)−(Cl1) (N1)−(Pt1)−(Cl1) (N2)−(Pt1)−(Cl2)
2.047 2.049 2.3206 2.3216 0.990 1.047 0.936 1.046 0.988 0.976 90.62 179.71 89.18 88.55
2.029 2.027 2.3044 2.3072 1.042 1.040 1.041 1.042 1.042 1.035 90.27 178.61 89.21 88.49
2.075 2.071 2.3439 2.3449 1.034 1.031 1.031 1.032 1.033 1.028 90.91 179.76 89.19 88.14
2.089 2.087 2.343 2.336 1.035 1.031 1.033 1.032 1.035 1.031 90.01 178.54 89.11 88.54
(N1)−(Pt1)−(Cl2) (Cl1)−(Pt1)−(Cl2) (Pt1)−(N1)−(H1) (Pt1)−(N1)−(H2) (Pt1)−(N1)−(H3) (H1)−(N1)−(H2) (H1)−(N1)−(H3) (H2)−(N1)−(H3) (Pt1)−(N2)−(H4) (Pt1)−(N2)−(H5) (Pt1)−(N2)−(H6) (H4)−(N2)−(H5) (H4)−(N2)−(H6) (H5)−(N2)−(H6)
178.37 91.65 110.0 110.2 115.0 113.3 105.7 102.5 113.1 109.1 112.3 109.0 112.4 100.1
178.12 91.99 108.3 110.9 114.0 109.2 106.7 107.6 108.5 110.5 111.7 109.5 109.3 107.4
177.62 91.75 108.5 111.1 113.7 108.7 107.3 107.6 109.9 109.9 111.5 109.4 108.9 107.2
177.43 92.39 109.4 112.1 113.5 108.1 106.7 106.9 111.8 111.1 110.5 108.7 108.3 106.3
Atoms are numbered according to the atomic coordinates of the experimental structures in ref 8. 6423
dx.doi.org/10.1021/jp403486z | J. Phys. Chem. B 2013, 117, 6421−6429
The Journal of Physical Chemistry B
Article
Table 2. Experimental and Theoretical Bond Lengths (Å) and Angles (deg) for β-Cisplatin
a
bond/anglea
exp value
LDA
PBE
PBE-D2
bond/anglea
exp value
LDA
PBE
PBE-D2
(Pt1)−(N2) (Pt1)−(N1) (Pt1)−(Cl1) (Pt1)−(Cl2) (Pt2)−(N3) (Pt2)−(N4) (Pt2)−(Cl3) (Pt2)−(Cl4) (N1)−(H1) (N1)−(H2) (N1)−(H3) (N2)−(H4) (N2)−(H5) (N2)−(H6) (N3)−(H7) (N3)−(H8) (N3)−(H9) (N4)−(H10) (N4)−(H11) (N4)−(H12) (N2)−(Pt1)−(N1) (N2)−(Pt1)−(Cl2) (N1)−(Pt1)−(Cl2) (N2)−(Pt1)−(Cl1) (N1)−(Pt1)−(Cl1) (Cl2)−(Pt1)−(Cl1) (N3)−(Pt2)−(N4) (N3)−(Pt2)−(Cl3)
2.046 2.058 2.3180 2.3196 2.042 2.050 2.3143 2.3165 0.98 0.99 1.01 0.95 1.08 1.04 0.95 1.03 1.01 1.05 0.91 1.10 90.5 88.2 178.4 179.8 89.3 92.04 90.6 89.2
2.027 2.028 2.3028 2.3068 2.026 2.028 2.3065 2.3028 1.04 1.04 1.04 1.04 1.03 1.04 1.04 1.03 1.04 1.04 1.04 1.04 90.6 88.4 177.3 177.5 88.5 92.31 90.6 88.5
2.071 2.073 2.3428 2.3486 2.070 2.074 2.3407 2.3427 1.03 1.03 1.03 1.03 1.03 1.03 1.03 1.03 1.03 1.035 1.03 1.03 90.6 87.9 177.4 178.0 89.4 92.09 90.8 88.9
2.083 2.089 2.3377 2.3367 2.089 2.086 2.3290 2.3327 1.03 1.03 1.03 1.03 1.03 1.03 11.03 1.03 1.03 1.03 1.03 1.03 88.7 88.9 177.5 178.3 89.8 92.59 89.4 89.9
(N4)−(Pt2)−(Cl3) (N3)−(Pt2)−(Cl4) (N4)−(Pt2)−(Cl4) (Cl3)−(Pt2)−(Cl4) (Pt1)−(N1)−(H1) (Pt1)−(N1)−(H2) (Pt1)−(N1)−(H3) (H1)−(N1)−(H2) (H1)−(N1)−(H3) (H2)−(N1)−(H3) (Pt1)−(N2)−(H4) (Pt1)−(N2)−(H5) (Pt1)−(N2)−(H6) (H4)−(N2)−(H5) (H4)−(N2)−(H6) (H5)−(N2)−(H6) (Pt2)−(N3)−(H7) (Pt2)−(N3)−(H8) (Pt2)−(N3)−(H9) (H7)−(N3)−(H8) (H7)−(N3)−(H9) (H8)−(N3)−(H9) (Pt2)−(N4)−(H10) (Pt2)−(N4)−(H11) (Pt2)−(N4)−(H12) (H10)−(N4)−(H11) (H10)−(N4)−(H12) (H11)−(N4)−(H12)
179.3 178.7 88.1 92.05 101.2 98.8 120.8 113 112 110 121.0 104.0 110.2 107 109 104 113.6 125.3 104.3 105 106 100 118.4 100.6 116.8 120 101 99
177.3 177.5 88.6 92.29 108.3 111.0 115.0 108 108 107 109.5 111.0 115.1 108 107 106 109.5 110.4 115.1 108 108 106 108.3 111.1 114.8 108 107 107
177.8 178.1 88.1 92.24 109.0 111.2 113.9 108 108 107 109.6 110.2 111.9 109 109 107 110.2 110.6 113.7 106 109 107 109.3 111.6 110.9 109 108 108
178.6 178.0 88.5 92.14 110.9 111.3 113.0 107 107 107 110.3 111.5 111.1 109 109 106 111.3 111.6 112.7 106 108 107 110.4 112.1 110.1 108 109 107
Atoms are numbered according to the atomic coordinates of the experimental structures in ref 8.
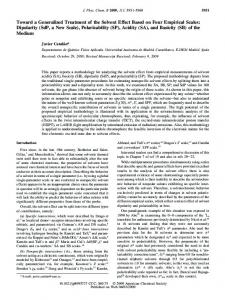
Figure 2. Experimental Raman and INS spectra (100−1750 cm−1) for cisplatin at 5 K (α species). The main bands are assigned according to ref 21. δ, ρ, and ν represent deformation, rocking, and stretching modes, while s, as, ip, and op stand for symmetric, antisymmetric, in-phase, and out-of-phase vibrations, respectively. 6424
dx.doi.org/10.1021/jp403486z | J. Phys. Chem. B 2013, 117, 6421−6429
The Journal of Physical Chemistry B
Article
disposition in the β species, which renders the unit cell about twice as large for the latter. Tables 1 and 2 summarize the experimental and theoretical (LDA, PBE, and PBE-D2) bond lengths and angles for cisplatin, for the α and β forms, respectively. In general, there is a quite good agreement between theory and experiment concerning both bond distances and angles. In particular, the Pt−N and Pt−Cl distances are accurate to within 0.02−0.03 Å, both values being underestimated at the LDA level and overestimated by the PBE and PBE-D2 methodologies. Interestingly, the PBE-predicted N−H bond lengths are about 0.01 Å shorter than those yielded by LDA. Also, for the experimental N−H distances there is a difference of about 0.1 Å between the shortest and longest ones, the theoretical values resembling the longer bonds, whereas those shorter than 1.028 Å are not reproduced by theory. The bond angles involving the heavy atoms and the metal(N−Pt−N), (N−Pt−Cl), and (Cl−Pt−Cl)as predicted by the three functionals, are consistent. They differ most by 4° and generally by no more than 2° from the experimental values. However, the angles associated with the hydrogen atoms(Pt−N−H) and (H−N−H)are not so well reproduced, with differences of up to 15° between theory and experiment. Table 3 compares the calculated and experimental H···Cl distances in both cisplatin polymorphs. These are expected to be relevant for low-frequency vibrations and should allow differentiation between the α and β species. For the LDA functional, four of these hydrogen bonds are broken in the β polymorph, with bond distances longer than 3.5 Å. Conversely, PBE and PBE-D2 are more consistent, since they are able to reproduce all the H-bonds detected experimentally with reasonable accuracy. Most of the H···Cl close contacts present in cisplatin’s polymorphs may be classified as intermediate, with H···Cl distances between 2.52 and 2.95 Å (the sum of the van der Waals radii of both atoms being 2.95 Å).54 In general, hydrogen bonds have contributions from both electrostatic and dispersion interactions,55,56 but the former tend to be more significant. Thus, it was reasonable to expect that the H···Cl distances would be better predicted by the PBE-D2 functional, at least for the weakest hydrogen close contacts. In order to quantify the agreement between theoretical and experimental H···Cl distances, the mean signed errors (MSEs) for LDA, PBE, and PBE-D2 values were calculated as −0.03, −0.05, and −0.03 Å for the α form and 0.12, −0.06, and −0.02 Å for the β species, respectively. The mean unsigned errors (MUEs), in turn, were 0.23, 0.11, and 0.08 Å for α, and 0.43, 0.13, and 0.11 Å for β, respectively. The MUE values reflect a systematic improvement when going from LDA to PBE and PBE-D2 approaches.
■
EXPERIMENTAL AND THEORETICAL RAMAN AND INS SPECTRA The experimental INS and Raman spectra at 5 K are depicted in Figure 2. An extremely good accordance was obtained between the optical (Raman) and INS spectra. At low temperature, the expected complementarity between both techniques enabled the observation and assignment of virtually all the vibrational modes. The simultaneous INS and Raman scattering study, at variable temperature, allowed a much clearer picture of cisplatin’s polymorphic equilibrium to be attained. In fact, the special configuration of the TOSCA spectrometer used for this study52 was able to probe the same sample, at identical temperature and pressure conditions, by both Raman and neutron scattering spectroscopies, without the need for sample manipulation throughout the whole experiment. Spectra were collected for one heating and one cooling sequential cycles, for the temperature
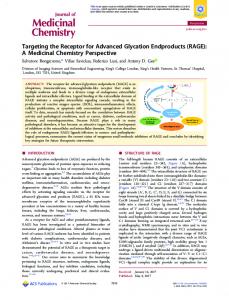
Figure 3. Experimental Raman spectra (100−1750 cm−1) for cisplatin, in the 5−360 K temperature interval, in the cooling (A) and heating (B) cycles, evidencing the α-to-β polymorphic transition and the marked hysteresis. The most affected bands are assigned according to ref 21. δ, ρ, and ν represent deformation, rocking, and stretching modes, while s, as, ip, and op stand for symmetric, antisymmetric, in-phase, and out-ofphase vibrations, respectively.
range between 5 and 360 K. The Raman results clearly reflect a marked hysteresis for this polymorphic equilibrium (Figure 3), in accordance with a previously reported single-crystal X-ray and neutron powder diffraction combined study which, however, 6425
dx.doi.org/10.1021/jp403486z | J. Phys. Chem. B 2013, 117, 6421−6429
The Journal of Physical Chemistry B
Article
Figure 4. Raman spectra (150−600 cm−1) for cisplatin. Experimental, at 5 K (A); calculated, for the α (B) and β (C) polymorphs, at the LDA (panel 1), PBE (panel 2), and PBE-D2 (panel 3) levels.
Figure 5. Experimental INS spectra (30−900 cm−1) for cisplatin, in the 30−150 K temperature interval, for the cooling cycle, evidencing the α-to-β polymorphic transition. The main bands are assigned according to ref 21. δ, ρ, ν, τ, and γ′ represent in-plane deformation, rocking, stretching, torsion, and out-of-plane deformation modes, while s and as stand for symmetric and antisymmetric, respectively.
species present. During this heating cycle, some changes already occur from 5 to 80 K, corresponding to the beginning of the α-to-β transition, not previously detected by Ting and collaborators8 who did not probe these low temperatures. It is noteworthy that at 5 K the extremely high resolution of the Raman spectra allows the observation of the four expected δa(NH3) modes, apart from two combination modes.
was carried out in a much narrower temperature range (100− 360 K).8 In particular, on cooling from 360 K (Figure 3A), the β polymorph is predominant until ca. 180 K, when a phase change to the α form takes place, in the temperature interval 150−180 K where both phases coexist. However, on heating from 5 K (Figure 3B), the α polymorph dominates up to about 298 K (coexisting with β), and only at 360 K is β the only 6426
dx.doi.org/10.1021/jp403486z | J. Phys. Chem. B 2013, 117, 6421−6429
The Journal of Physical Chemistry B
Article
Figures 4 and S1−S5 allow a detailed comparison between the experimental and predicted spectra for different theoretical methodologies and frequency ranges. Since some signals present at low temperatures are absent in the spectra obtained at the highest temperatures, only the 5 K spectra are compared with theory. The low-frequency data at low temperature (Figure 4) clearly show that the predicted spectrum for the α form is the one that best reproduces the experiment (the calculated spectra using Lorentzians with a fwhm value of 5 cm−1), especially regarding the intensities. In turn, for the highest temperature (360 K, Figure S1), it is not possible to unequivocally assign the experimental features to either the α or the β polymorphs (fwhm = 10 cm−1, Lorentzians). This ambiguity may be partly due to the fact that the PBE and PBE-D2 Raman intensities were taken as identical to the LDA ones, since it was not possible to compute those intensities with PBE nor PBE-D2 with the Quantum Espresso package.26 Cisplatin’s Raman spectra in the frequency range from 750 to 850 cm−1 are shown in Figure S2. Overall, it seems clear that the theoretical spectrum that better fits the experiment corresponds to the α polymorph. Interestingly, this is more evident in the case of the LDA functional. Figures S3 and S4 contain the Raman spectral data between 1250 and 1350 cm−1, at 5 and 360 K, respectively. At low temperature, the theoretical Raman spectrum comprises only two bands for the α form, in agreement with the experiment, and four signals for the β species. At high temperature, these coalesce into two for both polymorphs, but β displays band intensities with a higher resemblance to experiment. Finally, Figure S5 covers the frequency range 1500− 1750 cm−1, at high resolution. No relevant features are observed in this spectral region at 360 K. In the theoretical spectra, only four bands are detected for the α polymorph as compared to six to seven peaks for the β form. As the bands observed at 1607 and 1637 cm−1 are due to combination modes (1295 + 317, B1 symmetry; 1316 + 323, A1 symmetry), the best fit is clearly achieved for the α polymorph. Hence, a thorough analysis of the Raman spectra in the different frequency ranges and temperatures allows one to unambiguously conclude that cisplatin crystallizes in the α polymorph at very low temperatures (5−80 K) and in the β polymorph at room temperature and higher. At intermediate temperatures (100−298 K) both species coexist, their relative population depending on the sample’s history and follows a marked hysteresis. Overall, it is possible to accurately identify each polymorph (or mixture of polymorphs) through Raman spectroscopy at variable temperature. Regarding the experimental INS results (Figure 5), the signals were found to be considerably broadened during the cooling cycle, i.e., after having heated the sample up to 360 K, a reasonably good quality spectrum being obtained only at 150 K. At this temperature (and lower) the spectra corresponding to the heating and cooling cycles are similar, unlike those for 180 K. The increase in the Debye−Waller factor is particularly noticeable between 220 and 298 K: the broadening of the signals at 360 K renders most of the bands hardly detectable, except for ν(NPtN) and ρ(NH3). INS spectra at 5, 30, and 50 K are identical and very similar to that at 80 K, except for the intensity of the γ(ClPtN) out-of-phase feature (at 174 cm−1), which strongly increases (along with the α species) upon cooling (from 120 to 10 K), while a decrease in the intensity of the τNH3) bands is observed. In Figure 6A, one can observe that the peaks in the INS spectra are quite well reproduced by the α theoretical results for the low temperature, while the spectra at 150 K (cooling cycle) correspond to an (α+β) mixture, thus justifying the lower
Figure 6. INS spectra for cisplatin: experimental (solid line), at 5 K, α polymorph (A) and at 150 K, β polymorph (B); calculated (dashed line), at the LDA, PBE, and PBE-D2 levels.
accordance with the β calculated pattern (Figure 6B). However, despite the good frequency agreement, the relative intensities are 6427
dx.doi.org/10.1021/jp403486z | J. Phys. Chem. B 2013, 117, 6421−6429
The Journal of Physical Chemistry B
Article
Table 3. H···Cl Bond Lengths (Å) in α- and β-Cisplatin α
β H···Cla
H···Cla
H···Cla
H-bond
exp
LDA
PBE
PBE-D2
H-bond
exp
LDA
PBE
PBE-D2
H-bond
Exp
LDA
PBE
PBE-D2
(H1)···(Cl2) (H4)···(Cl1) (H6)···(Cl1) (H3)···(Cl2)b (H2)···(Cl1) (H5)···(Cl1) (H3)···(Cl2) (H6)···(Cl2) (H3)···(Cl1) (H4)···(Cl2)
2.428 2.516 2.637 3.892 2.436 2.533 2.640 2.723 2.932 2.877
2.285 2.294 2.988 3.741 2.302 2.368 2.366 2.532 2.994 3.362
2.320 2.438 2.767 3.800 2.392 2.434 2.453 2.546 2.886 3.013
2.389 2.597 2.573 3.878 2.584 2.390 2.456 2.707 2.924 2.838
(H1)···(Cl2) (H4)···(Cl1) (H6)···(Cl1) (H3)···(Cl2) (H2)···Cl3) (H5)···(Cl3) (H3)···(Cl2) (H6)···(Cl2) (H3)···(Cl1)
2.43 2.63 2.51 2.91 2.53 2.62 2.72 2.84 2.84
2.30 2.31 2.90 3.84 2.41 3.24 3.69 2.40 2.43
2.35 2.39 2.73 3.02 2.43 2.56 2.61 2.54 2.88
2.53 2.47 2.69 2.79 2.38 2.50 2.78 2.64 2.99
(H7)···(Cl4) (H10)···(Cl3) (H12)···(Cl3) (H9)···(Cl4) (H8)···(Cl1) (H11)···(Cl2) (H9)···(Cl4) (H12)···(Cl4) (H9)···(Cl3)
2.55 2.42 2.75 2.65 2.67 2.79 2.93 2.42 3.03
2.31 2.30 3.74 2.89 2.70 2.42 3.74 2.42 2.41
2.38 2.33 2.94 2.73 2.62 2.60 2.91 2.36 2.78
2.49 2.45 2.69 2.66 2.68 2.59 2.91 2.65 2.91
Atoms are numbered according to the atomic coordinates of the experimental structures from ref 8. bThe (H3)···(Cl2) distance of the α form, marked in bold, is different from that reported in ref 8, 2.974 Å.
a
■
ACKNOWLEDGMENTS The authors thank the Portuguese Foundation for Science and Technology, PEst-OE/QUI/UI0070/2011 and C2008-FCTUC UQFM v29 (R.V.), for financial support. The STFC Rutherford Appleton Laboratory is thanked for access to neutron beam facilities. The INS work was supported by the European Commission under the 7th Framework Programme through the Key Action: Strengthening the European Research Area, Research Infrastructures, contract no. CP-CSA_INFRA-20081.1.1, no. 226507-NMI3. The Advanced Computing Laboratory of the University of Coimbra is also acknowledged for allotting computer time.
not easily predicted, similar to previous studies where periodic boundary conditions were applied to compute INS spectra.21
■
CONCLUDING REMARKS
A combined experimental and theoretical study of cisplatin’s polymorphs in the solid state was carried out, with a view to elucidate the polymorphic equilibrium as a function of temperature (in the 5−360 K range). This is the first reported simultaneous Raman and INS work on a compound of pharmaceutical relevance, such as this widely used Pt(II) anticancer drug. Theoretical calculations were performed at the DFT-PW level for the α and β forms, using periodic boundary conditions to best represent the condensed phase. To the authors’ knowledge, this is the first study yielding the predicted vibrational spectra (both optical and INS) for both of cisplatin’s polymorphic species in the solid. A fairly good agreement between experimental and theoretical Raman and INS spectra (for each polymorph) was attained, enabling the detection and assignment of virtually all the molecules’ vibrational modes. The simultaneous Raman and neutron scattering data obtained as a function of temperature, under exactly the same experimental conditions, allowed an unequivocal identification of the corresponding polymorphic species, as well as of their thermal stability (since a noticeable hysteresis was found). Raman spectroscopy could be established as an easily accessible and accurate method for unequivocally assessing the polymorphic state of a particular drug sample, previously not available. This should be of the utmost relevance in pharmacology, regarding the preparation of the polymorph of interest, as well as its thorough characterization prior to solubilization and patient administration.
■
■
ASSOCIATED CONTENT
S Supporting Information *
Crystal cell parameters and Raman spectra for α- and β-cisplatin. This material is available free of charge via the Internet at http:// pubs.acs.org.
■
REFERENCES
(1) Rosenberg, B.; Vancamp, L.; Krigas, T. Inhibition of Cell Division in Escherichia coli by Electrolysis Products from a Platinum Electrode. Nature 1965, 205, 698. (2) Rosenberg, B.; Van Camp, L.; Trosko, J. E.; Mansour, V. H. Platinum Compounds: a New Class of Potent Antitumour Agents. Nature 1969, 222, 385. (3) Jamieson, E. R.; Lippard, S. J. Structure, Recognition and Processing of Cisplatin-DNA Adducts. Chem. Rev. 1999, 99, 2467− 2498. (4) Rabik, C. A.; Dolan, M. E. Molecular Mechanisms of Resistance and Toxicity Associated with Platinating Agents. Cancer Treat. Rev. 2007, 33, 9−23. (5) Kaplan, M. A.; Granatek, A. P. U.S. Patent US 432239, 1982. (6) Murata, T.; Ishikawa, K.; Kogawa, O.; Iwata, K. World Patent WO 98/29344, 1999. (7) Milburn, G. H. W.; Truter, M. R. The Crystal Structures of cis- and trans-Dichlorodiammineplatinum(II). J. Chem. Soc. A 1966, 1609− 1616. (8) Ting, V. P.; Schmidtmann, M.; Wilson, C. C.; Weller, M. T. Cisplatin: Polymorphism and Structural Insights into an Important Chemitherapeutic Drug. Angew. Chem., Int. Ed. 2010, 49, 9408−9411. (9) Schmitt, M.; Popp, J. Raman Spectroscopy at the Beginning of the Twenty-First Century. J. Raman Spectrosc. 2006, 37, 20−28. (10) Nolasco, M. M.; Amado, A. M.; Ribeiro-Claro, P. J. A. Computationally-Assisted Approach to the Vibrational Spectra of Molecular Crystals: Study of Hydrogen-Bonding and Pseudo-Polymorphism. ChemPhysChem 2007, 7, 2150−2161. (11) Basch, H.; Krauss, M.; Stevens, W. J.; Cohen, D. Electronic and Geometric Structures of Pt(NH3)22+, Pt(NH3)2Cl2, Pt(NH3)3X, and Pt(NH3)2XY (X, Y = H2O, OH−). Inorg. Chem. 1985, 24, 3313−3317. (12) Carloni, P.; Andreoni, W.; Hutter, J.; Curioni, A.; Gianozzi, P.; Parrinello, M. Structure and Bonding in Cisplatin and other Pt(II) Complexes. Chem. Phys. Lett. 1995, 234, 50−56.
AUTHOR INFORMATION
Corresponding Author
*E-mail:
[email protected],
[email protected]. Notes
The authors declare no competing financial interest. 6428
dx.doi.org/10.1021/jp403486z | J. Phys. Chem. B 2013, 117, 6421−6429
The Journal of Physical Chemistry B
Article
(13) Pavankumar, P. N. V.; Seetheramulu, P.; Yao, S.; Saxe, J. D.; Reddy, D. G.; Hausheer, F. H. Comprehensive Ab Initio Quantum Mechanical and Molecular Orbital (MO) Analysis of Cisplatin: Structure, Bonding, Charge Density, and Vibrational Frequencies. J. Comput. Chem. 1999, 20, 365−382. (14) Wysokińsky, R.; Michalska, D. The Performance of Different Density Functional Methods in the Calculation of Molecular Structures and Vibrational Spectra of Platinum(II) Antitumor Drugs: Cisplatin and Carboplatin. J. Comput. Chem. 2001, 22, 901−912. (15) Zhang, Y.; Guo, Z.; You, X.-Z. Hydrolisis Theory for Cisplatin and its Analogs Based on Density Functional Studies. J. Am. Chem. Soc. 2001, 123, 9378−9387. (16) Michalska, D.; Wysokiński, R. The Prediction of Raman Spectra of Platinum(II) Anticancer Drugs by Density Functional Theory. Chem. Phys. Lett. 2005, 403, 211−217. (17) Amado, A. M.; Fiuza, S. M.; Marques, M. P. M.; Batista de Carvalho, L. A. E. Conformational and Vibrational Study of Platinum(II) Anticancer Drugs: cis-Diamminedichloroplatinum(II) as a Case Study. J. Chem. Phys. 2007, 127, 185104/1−10. (18) Fiuza, S. M.; Amado, A. M.; Marques, M. P. M.; Batista de Carvalho, L. A. E. Use of Effective Core Potential Calculations for the Conformational and Vibrational Study of Platinum(II) Anticancer Drugs. Cis-Diamminedichloroplatinum(II) as a Case Study. J. Phys. Chem. A 2008, 112, 3253−3259. (19) Dans, P. D.; Crespo, A.; Estrin, D. A.; Coitiño, E. L. Structural and Energetic Study of Cisplatin and Derivatives: Comparison of the Performance of Density Functional Theory Implementations. J. Chem. Theory Comput. 2008, 4, 740−750. (20) de Berredo, R. C.; Jorge, F. E. All-Electron Double Zeta Basis Sets for Platinum: Estimating Scalar Relativistic Effects on Platinum(II) Anticancer Drugs. J. Mol. Struct.: THEOCHEM 2010, 961, 107−112. (21) Batista de Carvalho, L. A. E.; Marques, M. P. M.; Martin, C.; Parker, S. F.; Tomkinson, J. Inelastic Neutron Scattering Study of PtII Complexes Displaying Anticancer Properties. ChemPhysChem 2011, 12, 1334−1341. (22) Gao, H.; Xia, F.; Huang, C.; Lin, K. Density Functional Theory Calculations on the Molecular Structures and Vibration Spectra of Platinum(II) Antitumor Drugs. Spectrochim. Acta A 2011, 78, 1234−1239. (23) Paschoal, D.; Marcial, B. L.; Lopes, J. F.; De Almeida, W. B.; Dos Santos, H. F. The Role of the Basis Set and the Level of Quantum Mechanical Theory in the Prediction of the Structure and Reactivity of Cisplatin. J. Comput. Chem. 2012, 33, 2292−2302. (24) Dodoff, N. I. A DFT/ECP-Small Basis Set Modelling of Cisplatin: Molecular Structure and Vibrational Spectrum. Comput. Mol. Biosci. 2012, 2, 35−44. (25) Pickett, W. E. Pseudopotential Methods in Condensed Matter Applications. Comput. Phys. Rep. 1989, 9, 115−197. (26) Gianozzi, P.; et al. QUANTUM ESPRESSO: A Modular and Open-Source Software Project for Quantum Simulations of Materials. J. Phys.: Condens. Matter 2009, 21, 395502/1−19. (27) http://www.uc.pt/lca/ClusterResources/Milipeia/ (28) Perdew, J. P.; Burke, K.; Ernzerhof, M. Generalized Gradient Approximation Made Simple. Phys. Rev. Lett. 1996, 77, 3865−3868. (29) Grimme, S. Accurate Description of van der Waals Complexes by Density Functional Theory Including Empirical Corrections. J. Comput. Chem. 2004, 25, 1463−1473. (30) Grimme, S. Semiempirical GGA-Type Density Functional Constructed with a Long-Range Dispersion Correction. J. Comput. Chem. 2006, 27, 1787−1799. (31) Barone, V.; Casarin, M.; Forrer, D.; Pavone, M.; Sambi, M.; Vittadini, A. Role and Effective Treatment of Dispersive Forces in Materials: Polyethylene and Graphite Crystals as Test Cases. J. Comput. Chem. 2009, 30, 934−939. (32) Ireta, J.; Neugebauer, J.; Scheffler, M. On the Accuracy of DFT for Describing Hydrogen Bonds: Dependence on the Bond Directionality. J. Phys. Chem. A 2004, 108, 5692−5698. (33) Rao, L.; Ke, H.; Fu, G.; Xu, X.; Yan, Y. Performance of Several Density Functional Theory Methods on Describing Hydrogen-Bond Interactions. J. Chem. Theory Comput. 2009, 5, 86−96.
(34) Klimeš, J.; Michaelides, A. Perspective: Advances and Challenges in Treating van der Waals Dispersion Forces in Density Functional Theory. J. Chem. Phys. 2012, 137, 120901/1−12. (35) Bučko, T.; Hafner, J.; Lebègue, S.; Á ngyán, J. G. Improved Description of the Structure of Molecular and Layered Crystals: Ab Initio DFT Calculations with van der Waals Corrections. J. Phys. Chem. A 2010, 114, 11814−11824. (36) Li, T.; Feng, S. Empirically Augmented Density Functional Theory for Predicting Lattice Energies of Aspirin, Acetaminophen Polymorphs, and Ibuprofen Homochiral and Racemic Crystals. Pharm. Res. 2006, 23, 2326−2332. (37) Neumann, M. A.; Leusen, F. J. J.; Kendrick, J. A Major Advance in Crystal Structure Prediction. Angew. Chem., Int. Ed. 2008, 47, 2427− 2430. (38) Chan, H. C. S.; Kendrick, J.; Leusen, F. J. J. Predictability of the Polymorphs of Small Organic Compounds: Crystal Structure Predictions of Four Benchmark Blind Test Molecules. Phys. Chem. Chem. Phys. 2011, 13, 20361−20370. (39) Lehmann, C. W. Crystal Structure Prediction − Dawn of a New Era. Angew. Chem., Int. Ed. 2011, 50, 5616−5617. (40) Pedone, A.; Presti, D.; Menziani, M. C. On the Ability of Periodic Dispersion-Corrected DFT Calculations to Predict Molecular Crystal Polymorphism in Para-Diiodobenzene. Chem. Phys. Lett. 2012, 541, 12−15. (41) Perdew, J. P.; Zunger, A. Self-Interaction Correction to DensityFunctional Approximations for Many-Electron Systems. Phys. Rev. B 1981, 23, 5048−5079. (42) del Corso, A.; Baroni, S, .; Resta, R.; de Gironcoli, S. Ab Initio Calculation of Phonon Dispersions in II-VI Semiconductors. Phys. Rev. B 1993, 47, 3588−3592. (43) Bachelet, G. B.; Hamann, D. R.; Schlüter, M. Pseudopotentials that Work: From H to Pu. Phys. Rev. B 1982, 26, 4199−4228. (44) Vanderbilt, D. Soft Self-Consistent Pseudopotentials in a Generalized Eigenvalue Formalism. Phys. Rev. B 1990, 41, 7892−7895. (45) Louie, S. G.; Froyen, S.; Cohen, M. L. Nonlinear Ionic Pseudopotentials in Spin-Density-Functional Calculations. Phys. Rev. B 1982, 26, 1738−1742. (46) Monkhorst, H. J.; Pack, J. D. Special Points for Brillouin Zone Integrations. Phys. Rev. B 1976, 13, 5188−5192. (47) Gianozzi, P.; Baroni, S. In Handbook of Materials Modeling, Vol. 1: Methods and Models; Yip, S., Kaxiras, E., Marzari, N., Trout, B., Eds.; Springer: Berlin, 2005; pp 195−214. (48) Lazzeri, M.; Mauri, F. First-Principles Calculation of Vibrational Raman Spectra in Large Systems: Signature of Small Rings in Crystalline SiO2. Phys. Rev. Lett. 2003, 90, 036401/1−4. (49) Gorelsky, S. I. SWizard; University of Ottawa, Canada, 2010; http://www.sg-chem.net/. (50) Gorelsky, S. I.; Lever, A. B. P. Electronic Structure and Spectra of Ruthenium Diimine Complexes by Density Functional Theory and INDO/S. Comparison of the Two Methods. J. Organomet. Chem. 2001, 635, 187−196. (51) Ramirez-Cuesta, A. J. aCLIMAX 4.0.1, the New Version of the Software for Analyzing and Interpreting INS Spectra. Comput. Phys. Commun. 2004, 157, 226−238. (52) http://www.isis.stfc.ac.uk/ (53) Adams, M. A.; Parker, S. F.; Fernández-Alonso, F.; Cutler, D. J.; Hodges, C.; King, A. Simultaneous Neutron Scattering and Raman Scattering. Appl. Spectrosc. 2009, 63, 727−732. (54) Aullón, G.; Bellamy, D.; Orpen, A. G.; Brammer, L.; Bruton, E. A. Metal-Bound Chlorine often Accepts Hydrogen Bonds. Chem. Commun. 1998, 6, 65+-3−654. (55) Steiner, T. The Hydrogen Bond in the Solid. Angew. Chem., Int. Ed. 2002, 41, 48−76. (56) Thanthiriwatte, K. S.; Hohenstein, E. G.; Burns, L. A.; Sherrill, C. D. Assessment of the Performance of DFT and DFT-D Methods for Describing Distance Dependence of Hydrogen-Bonded Interactions. J. Chem. Theory Comput. 2011, 7, 88−96.
6429
dx.doi.org/10.1021/jp403486z | J. Phys. Chem. B 2013, 117, 6421−6429