www.nature.com/scientificreports
OPEN
received: 26 October 2015 accepted: 04 May 2016 Published: 23 May 2016
Population dynamics of Agriophyllum squarrosum, a pioneer annual plant endemic to mobile sand dunes, in response to global climate change Chaoju Qian1,2, Hengxia Yin1,2, Yong Shi1,2, Jiecai Zhao1,2, Chengliang Yin1,2, Wanyin Luo3, Zhibao Dong3, Guoxiong Chen1, Xia Yan1,4, Xiao-Ru Wang5 & Xiao-Fei Ma1 Climate change plays an important role in the transition of ecosystems. Stratigraphic investigations have suggested that the Asian interior experienced frequent transitions between grassland and desert ecosystems as a consequence of global climate change. Using maternally and bi-parentally inherited markers, we investigated the population dynamics of Agriophyllum squarrosum (Chenopodiaceae), an annual pioneer plant endemic to mobile sand dunes. Phylogeographic analysis revealed that A. squarrosum could originate from Gurbantunggut desert since ~1.6 Ma, and subsequently underwent three waves of colonisation into other deserts and sandy lands corresponding to several glaciations. The rapid population expansion and distribution range shifts of A. squarrosum from monsoonal climate zones suggested that the development of the monsoonal climate significantly enhanced the population growth and gene flow of A. squarrosum. These data also suggested that desertification of the fragile grassland ecosystems in the Qinghai-Tibetan Plateau was more ancient than previously suggested and will be aggravated under global warming in the future. This study provides new molecular phylogeographic insights into how pioneer annual plant species in desert ecosystems respond to global climate change, and facilitates evaluation of the ecological potential and genetic resources of future crops for non-arable dry lands to mitigate climate change. Climate change plays an important role in the transition of ecosystems1–3. Compared with other ecosystems, desert ecosystems might be much more sensitive to climate change because these environments feature low biodiversity and high environmental stress4,5. One of the most striking results of climate change in the Northern Hemisphere during the Cenozoic era is the desertification of the Asian interior, which can be traced to ~22 Ma6. In the Quaternary period, temperate deserts experienced large-scale expansions in marine isotope stage 16 (MIS 16, ~0.6–0.7 Ma) and in the last glacial maximum (LGM, ~21–18 Ka)7. During MIS 16, the maximum global ice volume and successive Kunhuang Movement induced the intensification of the East Asian Winter Monsoon (EAWM), thus resulting in the substantial expansion of the deserts in marginal monsoonal regions7,8. In the LGM period, the dominant EAWM induced the expansion of deserts in marginal monsoonal zones compared with the deserts in non-monsoonal regions7,9. However, in the warmer period of the Holocene Optimum (HO, ~9–5 Ka), when the East Asian Summer Monsoon (EASM) dominated, due to the reduced wind velocity and increased 1 Key Laboratory of Stress Physiology and Ecology in Cold and Arid Regions, Gansu Province, Department of Ecology and Agriculture Research, Cold and Arid Regions Environmental and Engineering Research Institute, Chinese Academy of Sciences, Lanzhou 730000, Gansu, China. 2University of Chinese Academy of Sciences, Beijing 100049, China. 3Key Laboratory of Desert and Desertification, Cold and Arid Regions Environmental and Engineering Research Institute, Chinese Academy of Sciences, Lanzhou 730000, Gansu, China. 4Key Laboratory of Eco-hydrology and of Inland River Basin, Cold and Arid Regions Environmental and Engineering Research Institute, Chinese Academy of Sciences, Lanzhou 730000, Gansu, China. 5Department of Ecology and Environmental Science, Umeå University, Umeå 90187, Sweden. Correspondence and requests for materials should be addressed to X.Y. (email:
[email protected]) or X.-F.M. (email:
[email protected])
Scientific Reports | 6:26613 | DOI: 10.1038/srep26613
1
www.nature.com/scientificreports/ precipitation, all the sandy lands were completely stabilised, and their desert ecosystems fully transitioned into grassland ecosystems, by contrast, deserts far from the monsoonal zone contracted only 5% to 20%, as compared with their present ranges9. These phenomena indicate that monsoonal climate oscillations have frequently affected the vegetation transition of desert ecosystems and the temporal-spatial evolution of deserts in the Asian interior. Although perennial plants have a high tolerance to climate change10, our new molecular phylogeographic data have demonstrated that the East Asian monsoon system (EAMS) could have significantly affected intraspecific divergence, gene flow and regional population dynamics of Reaumuria soongarica, a constructive shrub of temperate desert ecosystems11. However, we did not detect a significant relationship between the demographic history of this perennial desert plant and the spatial-temporal evolution of these temperate deserts. Because the demographic history of annual plants from diverse ecosystems should be more sensitive to environmental changes12–14, the population dynamics of the annual plants from the desert ecosystem might respond more rapidly to changes in the monsoonal climate. Therefore, a thorough demographic investigation and distribution range reconstruction and prediction for annual plants may provide an ideal platform to fully understand how desert ecosystems have responded to climate change in the past and to predict how these environments will respond in the future. Agriophyllum squarrosum, also called “sand rice”, is a typical annual pioneer desert plant of the Chenopodiaceae family15,16. Among its sister species, only A. squarrosum is widely distributed in the mobile sand dunes of all deserts and sandy lands across the Asian interior (http://foc.eflora.cn) and can survive extremely high temperatures and drought and tolerate sand burial17–19. Because the withered plants reduce wind velocity by at least 90% and are a rich source of carbon and nitrogen in these poor soil environments, A. squarrosum plays a critical role in sustaining and restoring fragile desert ecosystems20,21. Furthermore, although this plant grows in infertile and sandy soils, A. squarrosum has a high concentration of nutrients in its seeds and a high biomass, thus making this plant an invaluable candidate species for domestication as a food and forage crop for dry lands22, More interestingly, the colonisation of A. squarrosum is often accompanied by the shifting of sand dunes, thus providing an ideal model to understand the historical dynamics of desert ecosystems in response to climate change. In the present study, we investigated the distribution of species-wide standing genetic variation in A. squarrosum by using two marker systems: five maternally inherited chloroplast DNA (cpDNA) fragments23 and a bi-parentally inherited nuclear ribosomal internal transcribed spacer (nrITS) region. By reconstruction of genealogical networks, profiling of population dynamics and prediction of shifts in the distribution range of this annual pioneer desert plant, we sought to address the following questions: i) whether the colonisation of A. squarrosum is associated with palaeo-climate changes; ii) whether and how the monsoonal climate affects the genetic differentiation, gene flow and population dynamics of A. squarrosum, as the habitat of this plant is characterised by mosaic deserts and the high mobility of sand dunes, both of which are frequently affected by monsoonal climate change; and iii) how the distribution range of this annual pioneer plant has shifted and will shift in the future in response to global climate change. From a molecular phylogeographic perspective, this endeavour will shed light on the current understanding of how desert ecosystems respond to changes in monsoonal climates, thus facilitating the evaluation of the ecological potential and germplasm resources of breeding candidate crops to manage the food supply in harsh environments.
Results
Geographical structure of ribotypes and chlorotypes. The nrITS and five cpDNA fragments of a total
of 188 ingroup individuals from 46 populations and 7 outgroup individuals were sequenced. A total of 586 bp of nrITS alignment and 35 ribotypes were obtained, which were defined by 29 polymorphic sites, including one indel (Supplementary Table S1). Based on the concatenated chloroplast supergene of 3,401 bp, we identified 13 chlorotypes, defined by 18 polymorphic sites, including 2 indels (Supplementary Table S2). The overall average haplotype diversity (Hd) of A. squarrosum populations was 0.691 on nrITS and 0.646 on cpDNA, respectively. The average overall nucleotide diversity (pi) was 0.0025 on nrITS and much lower on cpDNA (pi = 0.0004) (Supplementary Table S1 and S2), consistently with the selfing of this annual plant, thus confirming the reliability of this sampling strategy. Among all populations, population BEJX from group GuD (for detailed information about this group, refer to Methods) harboured the highest genetic diversity (pi = 0.0044 on nrITS and 0.0014 on cpDNA, respectively). The genealogies and frequencies of the 35 ribotypes and 13 chlorotypes were projected onto a geographical map (Fig. 1a,b, respectively). The ancestral ribotype of R16, which directly connected with the outgroup ribotypes, was restricted to population BEJX from the GuD group. The other ribotypes can be distinctly separated into the following clades: clade I, clade II and clade III, in which the ribotypes from clade I were fixed in the East group. The ribotypes from clade II covered all deserts and sandy lands, even reaching the southern edge of the QTP and eastern edge of the East sandy lands. In comparison, the area that the ribotypes from clade III covered was much smaller and was limited to the deserts from the western, central and northeastern QTP (Fig. 1a). Similarly to the ribotypes, the ancestral chlorotype C9 was also restricted to the population BEJX. The main chlorotypes were separated into 4 clades: clade i, clade ii, clade iii and clade iv (Fig. 1b). Interestingly, the geographical distributions of the chlorotypes from clades i and ii were similar to those of the ribotypes from clades II and III, respectively. The genealogical topologies and geographic distribution patterns of the two markers strongly suggested that A. squarrosum originated from the Gurbantunggut desert and subsequently experienced at least two waves of colonisation into other deserts. This pattern of the origination and dispersal of A. squarrosum was well supported by the data obtained from the RASP analysis (Supplementary Fig. S1).
Time estimation of the divergence and diversification of lineages. Based on the calibrated mutation rates of the nrITS and chloroplast supergene, BEAST analysis indicated that the genera Corispermum and Agriophyllum might have diverged at ~3.74 Ma (95% HPD, 2.1 – 5.9 Ma) based on nrITS and ~3.77 Ma (95%
Scientific Reports | 6:26613 | DOI: 10.1038/srep26613
2
www.nature.com/scientificreports/
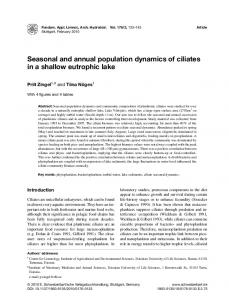
Figure 1. The distribution of haplotypes in the geological locations and Median-joining networks of the haplotypes in the 46 A. squarrosum populations examined in this study. (a) nrITS ribotype distribution and genealogy topology; (b) cpDNA chlorotype distribution and genealogy topology. Population locations are presented as small black spots on the map, and the slice size is proportional to the frequency of the haplotypes (different clades). The colours of the pie-diagrams correspond to clades of the network genealogies at the bottom of the two maps. The sizes of the circles in the genealogy topology correspond to the frequency of each haplotype; each number near the line represents the mutational steps interconnecting two haplotypes, and only the steps over two mutations are listed. The red dotted line represents the first wave of colonisation, the green dashed line represents the second wave of colonisation, and the blue dashed line represents the third wave of colonisation. These figures originated from the software packages of Diva-GIS version 7.5.0 (http://www.divagis.org/), and then modified by Q,C.J. with CorelDraw X6 (Corel Corporation, Ottawa, Canada).
HPD, 1.9 – 7.2 Ma) based on cpDNA, respectively (points “A” and “a” in Fig. 2b,c), thus suggesting that this calibration was objective. The two species of genus Agriophyllum might have diverged at ~2.7 Ma based on cpDNA (95% HPD, 1.3–4.8 Ma) and ~2.9 Ma based on nrITS (95% HPD, 1.7–4.4 Ma; point “b” and “B” in Fig. 2b,c), associated with the formation of the modern Asian monsoon and the rapid growth of glaciers in the Pliocene24,25. The age of the crown nrITS lineages of A. squarrosum could be dated to ~1.6 Ma; however, the ages of the crown main lineages of the chlorotypes were much later than the ribotypes, which did not begin diversifying until ~1.16 Ma (points “C” and “c” in Fig. 2b,c). Consequently, the ages of the crowns of the three main clades of ribotypes were dated to ~1.23 Ma, ~1.10 Ma and ~0.67 Ma, respectively (points “D”, “E” and “F” in Fig. 2b).
Population differentiation and gene flow. The PERMUT results for nrITS revealed that the total genetic
diversity of all populations was much higher than the average diversity within populations (HT = 0.750 and HS = 0.569, respectively), consistently with the significant phylogeographic structure (Nst > Gst, p-values = 0.019, Table 1). The hierarchical molecular variation analysis (AMOVA) also supported the significant phylogeographic structure of A. squarrosum, as the genetic differentiation among the five groups was higher than that among the populations within groups (FCT = 0.288, FSC = 0.154, FST = 0.397, Table 2). Although a significant phylogeographic structure could not be detected on maternal inherited cpDNA (Table 1), the pairwise genetic differentiation was significantly high between the East and other groups (Table 3, Supplementary Fig. S2). However, we observed the lowest FST between the QTP group and the Central group but the highest FST among populations within the QTP group on cpDNA (0.133 and 1.000, respectively). When the East group was included, the results of the Mantel test revealed significant correlations between the genetic differentiation and physical distance on both nrITS and cpDNA (r = 0.489, p