Alkiviadis F. Bais, Stylianos Kazadzis, Katerina Garane, Natalia Kouremeti, ... depending on the incidence angle and the characteristics of the diffuser. For the 11 ... of broadband measurements and model calculations ... of these parts can be seen in the device picture of ... sists of a quartz arc tube filled with metal atoms and.
Portable device for characterizing the angular response of UV spectroradiometers Alkiviadis F. Bais, Stylianos Kazadzis, Katerina Garane, Natalia Kouremeti, Julian Gröbner, Mario Blumthaler, Gunther Seckmeyer, Ann R. Webb, Tapani Koskela, Peter Görts, and Josef Schreder
This paper introduces a device that was developed to measure the angular response of UV spectroradiometers in the field. This device is designed to be used at the operating position of spectroradiometers; thus the derived angular response also includes any effects from imperfect leveling of the diffuser and corresponds to the actual operational angular response. The design and characterization of the device and the results from its application on 11 different spectroradiometers that operate at different European UV stations are presented. Various sources of uncertainties that were identified result in a combined uncertainty in determining the angular response, which ranges between approximately 1.5% and 10%, depending on the incidence angle and the characteristics of the diffuser. For the 11 instruments, the error in reporting the diffuse irradiance ranges between 2% and ⫺13%, assuming isotropic distribution of the downwelling radiances. © 2005 Optical Society of America OCIS codes: 120.0120, 120.4570, 120.6200.
1. Introduction
Instruments for measuring solar irradiance on a horizontal surface suffer from nonideal angular response of their entrance optics, known also as “cosine error.”
Alkiviadis F. Bais, Stylianos Kazadzis, Katerina Garane, and Natalia Kouremeti are with the Laboratory of Atmospheric Physics, Aristotle University of Thessaloniki, Campus Box 149, 54124 Thessaloniki, Greece. Julian Gröbner performed this research when he was at the European Commission Joint Research Centre, Environment Institute for Health and Consumer Protection, Physical and Chemical Exposure Unit, I-21020, Ispra, Italy. He is now at Physikalisch-Meteorologisches Observatorium Davos, PMOD兾WRC, Dorfstrasse 33, 7260 Davos, Switzerland. Mario Blumthaler is with the Institute of Medical Physics, Medical University of Innsbruck, 44 Muellerstrasse, A-6020 Innsbruck, Austria. Gunther Seckmeyer is with the Institute of Meteorology and Climatology, University of Hannover, Herrenhaeuser Str 2, 30419 Hannover, Germany. Ann R. Webb is with the University of Manchester, P.O. Box 88, Manchester M60 IQD, United Kingdom. Tapani Koskela is with the Finnish Meteorological Institute, P.O. Box 503, 00101 Helsinki, Finland. Peter Görts is with the Laboratory of Radiation Research, National Institute of Public Health and the Environment (RIVM), P.O. Box 1, 3720 BA Bilthoven, The Netherlands. Josef Schreder is with Calibration Measurement Software Solutions (CMS), Austria. Received 22 March 2005; revised manuscript received 26 May 2005; accepted 30 May 2005. 0003-6935/05/337136-08$15.00/0 © 2005 Optical Society of America 7136
APPLIED OPTICS 兾 Vol. 44, No. 33 兾 20 November 2005
Often the angular response error introduces large systematic uncertainties in the measurements, and its magnitude may vary from a few percent up to 10%⫺15%, depending on the measurement conditions and the characteristics of each particular system.1–3 This type of error imposes great difficulties when comparing data sets from different instruments, but also when analyzing time series of individual instruments, since its magnitude varies with atmospheric and exposure conditions (e.g., with solar zenith angle). Ideally, the manufacturer of the input optics of a radiometer or of a spectroradiometer should provide a directional response that follows the cosine of the angle of the incident radiation with respect to a horizontal surface.4 There are two approaches for diminishing the uncertainty due to the angular response error: First, one may replace the input optics with another, of better response.5 However, for the majority of the instruments such a task would lead to substantial development and changes in their design. During the past decade, several UV spectroradiometers that used optical fiber bundles were equipped with input optics of close to ideal cosine response.6 A similar technique was used successfully to modify the diffuser of a Brewer spectroradiometer.7 Second, correction factors may be applied to the measured irradiances. Although various methods have been developed4,8,9 for determining those correction factors, for all of them
knowledge of the following three parameters is required: (a) The angular response of the entrance optics of the instrument. This can be determined in the laboratory, but requires an appropriate facility, especially developed for this purpose, and experienced personnel, both of which are usually unavailable at each UV monitoring site. For measuring the angular response, a lamp is rotated about the center of the instruments’ diffuser, maintaining the same distance at all positions. It is assumed that the lamp output is stable throughout the experiment and is unaffected by the rotation.10 Alternatively, and if the instrument design permits, the diffuser is rotated while the lamp is fixed. (b) The fraction of the direct (or diffuse) irradiance with respect to global irradiance as a function of wavelength for each condition of measurement. This can be determined either from model calculations,4 or from actual measurements. Quasi-simultaneous measurements of global irradiance and the direct component were used in Ref. 9, while Ref. 11 used diffuse irradiance measurements performed by broadband filter radiometers. Finally, a combination of broadband measurements and model calculations may also be used to determine this fraction.12 (c) The radiance distribution over the entire upper hemisphere, which in combination with the angular response is used to determine the diffuse part of the angular response error.9 Although this distribution can be measured in the field,13 such measurements are practically not available for each single spectrum because they require specialized instrumentation and usually take much more time to be completed compared to an irradiance scan. Therefore in most cases the radiation field is assumed isotropic, although it has been shown that this assumption is usually not valid, especially at wavelengths longer than 330 nm (Refs. 1, 13, and 14). In the framework of project QASUME [Quality Assurance of Spectral Ultraviolet Measurements in Europe through the development of a transportable unit (http://lap.phys.auth.gr/qasume)] a device for the measurement of the angular response was developed at the Laboratory of Atmospheric Physics, Aristotle University of Thessaloniki. This device is part of the traveling unit that was developed under this project, which comprises a portable spectroradiometer, developed at JRC Ispra,15 and its portable calibrator. This unit is used for providing quality assurance to spectral UV measurements performed at European monitoring sites. The angular response device provides measurements of the angular response of almost any spectroradiometer at its operating position, without the necessity of moving it into the laboratory. The device therefore was designed to be robust and unaffected by weather conditions (except rain or very strong winds). In the following we present a description of the angular response device, the results from its testing
phase, the measurement principles that are used, and the results from measurements on various spectroradiometers during the 2002–2004 site visits of the QASUME transportable unit.
2. Determination of the Angular Response of a Radiometer
As mentioned above, to measure the angular response of a radiometer (either spectral or broadband) it is necessary to illuminate the diffuser of the instrument with radiation incident from various angles with respect to normal, and to measure the irradiance corresponding to each position with the instrument under study. The error arising from the imperfect angular response, f共, , 兲, for a given wavelength, , an angle of incidence, , and an azimuth angle , can be calculated from10 f(, , ) ⫽
冉
冊
E(, , ) ⫺ 1 ⴱ 100%, E(, ⫽ 0) cos
(1)
where E共, , 兲 is the measured spectral irradiance when the beam is incident from an angle , and E共, ⫽ 0兲 is the spectral irradiance at the same distance with the irradiance from a point source resulting in a beam perpendicular to the diffuser plane. For Eq. (1) to be valid, it is assumed that the lamp emission is stable when the irradiances E共, , 兲 and E共, ⫽ 0兲 are measured. In the case of a broadband radiometer, the spectral irradiance is substituted by the irradiance, E共, 兲, integrated over the spectral range of the radiometer, and the angular response, f共, 兲, refers to the angular response over the specific wavelength range. It is important to keep the distance of the light source from the diffuser constant, but also to expose the diffuser to the same part of the bulb since lamps usually do not emit radiation uniformly. The latter criterion requires rotation of the lamp if the radiometer cannot be rotated (as, for example, bulky instruments, such as the Brewers). However, rotation of the lamp may alter its emittance, since the geometry of the filament and its thermal balance change. In addition, lamp stability may be compromised if it is rotated while hot, yet it is impractical to switch the lamp off during each rotation. An alternative device is the use of fiber optics to direct the light and change the angle of incidence without moving the lamp. This alternative was chosen for the device presented here.
3. Description of the Device
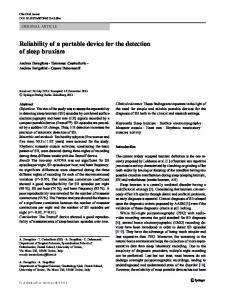
The device consists mainly of three parts: (a) the optical part, which comprises the light source, a lamp output monitor, and a fiber bundle; (b) the mechanical part, which comprises a rotating arm and its adjustable mount; and (c) the control electronics. Most of these parts can be seen in the device picture of Fig. 1. 20 November 2005 兾 Vol. 44, No. 33 兾 APPLIED OPTICS
7137
optical center of the focusing lens, and is therefore slightly tilted so that its axis passes through the center of the lens. To avoid overheating the lamp housing, the heated air is removed from the interior of the housing with an electric fan. Baffles are used to minimize the light exiting from the housing to protect the operators from the high intensity of the emitted UV-B and UV-C radiation. Concerns for the ozone that is produced by the lamp were proved to be unjustified, since measurements with an ozone analyzer showed concentrations of approximately 80 ppb at the exit of the fan, 30 ppb at 6 cm distance, while the ozone concentration was close to the detection limit of 1 ppb at distances longer than 40 cm. B.
Fig. 1. The angular response device that was developed in the frame of the QASUME project.
A.
Optical Part
From Eq. (1) it is evident that at large angles of incidence the irradiance is much smaller than at normal incidence (e.g., by a factor of more than 5 at 18°), therefore the radiation source to be used should result in a sufficiently strong signal, even at very large angles of incidence. The quartz halogen lamps that are usually used as calibration sources emit low spectral radiant power in the UV-B. Thus a more powerful lamp, a 400 W metal halide, was selected for this device to ensure adequately strong signals at both short wavelengths and large angles. The lamp consists of a quartz arc tube filled with metal atoms and halides. This type of lamp operates at high pressures and high temperatures 共⬃1000 °C). The lamp is mounted in a metal housing and the emitted light is collected by a convex lens that is focused on the input of a 1.8 m long bundle of fibers arranged in a rectangle cross section, positioned parallel to the lamp’s long axis. The other end of the fiber has a circular cross section 共3 mm diam) and is used to illuminate directly the diffuser of the instrument being tested. Close to the first bundle is a second fiber bundle, thinner, and 30 cm long, which directs a small portion of the emitted light onto a silicon carbide UV photodetector that is sensitive in both the UV-B and UV-A parts of the spectrum. The detector is used to monitor the stability of the radiation from the lamp, and eventually to correct the irradiance measurements. The second fiber is positioned off the 7138
APPLIED OPTICS 兾 Vol. 44, No. 33 兾 20 November 2005
Mechanical Part
The circular end of the long fiber is fixed at the free end of a rotating aluminum arm and at a distance of 60 cm from the center of rotation. The fiber end is interchangeable with a pen laser, which is used during the setup for the alignment of the arm and zeroing of the stepper motor. The arm is mounted on a semicircular gear 共36 cm diam) that is connected to a stepper motor with a gear of 1 cm diam. The stepper motor and the rotation axis of the arm are mounted on a platform that can be moved horizontally on a Y-shaped plate following a channel engraved on the plate. This way the platform can be moved into two orthogonal positions allowing the measurements to be performed at two different planes without major preadjustments. Fine adjustments of the platform position can be effected with the aid of two horizontal micrometric stages. Finally the plate is mounted on a robust tripod that is also used for the vertical adjustment of the system, with the aid of a laser beam that passes through the center of the axis of rotation. The setup procedure comprises the following stages: (a) The Y-shaped plate is leveled and the tripod height is adjusted so that the horizontal laser beam, exiting from the axis of rotation, is parallel to the surface of the diffuser and touches its top surface. (b) The platform is adjusted horizontally so that the laser beam passes through the center of the diffuser. (c) With the aid of the vertical laser beam the arm that holds the fiber is postioned vertically, as in Fig. 1. At this position the stepper motor is reset to zero steps. Usually the three steps are repeated for fine adjustment of the device. It should be noted that the leveling of the device is done independently of the instrument to be tested. Thus it may also help uncover errors in the leveling of the diffuser of the instrument. C.
Control Electronics
The control electronics comprise the driver and the user interface of the stepper motor and a data logger
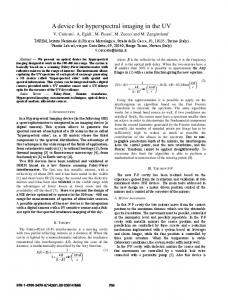
Fig. 2. Spectral irradiance of a 400 W metal halide lamp measured at a distance of 47 cm (solid curve). The dashed curve corresponds to the irradiance of a 1000 W DXW QH lamp measured at the same distance. The vertical arrows mark the wavelengths that were used for the angular response measurements.
for the photodetector. The stepper motor controls the rotation of the arm, which can be set at any angle between ⫺90° and ⫹90° from the vertical, which is the zero position for the motor. The arm can move in steps of 0.05°, which also defines the precision in setting the incidence angle. Usually the angular response measurements are performed at steps of 5° or 10°, although smaller steps can be selected if necessary. The photodetector is sampled every second and the samples are stored in the data logger, which can hold up to 90 min of data, a period sufficient to complete an angular response measurement. If more time is required the stored data can be uploaded to a PC through a serial connection and the memory is cleared to accept another 90 min of data. During this procedure the data logging is interrupted. Since every instrument is controlled by different software, it was impossible to design an interface to synchronize the control of the device with the irradiance measurements. Therefore the angular response characterization requires the intervention of an operator to repeatedly set the arm at the desired angle and then to initiate the corresponding irradiance measurement. 4. Testing and Characterization of the Device
During the development phase of the angular response device; a series of tests were performed to ensure optimum performance. Particular attention was paid to the stability of the radiation emitted by the lamp and to the irradiance at the diffuser of the spectroradiometer. The spectrum of a metal halide lamp has a marked structure with many emission lines, compared to the smooth spectrum of a 1000 W quartz halogen lamp, but on the other hand it is superior with respect to the radiated power (see Fig. 2). Because of this structure, the accuracy of the wavelength setting of a spectroradiometer on which the device is used becomes very important for achieving highly accurate spectral ir-
radiance measurements. If the wavelength on which the measurement is performed coincides with a peak in the lamp’s spectrum, small wavelength shifts that may occur during the measurement procedure may significantly affect the measurements. Therefore, although the radiant power of the lamp is higher at wavelengths where peaks occur, for the angular response measurements a region with smooth variation of the emitted irradiance with wavelength would be more suitable. Based on Fig. 2, the wavelengths 308, 318, 325, 332, 348 and 411 nm were identified as the most suitable for angular response measurements. Because the metal halide lamp is very strong, at these wavelengths the irradiance at distances of approximately 50 cm is adequate even for the least sensitive instruments. Nevertheless other wavelengths coinciding with strong emission lines of the lamp can be chosen when the device is used on a spectroradiometer with very good wavelength stability. When the beam irradiates the diffuser from overhead, all parts of the diffuser are at the same distance from the lamp; and if the beam is not homogeneous the spectroradiometer senses the average irradiance from all parts. When the beam arrives at a slant angle, some parts of the diffuser are closer to the light source, while others are further away. If the beam were homogeneous and the distance from the point source would be large enough, the average irradiance on the diffuser would be the same as the irradiance at its center. The latter would not be true if the beam were inhomogeneous. To test the homogeneity of the beam exiting from the fiber bundle, a photodiode was used to map the intensity of the beam at various points on a plane perpendicular to the beam located at different distances from the fiber exit. The arm was set vertically, directing the beam to the nadir, and the photodiode was moved horizontally at various distances from the center of the beam in two orthogonal directions. The diameter of the aperture of the photodiode was 8.5 mm. The results are presented in Fig. 3, which shows the irradiance measured by the photodiode normalized with the irradiance measured at the center of the beam as a function of the horizontal distance from the center. The optimum vertical distance is the one resulting in the ratio closest to unity, and was found at 47 cm. At this distance the change in irradiance at horizontal distances within 10 mm from the center of the beam is less than 3%, increasing to 5% for distances within 20 mm. The asymmetry around the central point that appears at the two longer distances originates mostly from the imperfect alignment of the photodiode under the fiber due to the lack of a suitable setup to more accurately control these measurements. But even if it were real, its effect on the angular response measurements would not be very small for the size of the commonly used diffusers. Figure 4 shows a mapping of the normalized intensity of the beam over an area of 24 ⫻ 24 mm at the optimum distance of 47 cm from the fiber exit. The 20 November 2005 兾 Vol. 44, No. 33 兾 APPLIED OPTICS
7139
Fig. 3. Testing the homogeneity of the beam exiting from the fiber bundle on a plane located at different distances from the lamp; each distance is represented by different symbols. The plot shows for each plane the irradiance measured at various distances from the center of the vertical beam, normalized by the irradiance measured at the center of the beam.
superimposed concentric circles correspond to three of the most common diffusers used in UV spectroradiometers. The maximum difference of the irradiance at the edge of a diffuser relative to the irradiance at its center is 0.5%, 1.5%, and 3.5%, respectively, for a Bentham, a Schreder (type J1002), and a standard Brewer diffuser. The error arising from the nonhomogeneous beam can be expressed by the percentage difference of the irradiance integrated over the whole diffuser to the integral of the irradiance of an ideal homogeneous beam, which for the three diffusers is, respectively, 0.3%, 0.6%, and 1.5%. Especially for a Brewer diffuser, the inhomogeneity of the beam may produce a much smaller uncertainty, as the most sensitive part of the diffuser is located near its center where the beam is more homogeneous. The Brewer diffuser has a diameter about 3 times larger than the diameter of the active central part.16,17
Fig. 5. (Upper panel) Variation from the mean of the radiant power of the lamp during an angular response measurement session, as monitored by the photodetector at 1 Hz. (Lower panel) Variability of the spectral irradiance of the lamp, inferred from 20 consecutive spectra measured by the Brewer MKIII spectroradiometer at Thessaloniki, in a spectral region that contains the wavelengths (marked with arrows) that were used for angular response measurements. The shaded envelope is defined by the 5 and 95 percentiles.
The stability of the radiation emitted by the lamp during an angular response measurement session can be assessed from the photodetector measurements. The upper panel of Fig. 5 shows the variability of the signal of the photodetector during one measurement of the angular response. After the first warming up period, which lasts for about 15⫺ 20 min, the lamp is stable to within ⫾1% (relative standard measurement uncertainty 1) with occasional peaks that could reach ⫾2%. Using a MKIII Brewer spectroradiometer, the lamp’s spectrum between 318 and 343 nm in 1 nm steps was measured repeatedly to assess independently its stability and wavelength reproducibility. This spectral region was chosen because of the reduced spectral structure (see Fig. 2). From the deviations of the 20 spectra from their average, which are shown in the lower panel of Fig. 5, it appears that the relative standard measurement uncertainty (with respect to radiometric stability) is on the average ⫾2.5%. The arrows mark the wavelengths that were selected for the measurement of the angular response. 5. Uncertainties from the Operation of the Device
Fig. 4. A two-dimensional representation of the homogeneity of the beam exiting from the fiber bundle on a plane located 47 cm from the lamp. The concentric circles correspond to three of the most commonly used diffusers. 7140
APPLIED OPTICS 兾 Vol. 44, No. 33 兾 20 November 2005
The uncertainties that are introduced in the angular response measurement can be separated into those emerging from the individual characteristics of the device, which were discussed in Section 4, and those introduced by the operational procedures. As mentioned before the uncertainties from the imperfect homogeneity of the beam may be up to 1.5% for a relatively large diffuser of 12 mm radius (Brewer).
In some instruments it may happen that the center of the diffuser, which is used as the reference for adjusting the axis of rotation of the arm, does not coincide with the actual optical axis of the instrument. Although its effect in the irradiance measurements under the sky is insignificant, it causes major difficulties when determining the angular response. Such a problem was detected while using the device on two Brewer spectroradiometers. This problem could be minimized by choosing the point where the actual optical axis intersects the diffuser as a reference point. Another approach would be to realign the fore optics of the instrument. The resulting uncertainties in the angular response determination from the above sources of errors are summarized in Table 1 for different angles of the incident beam and for two of the most commonly used types of diffusers. Finally, from a sequence of measurements in the laboratory, we have found that the reproducibility of the angular response measurement is better than ⫾2%.
Fig. 6. The estimated error in the angular response measurement as a function of the incident angle of the beam, resulting from different errors in setting the angle. Positive errors correspond to angles larger than the nominal.
Instabilities in lamp output may lead to uncertainties of up to 2%; however, these can be detected by the photodetector and to a large extent corrected. Therefore the remaining uncertainties after correcting the lamp’s radiative power should be below 1%. The accuracy in setting the incidence angle of the beam is very important for correctly determining the angular response. Figure 6 shows the expected uncertainty when determining the angular response for different settings as a function of the angle of incidence. The error corresponding to 0.05°, which is the precision of the device in setting the angle, is the least expected, if all other parts of the device operate ideally. However, we cannot exclude errors arising from the imperfect alignment of the device with the diffuser, which may lead either to the wrong estimation of the actual incidence angle or to variation of the actual distance between the end of the fiber and the diffuser at different incidence angles. Although the alignment procedure is rather straightforward, the overall accuracy depends also on how it is applied by the operator. We estimate that the uncertainty in centering the laser beam with the diffuser, and in adjusting the height of the device so that the axis of the rotating arm coincides with the top surface of the diffuser, is at most ⫾3 mm.
6. Results and Conclusions
Before being deployed in field operation, the device was used to measure the angular response of the QASUME traveling spectroradiometer, which is a Bentham DM150 equipped with a Schreder type J1002 diffuser. The measured angular response was compared with the one provided by the manufacturer, and the results are shown in Fig. 7 for three wavelengths 共318, 348, and 411 nm). The observed differences are on the order of 2% for incidence angles smaller than 60°, increasing to 5% for larger angles, up to 85°, both falling within the uncertainty limits presented in Table 1. The combined standard measurement uncertainty for the angular response device at incident angles below 50° is ⬃2%, increasing to ⬃10° for 80°. During the three years 共2002⫺2004) of the field operation of the QASUME traveling unit, the angular response device was used to measure the angular response of 11 spectroradiometers, which are listed in Table 2. Figures 7 and 8 show the angular response error for each of the instruments. For the 10 instruments and the traveling spectroradiometer of QASUME, Table 2 shows the error, e, according to
Table 1. Percentage of Uncertainties (1) in the Angular Response Determination Resulting from Different Sources of Errors Given (Where Applicable) For Two Types of Diffusers
Angle of Incidence (degrees) Source of Uncertainty
30°
50°
70°
80°
Stability of the lamp Homogeneity of the beam (J1002兾Brewer) Vertical alignment (⫾3 mm)a Horizontal alignment (⫾3 mm)a Combined standard measurement uncertainty (Schreder J1002兾Brewer)
1 0.6兾1.5 1 0.5 1.6兾2.1
1 0.6兾1.5 1 1 1.8兾2.3
1 0.6兾1.5 2.5 5 5.7兾5.9
1 0.6兾1.5 6 8 10.1兾10.2
a
Maximum expected. 20 November 2005 兾 Vol. 44, No. 33 兾 APPLIED OPTICS
7141
Fig. 7. The angular response of the Bentham DM150, as measured with the angular response device at three wavelengths: 318, 348, and 411 nm. The angular response provided by the manufacturer of the instrument’s diffuser at 320 nm is also superimposed.
DIN 5032, (Ref. 18), for their diffusers and the angular response error for the diffuse irradiance, fD, which were calculated using the measured angular responses. The uncertainty in the calculated fD, which results from the propagation of the uncertainties of Table 1, is also shown. This error is defined as the ratio of the diffuse irradiance, as it would have been measured by the particular instrument, to the diffuse irradiance that would have been measured if its angular response were ideal.9 In both cases it is assumed that there is no contribution from the direct solar irradiance and that the diffuse irradiance is isotropic. Although this parameter corresponds to a rather unusual case, it may be regarded as an indicator of the overall angular response error of an instrument. In fact, the contribution of the direct irradiance results in an overall angular response error that is either smaller or larger than fD, depending on the solar zenith angle, aerosols, and the ozone, because all these factors control the fraction of the direct to global irradiance.4,9 The results of Table 2 suggest that there may be large differences in UV irradiances measured by two instruments that have nothing to do with location and climate, and are caused only by different angular
Fig. 8. Angular response error, f [Eq. (1)], of 10 spectroradiometers measured with the angular response device during the site visits of the QASUME traveling unit. The different colors indicate measurements at different planes, giving an indication of the azimuthal response of the diffusers.
responses. For example, if the traveling spectroradiometer and the Polish Brewer MKII were operating synchronously at the same place, they would report the solar irradiance under cloudy conditions differently by approximately 15%. This would have not been appreciated if the angular response of this in-
Table 2. List of Instruments Whose Angular Response Error was Measured with the Portable Angular Response Device, and the Corresponding DIN 5032 Error and Angular Response Error for the Diffuse Irradiance fD
Institute Location Date
Instrument
ECUV-JRC, Ispra, Italy, May 2002 Un. Granada, Spain, July 2004 Hradec Kralove, Czech Republic, June 2004 LAP, Thessaloniki, Greece, October 2003 FMI, Sodankyla, Finland, July 2003 CNRS, Rome, Italy, September 2003 Warzaw, Poland, June 2004 LAP, Thessaloniki, Greece, October 2002 FMI, Jokioinen, Finland, June 2003 Lampedusa, Italy, May 2004 INTA, El Arenosillo, Spain, July 2004
Bentham Bentham Brewer MKIV Brewer MKII Brewer MKII Brewer MKII Brewer MKII Brewer MKIII Brewer MKIII Brewer MKIII Brewer MKIII
7142
APPLIED OPTICS 兾 Vol. 44, No. 33 兾 20 November 2005
ID B5503 — 098 005 037 067 064 086 107 123 150
DIN 5032 (%)
fD (%)
fD 1 Uncertainty (%)
1.6 2.7 10.8 11.0 10.3 8.1 12.5 7.2 7.9 9.7 5.4
2.4 0.5 ⫺10.9 ⫺11.9 ⫺10.4 ⫺8.1 ⫺12.7 ⫺7.1 ⫺8.0 ⫺9.8 ⫺5.4
3.0 2.9 3.0 3.0 3.0 3.1 2.9 3.2 3.1 3.0 3.2
strument had not been measured by the traveling unit of QASUME, or otherwise. It appears from Table 2 that fD is smaller for the double-monochromator Brewer spectroradiometers (type MKIII) compared to the single-monochromator Brewers (type MKII). Thus in the absence of direct solar radiation the irradiance measured by a MKIII is underestimated by approximately 5%⫺10% compared to 8%⫺12% for a MKII Brewer. Under clear skies the above errors would change by ⫾1.5% to ⫾2.5% for a MKIII and by ⫾2.5% to ⫾3% for a MKII Brewer, depending on the wavelength and the specific angular response of each instrument. Current technology allows the construction of entrance optics for UV spectroradiometers with less than 2% angular response errors. However, we should not neglect the fact that a large number of spectroradiometers deployed worldwide are equipped with entrance optics with relatively poor angular responses. For most of them, e.g., Brewer spectroradiometers, it is practically impossible or too expensive to implement modifications for improving their angular responses, and even if it happens, all previously recorded data would still suffer from this error. Therefore the operators of the currently operating spectroradiometers are urged to measure the angular response of their instruments and to apply the appropriate corrections to increase the quality of their measurements. Actually, for the submission of UV data into the European UV database (http://ozone2. fmi.fi/uvdb/), scientists are strongly encouraged to submit cosine error corrected data. Devices such as the ones presented here may help in this respect, especially if they can be used to measure the angular response at the operational position of the instrument. Measuring the angular response in situ with a portable device has the advantage of finding the real operational response, which includes effects from imperfect leveling of the diffuser. This work is supported by the European Commission through the project QASUME (contract EVR1-CT-2001-40011). We thank the scientists from the UV monitoring sites of Hradec Kralove (M. Janouch), Granada (L. Alados-Arboledas), Sodankyla (E. Kyro), Rome (A. Siani), Warsaw (J. Jaroslawski), Lambedusa (A. G. di Sarra), and El Arenosillio (J. M. Vilaplana Guerrero) for the chance to use the angular response device at their institutes. References 1. J. Gröbner, M. Blumthaler, and W. Ambach, “Experimental investigation of spectral global irradiance measurement errors due to a nonideal cosine response,” Geophys. Res. Lett. 23, 2493–2496 (1996). 2. M. Blumthaler and A. Bais, “Cosine corrections of global sky measurements,” in The Nordic Intercomparison of Ultraviolet and Total Ozone Instruments at Izana, October 1996, Meteo-
3.
4.
5.
6.
7.
8.
9.
10.
11.
12.
13.
14.
15.
16.
17.
18.
rological Publications 3b, B. Kjeldstad, B. Johnsen, and T. Koskela, eds. (Finnish Meteorological Institute, Helsinki, 1997), pp. 161–172. A. F. Bais, “Absolute spectral measurements of direct solar ultraviolet irradiance with a Brewer spectrophotometer,” Appl. Opt. 36, 5199 –5204 (1997). G. Seckmeyer and G. Bernhard, “Cosine error correction of spectral UV irradiances,” in Atmospheric Radiation, K. H. Stamnes, ed., Proc. SPIE, 2049, 140 –151 (1993). G. Bernhard and G. Seckmeyer, “New entrance optics for solar spectral UV measurements,” Photochem. Photobiol. 65, 923– 930 (1997). J. G. Schreder, M. Blumthaler, and M. Huber, “Design of an input optic for solar UV-measurements,” in Protection Against the Hazards of UVR (Internet Photochemistry and Photobiology, 1998), http://www.photobiology.com/UVR98/schreder/ index.htm. J. Gröbner, “Improved entrance optic for global irradiance measurements with a Brewer spectrophotometer,” Appl. Opt. 42, 3516 –3521 (2003). R. L. McKenzie, P. V. Johnston, M. Kotkamp, A. Bittar, and J. D. Hamlin, “Solar ultraviolet spectroradiometry in New Zealand: instrumentation and sample results from 1990,” Appl. Opt. 31, 6501– 6509 (1992). A. F. Bais, S. Kazadzis, D. Balis, C. S. Zerefos, and M. Blumthaler, “Correcting global solar ultraviolet spectra recorded by a Brewer spectroradiometer for its angular response error,” Appl. Opt. 37, 6339 – 6344 (1998). G. Seckmeyer, A. Bais, G. Bernhard, M. Blumthaler, C. R. Booth, P. Disterhoft, P. Eriksen R. L. McKenzie, M. Miyauchi, and C. Roy, “Instruments to measure solar ultraviolet irradiance. Part 1: Spectral instruments,” Global Atmospheric Watch Report 125 (World Meteorological Organisation, Geneva, 2001), p. 30. U. Feister, R. Grewe, and K. Gericke, “A method for correction of cosine errors in measurements of spectral UV irradiance,” Sol. Energy 60, 313–332 (1996). T. Landelius and W. Josefsson, “Methods for cosine correction of broadband UV data and their effect on the relation between UV irradiances and cloudiness,” J. Geophys. Res. 105, 4795– 4802 (2000). M. Blumthaler, J. Gröbner, M. Huber, and W. Ambach, “Measuring spectral and spatial variations of UVA and UVB sky radiance,” Geophys. Res. Lett. 23, 547–550 (1996). S. Kazadzis, A. F. Bais, D. Balis, C. S. Zerefos, and M. Blumthaler, “Retrieval of downwelling UV actinic flux density spectra from spectral measurements of global and direct solar UV irradiance,” J. Geophys. Res. Atmos. 105, 4857– 4864 (2000). J. Gröbner, J. Schreder, S. Kazadzis, A. F. Bais, M. Blumthaler, P. Görts, R. Tax, T. Koskela, G. Seckmeyer, A. R. Webb, and D. Rembges, “A travelling reference spectroradiometer for routine quality assurance of spectral solar ultraviolet irradiance measurements,” Appl. Opt. 44, 5321–5331 (2005). W. Josefsson, T. Koskela, and E. Kyro, “Directional responsivity of Brewer spectroradiometers,” presented at the European Conference on Ultraviolet Radiation, Helsinki, Finland, 1997. K. Lakkala, “A decade of spectral UV measurements at Sodankyla,” Ph.D. dissertation in Meteorology, Department of Physical Sciences, University of Helsinki, Helsinki, 2001. German Institute of Standardization, DIN 5032, Teil 1, Deutsche Normen Series (Beuth, Berlin, 1978).
20 November 2005 兾 Vol. 44, No. 33 兾 APPLIED OPTICS
7143