Potential Renewable Bioenergy Production from Canadian Agriculture Tingting Liu1,2, Brian McConkey1,*, Stephen Smith3, Bob MacGregor 3, Ted Huffman3, Suren Kulshreshtha4, Hong Wang1 1
Agriculture and Agri-Food Canada, Swift Current, Canada 2 Renmin University of China, Beijing, China 3 Agriculture and Agri-Food Canada, Ottawa, Canada 4 University of Saskatchewan, Saskatoon, Canada * Corresponding author. Tel: +1 3067787281, Fax: +1 3067783188, E-mail:
[email protected]
Abstract: Agriculture has the potential to supply large amounts of biomass for renewable energy production from residues from traditional crop production and from dedicated energy crops. This renewable energy production has significant potential to contribute to the reduction of GHG emissions in the energy sector by using ethanol and biodiesel to displace petroleum based liquid fuels and direct burning of biomass to displace coal for generating electricity. To quantify this biomass potential, we used the Canadian Economic and Emissions Model for Agriculture to estimate renewable energy production from biomass and the impact on agricultural production. We used two scenarios: the first scenario that looks at a combination of market incentives and mandates, and a second scenario that looks at only market incentives. The results show that: in the markets and mandates scenario, biomass production is higher, both ethanol and electricity are required to take place and land use change occurs. Agriculture has significant potential to generate biomass for energy under different scenarios, the incentive mix can have a large impact on the type of bioenergy produced, there is significant potential for GHG emission reductions and there is potential for unintended GHG effects, such as the increased clearing of land for crop production. Keywords: Bioenergy, Policy, Agriculture, Greenhouse gas emissions, Land use change
1. Introduction For several years, countries have been expanding their production of renewable energy from biomass [1-3]. To date in Canada, most renewable energy has come from grains and oilseeds to supply first generation biofuels. In Canada and elsewhere, significant research is underway on the uses of cellulosic biomass, such as residues and dedicated energy crops to expand the biomass supply available for renewable energy production [4-6]. Climate change is an important issue to governments around the world [7-8]. The effort to reduce net emissions of GHG in Canada could have major implications for Canadian agriculture. Renewable energy production has the potential to contribute to GHG emission reductions by displacing GHG intensive sources of energy. Based on previous analysis [9], the largest potential for agriculture to contribute to reduced GHG emissions is to provide bioenergy feedstocks that would substitute for fossil fuels. However, the use of biomass for renewable energy can have unintended consequences, such as land use change, which could increase GHG emissions from agriculture. Further, the use of biomass for renewal energy has implications for food availability. Increasing renewable energy production from biomass can be accomplished by mandates that require their use or market incentives, such as a carbon price that rewards emission reductions and is technology neutral. There has been extensive work done at Agriculture and Agri-food Canada (AAFC) on the implications of using biomass for renewable energy. This paper will present results from two illustrative forward looking scenarios that will allow us to examine the impacts of using a combination of market incentives and mandates on biomass production
2485
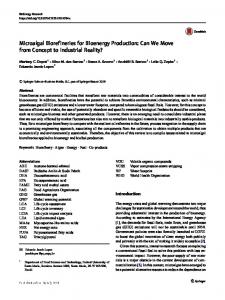
and renewable energy production compared to using only a market based incentive. It will conclude with a discussion of results and highlight areas for future areas of research. 2. Methodology We used two scenarios that represent possible outcomes for market and policy conditions that could be present in 2017. We then used the Canadian Economic and Emission Model for Agriculture (CEEMA) to estimate how different policy scenarios will affect resource utilization, GHG emissions and bioenergy production. 2.1. Canadian Economic and Emissions Model for Agriculture (CEEMA) CEEMA is composed of two models – the Canadian Regional Agriculture Model (CRAM) which assesses the regional resource use implications and the Greenhouse Gas Emissions Module (GHGEM) which assesses the GHG emissions associated with these resource changes (Figure 1). The CRAM component of CEEMA was also enhanced to have a limited ability to clear land based on land availability estimates from a mapping and remote sensing overlay exercise. 2.1.1. The Canadian Regional Agricultural Model (CRAM) CRAM is the main analytical tool used to assess the economic impacts and resource utilization patterns resulting from the scenarios examined. CRAM is a static partial equilibrium model of the Canadian agriculture sector. While CRAM does not give information on the growth of the sector over time, it can provide a very detailed before (baseline) and after (scenario) snapshot of the agriculture sector. CRAM incorporates all of the primary production for both crops and livestock, and also includes some processing activities, such as oilseed crushing, production of biofuels form grains and oilseeds, dairy and livestock slaughter. CRAM is spatially disaggregated across 55 regions in Canada. For the purpose of this analysis, CRAM used AAFC’s 2008 Medium Term Outlook to generate a baseline for the agriculture sector in 2017. This 2017 baseline already includes expectations about the state of the domestic and international biofuels market and assumes that Canada has met its existing target that ethanol replace 5% of gasoline and biodiesel replace 2% of diesel fuel and heating oils [10]. 2.1.2. The Greenhouse Gas Emissions Module (GHGEM) The GHGEM is a spreadsheet based accounting model that translates changes in resource utilization, as determined by CRAM, to GHG emission estimates. It contains modules to estimate direct and indirect GHG emissions from production of crops and livestock. The three greenhouse gases that the model provides estimates for are carbon dioxide (CO2), methane (CH4) and nitrous oxide (N2O) [11]. The emissions can be broadly grouped into the following categories: emissions from farm level activities, emissions that are indirectly related to the farm level activities, emissions from induced economic activities, and emissions from other agro-ecosystem related land use [12].
2486
Canadian Regional Agriculture Model (CRAM) baseline Policy shock based on scenarios gives changes from baseline
Changes in crop production and patterns
Changes in livestock production
Land use change
GHG emissions module interprets changes in resource utilization
Change in greenhouse gas emissions from baseline
Figure 1. Structure of CEEMA
2.1.3. Land availability estimation We also enhanced CRAM to have ability to clear land for new agricultural production based on land availability estimates. We estimated the area of non-agricultural land on soils with agricultural potential by examining the intersection of soil capability maps and land cover maps. Soil capability for agriculture maps for most of the southern parts of Canada were created through interpretation of detailed soil maps and aerial photographs under the Canada Land Inventory program (Department of Regional Economic Expansion, 1969) and are available in digital format (Natural Resources Canada, 2008). These maps were intersected with land cover maps derived through classification of 30-metre Landsat satellite imagery by Agriculture and Agri-Food Canada (2008). This data was then used to populate CRAM with information on which regions had land that could be cleared of forest or shrub cover for crop production [13]. 2.2. Scenarios Two scenarios were used. Each scenario is drawn from a family of scenarios that were used for previous analysis. Each scenario allows for the use of corn stover, cereal straw, hybrid poplar and perennial grass for renewable energy production. These scenarios were intended to be illustrative as opposed to prescriptive, given the uncertainty related to what will be the actual policy and market environment in 2017 [14].
2487
2.2.1. Scenario I: “Markets and mandates” scenario The “Markets and Mandates” scenario is drawn from a family of scenarios that were originally developed to examine the effects of various future renewable energy targets and market conditions on the Canadian agriculture sector. The scenarios consisted of a combination of market drivers and mandates that impact the production of renewable energy. The main renewable energy options in the scenarios are liquid fuels for transport and electricity for the displacement of coal power. Although we considered a range of oil prices, carbon prices, and mandated renewable energy targets, for this paper we are drawing on the scenario with the following characteristics: Table 1.Policies assumptions in “Markets and mandates” scenario
Market incentives Oil price ($/bbl)
Carbon price ($/Mg CO2 eq.)
Ethanol (% of gasoline)
120
50
20
Mandates Biodiesel (% of petroleum diesel) 8
Electricity (% of coal based energy substituted) 20
This scenario contains the highest oil price, carbon price, and mandated renewable fuel use. We also required that 50% of ethanol must come from cellulosic biomass. 2.2.2. Scenario II: “Markets only” scenario The markets only scenario is drawn from a family of scenarios that were developed to look at the impact of a technology neutral carbon price to provide an incentive for renewable energy production. The scenarios looked at the impact of a $10, $30 and $50 CO2e price on the agriculture sector. This scenario did not assume a specific oil price but it is built into the scenario that implementing a carbon price will put some upward pressure on the overall price of energy from fossil fuels. This results in an oil price of roughly $80/bbl. For the purpose of this paper, we will be drawing on only the results from the $50 carbon price scenario. 3. Results 3.1. Biomass production Biomass production is higher in the markets and mandates scenario. The mandates require that a minimum amount of renewable energy be produced that, in turn, requires the production of large amounts of biomass for various source (Figure 2). Total biomass production in the markets and mandates scenario is 37.3 MT compared with 20.6MT in the markets only scenario. In both cases the biomass supply is dominated by residues, and the distribution of biomass production among the various types of biomass is relatively similar.
2488
Biomass production (Millions of tonnes)
18
Grass Poplar Straw Stover Manure
16 14 12 10 8 6 4 2 0
Markets and mandates
Scenario
Markets only
Figure 2. National biomass production by scenarios
3.2. Bioenergy production In the markets and mandates scenario the production of both ethanol and electricity are required to take place. Production of electricity only takes place due to the mandates, as the higher oil price for ethanol out-competed the effect of the carbon price on electricity production for biomass. In the markets only scenario where the only driver is the carbon price, nearly all of the biomass produced is used to offset coal based electricity as there is far greater emission reduction potential associated with reducing use of coal compared to gasoline.
10
40 Ethanol Electricity 30
6 20 4
TWE of electricity
Billions of litres for ethanol
8
10 2
0
0
Markets and Mandates
Markets only
Scenario
Figure 3. Renewable energy production by scenarios
3.3. Land use change Land use change occurs only in the markets and mandates scenario. Because this scenario places very high pressure on the agricultural land base to supply biomass, additional land 2489
comes into production. Overall 319 kHa would be cleared in 2017 for agricultural production, representing a 1% increase in land available for cropping. There is no land use change observed in the markets only scenario. 3.4. Greenhouse gas emissions Emissions reductions in the energy sector are much greater than the emissions savings in the agriculture sector (Figure 4). Almost all the emissions reductions in the energy sector are accomplished from the use of biomass to offset coal. Very little emissions reductions are associated with ethanol use. It should be noted that because of the land use change in the markets and mandates scenario overall emissions can significantly increase. Emissions from land use change could reach 181 MT CO2e (lower if biomass removed during clearing is used), overriding any initial positive benefit associated with bioenergy production. Over time continued emission reductions from bioenergy production can potentially offset the initial release of carbon, but this will only take place after several years and these future emission reductions are not reflected in the results presented above. 35
Millions of tonnes of CO2 e
30
25
20
15
10
5
0
Markets and mandates
Markets only
Scenario
Primary agricultural emission reductions Energy sector emission reductions
Figure 4. Emission reductions related to bioenergy production
4. Discussion and conclusions 4.1. Biomass production and impact on agricultural commodity production In both scenarios, the majority of the biomass production comes from the use of residues. Residues generally outperform dedicated energy crops due to the fact that they are a byproduct of crop production only require harvesting, nutrient replacement, and transportation costs. As residues come from existing land already under the production of traditional crops they do not have to compete for land the way dedicated energy crops do, and since residues already come from existing land, their use requires less land be used exclusively used for renewable energy production. To meet Canada’s current bioenergy target of 5% ethanol and 2% biodiesel that is expected to come from grains and oilseeds, 5% of cropland would be required to provide the necessary feedstock. In the markets and mandates scenario with 20% ethanol, 8% biodiesel and 20% coal displacement this would increase to 16% of cropland 2490
used exclusively for bioenergy, not including the impact of increased corn imports from the US. In the markets only scenario, because electricity accounted for almost all the bioenergy produced there was no increase in the use of grains for first generation biofuels. There was some expansion in the production of dedicated energy crops but this amounted to only 7% of cropland as most feedstock came from residues and did not impact traditionally commodity production. Through the diversion of land from traditional commodity production can place additional pressure on the overall system’s ability to supply agricultural commodities; the shifts in Canadian production are not expected to impact world commodity prices. 4.2. Renewable energy production While the distribution of biomass production in the two scenarios is relatively close, the production of renewable energy is not. When incorporating the effects of mandates and a higher oil price, there is a much stronger tendency to produce ethanol from biomass. When looking at the impact of only a carbon price and no mandates, the results show that biomass production is used mainly to displace coal electricity. Mandates require specific renewable energy outputs to be met while the use of market based instruments allows the market to allocate resources. 4.3. GHG reductions In our modeling framework, GHG-reducing activities will benefit from the carbon market. For example, producing liquid biofuels from grains and biomass, as well as electricity from biomass are assumed to generate GHG reductions that add value to the production activity relative to the strength of their emission reductions. In this analysis using one unit of biomass for coal electricity displacement generated roughly 10 times the benefit of using that same unit for ethanol to displace gasoline. The impact on soil organic carbon with the production of additional perennial crops was also incorporated but it had a relatively small impact compared to the downstream benefits from renewable energy production. Canada has about 10 million ha of land that has potential for agriculture that is currently and predominantly under shrubs or forest. If the scope of GHG considered in the policy does not include emissions from this clearing this land and land use change occurs, then the emission from that clearing could result in a large initial increase in emissions and it would time for emission reductions from bioenergy to drive the system to being a net contributor to GHG reductions. 4.4. Other considerations and future areas of research There are other items that are not addressed in this paper such as the longer term impact of residue removal on soil erosion and the broader interaction with the forestry sector. These are important items for future research that will need to be carefully considered related to the large scale production of biomass from residues and dedicated energy crops. References [1] E.S. Lora, R.V. Amdrade, Biomass as energy source in Brazil, Renewable and Sustainable Energy reviews (13), 2009, pp.777-788. [2] J.Goldemberg. Ethanol for a sustainable energy future, Science (315), 2007, pp.808-810. [3] M.F. Demirbas, M. Balat, H. Balat, Potential contribution of biomass to the sustainable energy development, Energy Conversion and Management (50), 2009, pp.1746-1760. 2491
[4] L.R. Lynd, Overview and evaluation of fuel ethanol from cellulosic biomass: technology, economics, the environment, Annual Review of Energy and Environment, 1996(21), pp.403-465. [5] Y. Lin, S. Tanaka, Ethanol fermentation from biomass resources: current and prospects, Applied Microbiology and biotechnology (69), 2005, pp.627-642. [6] R.H. Sims, A. Hastings, B. Schlamadinger et al., Energy crop: current sataus and future prospects, Global Change Biology (12), 2006, pp.2054-2076. [7] N.H. Stern, The economics of climate change: the Stern review, Cambridge University Press, 2007, pp. 118-315. [8] IPCC, Climate Change 2007: Synthesis Report, Contribution of Working Groups I, II and III to the Fourth Assessment Report of the Intergovernmental Panel on Climate Change Core Writing Team, Pachauri, R.K. and Reisinger, A. (Eds.) IPCC, Geneva, Switzerland. pp.1-104. [9] R. Gill, G. Achuo, GHG Abatement Cost Curves for the Agriculture Sector: Potential to Reduce Emissions [10] S. Smith, B. MacGregor, GHG mitigation potential for the agriculture sector, Agriculture and Agri-Food Canada, 2010. [11] S.N. Kulshreshtha, B. Junkins, R. Desjardins, Prioritizing greenhouse gas emission mitigation measures for agriculture, Agricultural Systems(66), 2000, pp.145-166. [12] S. Kulshreshtha, C. Nagy, E. Knopf, Greenhouse and Energy Use Implications under Seleted Biofuel Scenarios, University of Saskatchewan, 2009. [13] S. Smith, B. MacGregor, Quantifying biomass availability and land use change in the agriculture sector from renewable energy production: Implications for Sustainable Resource Use, Agriculture and Agri-Food Canada, 2009. [14] B. McConkey, S. Kulshreshtha, S. Smith, et al., Maximizing Environmental Benefits of the Bioeconomy using Agricultural Feedstock, Report to the PERD-CBIN Bio-energy project, Agriculture and Agri-Food Canada, 2008, pp.21-96.
2492