Power-law Distributions in Information Science – Making the Case for Logarithmic Binning Staša Milojević School of Library and Information Science, Indiana University, Bloomington 47405-1901. Email:
[email protected] Accepted for publication in Journal of the American Society for Information Science and Technology (JASIST) We suggest partial logarithmic binning as the method of choice for uncovering the nature of many distributions encountered in information science (IS). Logarithmic binning retrieves information and trends “not visible” in noisy power-law tails. We also argue that obtaining the exponent from logarithmically binned data using a simple least square method is in some cases warranted in addition to methods such as the maximum likelihood. We also show why often used cumulative distributions can make it difficult to distinguish noise from genuine features, and make it difficult to obtain an accurate power-law exponent of the underlying distribution. The treatment is non-technical, aimed at IS researchers with little or no background in mathematics. Keywords: Power law distributions; Logarithmic binning
While detailed technical reviews of power laws exist in recent literature (e.g., Clauset, Shalizi, & Newman (2009) and Newman (2005)), these do not devote much attention to the logarithmic binning method. Binning is simply a procedure of averaging the data that fall in certain ranges of values (bins), and here we use it to “beat” the statistical noise and thus reveal the trends in the data. Binning is logarithmic, meaning that the bins have equal sizes in logarithms, which is, as we will see, a natural choice for a power law. Logarithmic binning is given some consideration (especially as a vast improvement over unbinned representations) in Adamic’s (n.a.) online tutorial, but in it most attention is given to Pareto’s cumulative distribution, which, we will argue, is not always a better alternative.
Introduction Information science (IS) is replete with distributions that can be characterized as a power law. Examples include author productivity (Egghe, 2005; Lotka, 1926; Pao, 1986), citations received by papers (Price, 1965; Redner, 1998), scattering of scientific literature (Bradford, 1934; Nicolaisen & Hjørland, 2007), and collaborative tagging behavior (Golder & Huberman, 2006). These constitute only a subset of empirically found distributions that follow a power law (an excellent overview of power laws and processes that can lead to these distributions is given by Newman (2005)). Here we focus on some aspects of power law functions that are relevant to IS researchers. Mostly, we want to provide a method, logarithmic binning, that will help researchers recognize the presence or absence of power laws in their data. Descriptions will refrain from using mathematical formalism in order to make it useful for those who do not have mathematical or physical sciences training.
Power-law distributions can mathematically be represented with power-law functions:
y cx a , where a is the power law exponent, and c an overall scale, or normalization. Power-law functions are monotonous, which means that when x changes, y either only decreases or only increases. When power
1
distribution which describes the number of items in the source where sources are ranked in the decreasing order of frequency. Zipf’s law originally applied to the number of times certain words have been used in a text, from the most frequent to the least frequent. This distribution is again a power law. We note that it is possible to construct the word occurrence distribution in the size-frequency manner as well. Thus, the Lotka “version” of the word frequency “law” would be that there are many words that appear rarely and few that are common, and that this distribution is a power law. So, words such as “the” or “a” would have large values of x in Lotka’s distribution, while they would have low values of x in the case of Zipf’s distribution. Moreover, it can be shown (Adamic, n.a.), that Pareto’s cumulative distribution is equivalent to Zipf’s rankfrequency distribution, with the x and y axes simply flipped. Quoting Adamic, one can see that “the phrase ‘The r-th largest city has n inhabitants’ is equivalent to saying ‘r cities have n or more inhabitants’”. The first phrasing is Zipf’s formulation, the second Pareto’s.
laws are used to describe distributions, the exponent a is typically positive, meaning that when x increases, the y value decreases. Qualitatively this means that objects or events with a high value of some quantity are typically rare (there are few very prolific authors, very large cities, etc.). Power law distributions lead to phenomena such as the 80:20 rule. This rule, also known as the Pareto principle, was conceptualized by J. M. Juran, and states that 20% of causes lead to 80% of phenomena. It should be stated that this exact ratio (80:20) corresponds only to one specific value of the power-law exponent, a = 2.16 (calculated from Newman (2005), eq. 29). Sometimes, certain distributions are described as scale-free in addition to being power law. This means that an increase by a certain factor at any value of x will produce the same decrease (or increase) in y. However, as Newman (2005) showed, the power law distribution is the only scale-free distribution, so the two expressions are synonymous, and we use only power law in this paper.
Bradford’s distribution (law). Bradford’s law (Bradford, 1934) of literature scattering shows cumulative distribution of journals covering a specific subject. Mathematically, distributions of Bradford type are cumulative versions of Lotka’s distribution (Burrell, 1991; Leimkuhler, 1967).
Power-law distributions in IS Historically, different IS phenomena have been described using the mathematical formalism of power law (Bookstein, 1976; de Bellis, 2009; Egghe, 1985). These power-law distributions have been given different names, although they are all related (Bookstein, 1990).
As has already been mathematically proved (Egghe, 1985, 2005), all of the above-mentioned distributions are equivalent. Basically these are all power law distributions that can come in “straight” form and are then known as Lotka’s distribution, or in ranked or cumulative form and are then known as Zipf/Bradford/Pareto distribution. This work focuses on the Lotka form of power law distributions.
Lotka’s distribution (law). Lotka’s law is one of the best-known examples of a power-law distribution in IS, though not widely known outside the field. Its original formulation (Lotka, 1926) can be described in the following way: a large number of authors (y value) produces a small number of papers (x value), while very few produce many. Such a description, of course, is not precise since many distributions (not necessarily power law) exhibit such a property. More specifically, the power-law nature of Lotka’s law can be illustrated in the following way. Let us take a power law exponent of 2, as suggested by Lotka, then, if there are 100 authors with one article, there should be 25 with two, 11 with three, and so on. Lotka’s law is an example of a size-frequency distribution, which describes the number of sources with a certain number of items.
Differences between formal power laws and empirical power laws encountered in IS Deviations from a power law. First and foremost, empirical power laws (e.g., earthquake magnitudes, populations of cities, and number of telephone calls) are only approximations of mathematical power laws. Deviations of empirical distributions (including those in the IS) from a power law can be due to the fact that the underlying processes are more complex (and more difficult to formally describe) than a simple power law. In other words, one uses a power law as an approximation of true distribution. If certain data
Zipf’s distribution (law). Zipf’s law comes from linguistics (Zipf, 1949). It is a rank-frequency
2
power law holds for small values of x, but then turns smoothly into a declining exponential function for large x. The exponential, large-x tail drops faster than the power law. Another example of a deviation from a pure power law is (d) a log-normal/power-law distribution (Milojević, 2010), where the power law holds for large x, but a log-normal distribution describes small x. The log-normal part appears rounded on a log-log plot, and can have a maximum (peak) value, unlike the regular power law, or the examples (a), (b) and (c), all of which are monotonously declining.
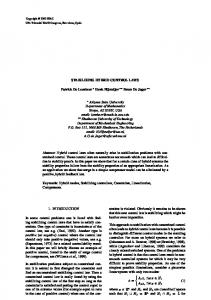
exhibit persistent systematic deviations from a power law it is worth trying to modify a simple power law to more accurately describe the data. Examples of such modifications are shown in Figure 1: (a) double power law (Csányi & Szendroi, 2004) in which there are two ranges with different power-law exponents (these appear like two straight lines on a log-log plot), (b) Pareto type 2 (or Lomax) distribution (Burrell, 2008; Glänzel, 2007) which tends towards a constant (straight horizontal line) for small values of x, but then turns smoothly into a power-law for large x, (c) power law with an exponential cutoff (Newman, 2005), where
1000
1000
(a)
100
(b)
100 log y
10
10 log y
1
1
0.1
0.1
0.01
0.01
0.001
0.001 0.1
1
log x
0.1
10
log x
10
100
(d)
1000
(c)
1000
1
100
100
100
log y
10
10
log y
1
1
0.1
0.1
0.01
0.01
0.001
0.001 0.1
1
log x
0.1
10
1
log x
10
100
100
Figure 1. Examples of deviations from a perfect power law. (a) Double power law is a power law with two different exponents. (b) Pareto II (or Lomax) distribution behaves as a constant function for small values of x, and as a power law for large x, with smooth transition. (c) Power law with an exponential cutoff behaves like a power law for small values of x, but drops more steeply (exponentially) for larger x. (d) Log-normal/power law composite has a log-normal distribution (which can have a peak) for smaller x, and a power law for larger x.
pure power laws. One reason for doing so is that power laws are easily described with basically one number, the exponent.
Determining whether the data are actually drawn from a pure power law or not is beyond the scope of this work. Methods that can be used to establish this are given in Clauset et al. (2009). However, we note that it is fairly common to interpret the results in IS as power laws, even when it is obvious that they are not
Discrete vs. the continuous values of x. Another important difference between a formal power law
3
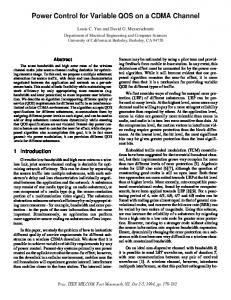
function (as, for example, described in introductory algebra textbooks) and its manifestation in IS is that the power law, as most mathematical functions, is defined (has some value y) for a continuous range of real numbers x (numbers that in addition to whole, “round” numbers include decimal numbers). This continuity is shown as a solid line in Figure 2a. This is not the case in real IS distributions, where x must be a whole, positive number (1, 2, 3, …). 1 In other words, power laws in IS are discrete (non-continuous); they are defined only when x is a natural number. To distinguish it from the continuous power law, we will refer to such x as k.
100000
continuous
10000
y
1000 100 10 1 0.1 0.1
1
10
100
1000
x 100000
Statistical nature of empirical power law distributions and the noisy tail. Furthermore, in empirical power law distributions the y value is also a non-negative integer (0, 1, 2, 3, …) and therefore discrete (Figure 2c). We refer to such integer values of y as yk. Taking again the example of Lotka’s law with exponent 2 and normalization of 100, we formally expect 6.25 authors to have produced four papers (100/42=6.25). In reality, this has to be an integer, and we naturally expect it to be 6. However, empirical power laws are not just the “rounded” versions of theoretical power laws. This “rounding” doesn’t capture the real, probabilistic nature of empirical distributions. In the above example, while we expect outcome to be 6, other values are also possible. The exact answer can be obtained by calculating a Poisson distribution with a mean of 6.25. From it one can see that, as expected, 6 is the most probable outcome (with a probability of 16%), but that 5 and 7 are similarly probable (15% and 14%, respectively). Other numbers (including zero) are possible too, but with decreasing probabilities. This probabilistic aspect leads to the statistical noise, which is always present, but is most obvious in the tails of discrete power law distributions, i.e., when the expected value of y is low. Again
discrete (theoretical)
10000
y
1000 100 10 1 0.1 0.1
1
10
100
1000
k
100000
discrete (empirical)
10000
y(k)
1000 100 10 1 0.1 0.1
1
10
100
1000
k Figure 2. Distinctions between different types of power law functions. All three functions have the same exponent (a = 2). (a) Continuous power law is defined for any value of x and appears as a perfectly straight line. (b) Discrete power law (i.e., Lotka’s law) is defined only for natural numbers, which is why no points exist left of k = 1. Points get closer together for large k because the difference between the logarithms of consecutive numbers becomes smaller. Values of y are real numbers and points lie on a perfectly straight line. (c) Empirical discrete power law is a random “drawing” from the theoretical discrete power law. Panel shows one such drawing. Due to the statistical nature of the empirical distribution, deviations from (b) are present, especially for large k (the tail). Now yk must take integer values, which is why at large k we typically have either one or zero, leading to noticeably noisy appearance.
1
Even in instances when the distribution may be modified in such way that x values do not represent integers, (for instance, if one constructs the productivity distribution, but assigns partial “credit’ ( 100, we reach a point where we have very large deviations, and soon after the yk values become two, one or zero. Superimposed on the empirical data in Figure 3 are the logarithmically binned points (open circles). For k < 10 the data is not binned, so each category from 1 to 9 is kept with original values, and coincides with black points. For k 10 the statistical fluctuations exceed 2% and the data are binned in bins of 0.1 decades. For example, k = 15, 16 and 17 have log k = 1.18, 1.20, 1.23, and they will all be placed in a bin centered at 1.2 (spanning the logarithmic range from 1.15 to 1.25). For
For smaller datasets (with fewer than ~10,000 data points), the statistical error in yk will always be above the noise threshold of several percent. In such cases we may choose a starting point for binning (kb) such that the separation between successive values (log (k + 1) – log k) becomes smaller than the size of the bin. For example, if the bin size is 0.1, then the binning will apply for k 5, since log 5 – log 4 = 0.097, which is smaller than 0.1. Once the bin size and the starting point for binning are selected, for each bin we calculate the binned value (yB) simply as the average of all yk values (1 through n) such that k falls in the bin:
yB
no binning binned
100000
y k1 y k 2 y kn . n 6
critical for investigated.
k = 14, log k = 1.146, so it will be placed in the preceding bin, while for k = 18, log k = 1.26, and it will be placed in the following bin. One then averages the values of yk corresponding to k = 15, 16 and 17, according to the above equation, even if some of them are zero (that is, n is always 3 for this bin). Looking at the binned points in Figure 3, we see that while the unbinned data start to show increasing random fluctuations for k > 50, the binned points are still smooth. The most striking difference appears at the end of the tail. While the unbinned data end in noise, the binned points show that the smooth power-law decline of the number of authors with large number of papers continues. Of course, such binned y has to be interpreted as the expected value. For example, the binned data tell us that we should expect to have 0.1 authors who have published 300 papers, which can be interpreted that the expected number of authors who publish between say 295 and 304 papers is one.
understanding
the
10000
problem
being
continuous model
1000
y
100 10 1 0.1 0.01 1
10
100
1000
10000
x 10000 simulated data
1000
The example shown in Figure 3 also helps us see any hidden trends. Binned points now indicate that the power-law trend is not perfect, but is slightly curved throughout. Indeed, a formal fit shows that the quadratic fit is a much better functional description of the trend than the linear fit. A quadratic function in log-log space corresponds to a log-normal function, one of the “deviations” of a power law mentioned previously, and discussed at length in (Milojević, 2010). A reasonably good fit is also obtained with a Pareto type 2 (Lomax) function described earlier.
y(k)
100 10 1 0.1 0.01 1
10
100
1000
10000
k
10000
How do we know that the trend uncovered from the noisy tail is indeed real? One way to establish this is using simulations. In Figure 4a we show a model double power law function that changes exponent at x = 50. At that point the slope changes from 2 to 1.1. Using this theoretical model we produce (simulate) data points drawn from this function, shown in Figure 4b. We see all the usual statistical fluctuations in the tail. Most importantly, we now see that it is hard to realize that there is an underlying double power law. That feature is lost in the noise and the distribution looks similar to one in Figure 2c, which is a single power law. Next, we apply logarithmic binning to these simulated data. The result is shown in Figure 4c. Binning starts at k = 6, and the bin width is 0.1 decades. Binned points remove most of the noise present in the data and reveal the existence of the double power law. This illustrates how binning reveals real features present in the data, some of which may be
binned data
1000
y(B)
100 10 1 0.1 0.01 1
10
100
1000
10000
k Figure 4. Retrieval of real trends in the case of a double power law. (a) A composite continuous function, constructed from power laws with different exponents (changing from 2 to 1.1 at x = k = 50). (b) Simulated “data” drawn from a discrete version of the function shown in panel (a). The second power law is completely hidden in the noise. (c) Logarithmic binning of the “data” from panel (b). Binning retrieves the double power law structure that was hidden (but apparently not lost) in the noise.
7
software LOTKA 6 (Rousseau & Rousseau, 2000). Running LOTKA on data from Figure 2c gives the exponent of a = 2.01, very close to true value.
Extracting the exponent If a distribution resembles a power law, one typically tries to estimate its power-law exponent a. This enables a simple quantitative comparison with other studies. The power-law exponent can be easily visualized as a slope of the line in the log-log plot. Note that in cases where the power law inherently deviates from a perfect power law (as for example in Figure 3), the determination of the exponent a will be sensitive to the range of k used to obtain the slope. In such cases the slope can be quite different if fitted only to the core of the distribution (small k), or only to the tail.
10000
y(B)
100 10 1 0.1
Figure 2b shows a theoretical power law with a slope a = 2. However, if we were to use the ordinary least square method (without weighting) to obtain the slope from the “data” (Figure 2c), the result would be 1.31 (with all points included in the fit). This is a significantly biased result not reflected in the formal statistical error of the slope, which is only 0.15. The flattening of the slope is due to a large number of points in the noisy tail that lie above the underlying theoretical slope. One commonly used procedure to combat this bias is to exclude the data points from the tail, but this is a rather arbitrary and wasteful procedure. A much better alternative is to perform the ordinary least square fit on the logarithmically binned data. Applied to points from Figure 2c this method gives a result of a = 2.10, much closer to the expected value and entirely consistent with it (statistical error of the slope is 0.23).
0.01 1
10
100
1000
10000
k Figure 5. Extraction of power law exponents when the underlying function is not a true power law. Underlying distribution is actually a double power law from Figure 4. A least square fit to binned points produces a dashed line, while maximum likelihood method yields a shaded line.
While there may be little doubt that the maximum likelihood method is preferable to the least-square fit in cases where the underlying distribution is known to be a true power law, this is less obvious in real-world cases, where distributions deviate from power laws. For example, data in Figure 4b come from an underlying distribution that is a combination of two power laws (a = 2 and a = 1.1). Least square fit to logarithmically binned data produces an overall exponent of 1.49, shown with a dashed line in Figure 5. This exponent passes close to the binned data for the entire range of k. The exponent obtained using the maximum likelihood method and unbinned data is 1.84 and is shown with a grey line. This exponent describes data better than the least-square fit for smaller k (before and around the place where exponent changes), but starts to deviate increasingly in the very tail. Which method is “better” may depend on the question we are asking. Here we show that the least-square fitting to logarithmically binned data may be instructive in some cases, and should be used in addition to the maximum likelihood methods, especially when we are not certain that the underlying distribution is a pure power law.
One alternative to the least-square fitting is the maximum likelihood method. Newman (2005) provides a simple formula to obtain the power law exponent from the data (without any binning). However, that formula works only for continuous power law distributions (Clauset et al., 2009). Applying it to data that were drawn from discrete distributions produces altogether incorrect results. For example, applied to points in Figure 2c, it yields a = 2.8. For such distributions one must apply maximum likelihood methods for discrete distributions, which, unfortunately, cannot be expressed as a simple formula, but require numerical integration (Clauset et al., 2009). However, easy to use tables that show the relation between data sums and the exponent are given in Rousseau (1993) 5 and have been implemented in the
6 5
binned data LSF slope ML slope
1000
Available from http://www.cindoc.csic.es/cybermetrics/articles/v4i1p4.html.
Also reproduced in Egghe (2005).
8
for small k the cumulative points are steeper than the expected exponent of 1.
Let us again emphasize that the least square fitting should never be applied to unbinned data. For example, if applied to the data in Figure 4b, it would give an exponent of 0.55, a result seriously affected by the noise in the tail.
cumulative (empirical) expected slope
100000
cumulative y(k)
10000
Logarithmic binning versus cumulative distribution In this paper we present logarithmic binning as a way to reduce the effects of the statistical noise in empirical IS distributions. Cumulative distributions have been suggested as an alternative or even in “many ways a superior” method to logarithmic binning (Newman, 2005, p. 326). In cumulative distributions (again, the focus is on discrete empirical distributions), one shows the number of objects having a value larger than k, instead of the number of objects with value exactly k as was the case so far. For example, for productivity distributions, yk when k = 1 would be the number of authors who have published one or more papers, and not those who have published exactly one paper. Value of yk when k = 2 are all authors with two or more papers, and so on. It is easy to see that each successive yk will be smaller than the previous one, i.e., cumulative distributions always fall. Consequently, the cumulative distribution is strictly monotonous, unlike the non-cumulative distribution where noise can make the function fluctuate up and down. This strict monotony leads to a smooth appearance of cumulative distributions with little or no apparent noise in the tail.
1000 100 10 1 0.1 1
10
100
1000
k Figure 6. Cumulative version of the power law “data” from Figure 2c. The function that generated the “data” has the exponent of exactly 2, which means that the exponent of 1 is expected for the cumulative distribution, shown as a line. Actual cumulative distribution deviates from the expected straight line at both ends, and is overall more steep.
Our main objection to the use of cumulative distributions in IS is that they do not really eliminate the noise in the tail, they just make it more difficult to see it or to distinguish it from real features. Noise appears to be absent simply because the cumulative distribution is monotonous, and therefore smooth and “nicer looking”. That the noise is still there we see again in Figure 6, by the increasing departure in the downward direction of cumulative points from the expected straight line. Departure from the expected slope starts around k = 30, but is difficult to see before k = 100. If we did not know what the true exponent of this distribution was, we would have a hard time realizing that the increased slope at large k is not real but due to the noise. Not surprisingly, obtaining the least square fit to such cumulative distribution gives a steep slope with the exponent 1.23, a result that is further from the correct one than those produced by the logarithmically binned or maximum likelihood methods applied to non-cumulative versions discussed previously.
We need to emphasize that the many perceived advantages of cumulative distributions may not always be there. First, it is generally recognized that if a regular, non-cumulative function is a power law, than the cumulative function would also be a power law only with an exponent that is smaller by exactly one (Newman, 2005). What is often overlooked is that this applies only to continuous functions. A cumulative function of a discrete power law will result in a distribution that curves up for small values of k. For example, for a power law with exponent of 2, we expect the cumulative distribution to have the exponent of 1. However, in the discrete case the slope between points k =1 and k = 2 will be 1.35. Exponent approaches the expected value of 1 only for larger k. This can again be illustrated using the data from Figure 2c, where we know the underlying exponent is 2. We show its cumulative version in Figure 6. We see that
That cumulative distributions make noise and true features difficult to distinguish is even more striking when the underlying distribution is not precisely a power law, as is often the case in IS. In Figure 7 we show a cumulative version of the double
9
traditional least square method and without discarding the data in the tail. Getting the exponent from the binned data is recommended in addition to procedures such as the maximum likelihood method, which is preferable when the underlying distribution is known to follow a pure power law. For most IS applications we suggest binning that starts from k = 5, and using intervals of 0.1 decades.
power law distribution of Figure 4b. It appears very smooth. Dot-dashed lines show what one would naively expect the slopes to be, by taking the noncumulative exponents and reducing them by one. The cumulative distributions look nothing like it. The double power-law character of the underlying function is very difficult to see. The main reason for this is that each point is “affected” by all of the points that come after it. So even in the range where the effects of noise are small (k