Earth Science & Climatic Change Research Article Research Article
Awotwi, et al., J Earth Sci Clim Change 2015, 6:1 http://dx.doi.org/10.4172/2157-7617.1000249
Open OpenAccess Access
Predicting Hydrological Response to Climate Change in the White Volta Catchment, West Africa Awotwi A1*, Kumi M2, Jansson PE3, Yeboah F4 and Nti IK5 Department of Environmental Engineering, Med Mining Company Limited, P.O. Box AT 971 Accra, Ghana CSIR-Water Research Institute, Environmental Chemistry Division, P.O. Box TL 695, Tamale, Ghana 3 Departments of Land & Water Resources Engineering, Royal Institute of Technology, Stockholm, Sweden 4 CSIR-Building and Road Research Institute, P. O. Box 40, Kumasi, Ghana 5 Department of Computer Engineering, University of Ghana, Ghana 1 2
Abstract This study uses an ensemble of Regional Climate Model (REMO), to simulate and project the climate at local scale in order to investigate the hydrological impact of possible future climate change in White Volta Catchment (West Africa). The results, obtained from the REMO climate model, were compared to the observational datasets for precipitation and temperature for the period 1995-2008. The projected meteorological variables for the period 2030-2043 were used as input to the Soil and Water Assessment Tool (SWAT) hydrological model which was calibrated (R2 = 0.88 and NSE= 0.84) and validated (R2 = 0.82 and NSE= 0.79) with historical data to investigate the possible impact of climate change in the catchment. The results obtained from the investigation revealed that catchment is sensitive to climate change. With a small increase of 8% and 1.7% of the mean annual precipitation and temperature respectively, annual surface runoff, annual baseflow and evapotranspiration recorded increment of 26%, 24% and 6% respectively.
Keywords: Climate change; Hydrological process; White volta catchment; SWAT; REMO
Introduction Climate variability and change are expected to change hydrologic conditions and result in various impacts on global water resource systems. Likely impact may be on hydrological processes such as evapotranspiration, water temperature, stream flow volume, soil moisture, timing and magnitude of runoff, and frequency and severity of floods, all these will lead to changes in environmental variables [1,2]. Climate change is expected to have different impact on socioeconomic development in every country but the degree of impact will differ. According to IPCC developing countries such as those in West Africa will be more vulnerable to climate change. The main driven force behind the economy of West Africa countries is agriculture which is very sensitive to climate change. So understanding the hydrologic response of watersheds to physical (land-use/ land-cover) and climatic (rainfall and air temperature) change is an important component of water resource planning and management [3], as well as economics. Over the past years there has been a significant focus on studies, analysis and exploration of both surface water and groundwater, with the intention of maintaining a balance between demand, quantity and quality of water. Mohammed [4] used hydrological model, Soil and Water Assessment Tool (SWAT), to analyses the impact of climate change on soil water availability and crop yield in Anjeni watershed Blue Nile Basin. Also Mango et al. [5], assessed the effect impact of land-use and climate change effect on the hydrology of the upper Mara River Basin, Kenya to support better resource management. Again, Liu et al. [6] quantified the effect of land-use and land-cover change on green-water and blue-water using hydrological model. Studies have shown that with the increasing population growth, industrial development and expansion of irrigated agriculture activities, water demand will continue to rise to a point where the task of providing water will be very difficult. The study area, White Volta located in West Africa, will be among the regions that are most likely to be affected. J Earth Sci Clim Change ISSN:2157-7617 JESCC, an open access journal
Climate models are the main tools available for developing projections of climate change in the future. The climate models popularly used to derive projections into the future are the General Circulation Model (GCM). However, GCMs are unable to depict details needed for assessing climate change impacts at national and regional level. When detailed information is needed for specific region, Regional Climate Model (RCM), might be the tool for obtaining the dynamic of climate features. The RCM improves resolves the meso-scale linked with coastlines, mountains, lakes, and vegetation characteristics that have strong influence on the regional climate [7]. A significant number of studies have been conducted using climate models over Africa. Mohammed [4], presented the impact of climate change on soil water availability and crop yield in Anjeni watershed in Blue Nile Basin of Ethiopia. Kasei [8], also evaluated the effect of climate change on water resources in the Volta Catchment using regional climate models, MM5 and REMO, and hydrological model, WaSiM. Again Mango et al. [5] evaluated the impact of land-use and climate change on the hydrology of the upper Mara River Basin, Kenya. For the planners to project for future hydrological processes, they need to assess the sensitivity of climate change especially rainfall and air temperature changes, which is the main objective of this study. To achieve this objective, hydrologic model, SWAT, was calibrated using stream flow at the outlet of White Volta Catchment. Then the future climate changes projected by regional climate model, REMO,
*Corresponding author: Awotwi A, Department of Environmental Engineering, Med Mining Company Limited, P. O. Box AT 971 Accra. Ghana, Tel: +233201659207;E-mail:
[email protected] Received November 16, 2014; Accepted December 31, 2014; Published January 10, 2015 Citation: Awotwi A, Kumi M, Jansson PE, Yeboah F, Nti IK (2015) Predicting Hydrological Response to Climate Change in the White Volta Catchment, West Africa. J Earth Sci Clim Change 6: 249. doi:10.4172/2157-7617.1000249 Copyright: © 2015 Awotwi A, et al. This is an open-access article distributed under the terms of the Creative Commons Attribution License, which permits unrestricted use, distribution, and reproduction in any medium, provided the original author and source are credited.
Volume 6 • Issue 1 • 1000249
Citation: Awotwi A, Kumi M, Jansson PE, Yeboah F, Nti IK (2015) Predicting Hydrological Response to Climate Change in the White Volta Catchment, West Africa. J Earth Sci Clim Change 6: 249. doi:10.4172/2157-7617.1000249
Page 2 of 7 were used as an input into SWAT to project the future hydrological responses. The results of the study are expected to give an insight of the future the hydrological behavior, and serve as a planning tool for stakeholders in the water sector.
the watershed and to analyze the drainage patterns of the terrain, slope and slope length of the terrain which are parameters of the sub-basin as well as stream network characteristics: channel slope, length, and width were obtained from the DEM.
Methodology
Land Use/ Land cover data
Study area
One of the most important factors that affect water balance components in a watershed is land cover. The land-use/land¬-cover map used in this study was digitized from map obtained from Global Change and Hydrological Cycle (GLOWA). The map was georeferenced with ground truth data. The original legend was modified to make it necessary for SWAT to be used for modeling with the various parameters obtained from Council of Scientific and Industrial Research (CSIR), Ghana manually added land-cover database into the SWAT model. With this modification of legends, five land-use/land-cover classes were identified in the study area, with the dominant classes being cropland, savannah, grassland and urban (Table 1). SWAT uses the land-use/land-cover data to determine the area and the hydrologic parameters of each land-use and soil category simulated within each sub-basin [13]. With this modification of legends, four land-use/landcover classes were identified in the study area, these are cropland, savannah, grassland and urban.
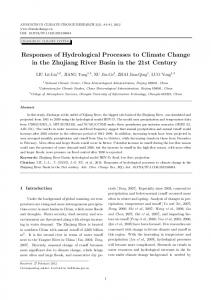
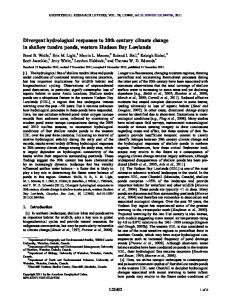
This study was carried out in the White Volta Catchment which covers an area of about 106,300 km2 and it is located in West Africa (Figure 1). The White Volta Catchment covers mainly the north-central parts of Ghana and the central part of Burkina Faso. Climatically, it falls within the semi-arid to humid zone, which is characterized by high temperatures and a mono-modal rainfall distribution with approximately five months rainy season lasting from May to September (Figure 2). The average annual rainfall varies between 900 mm in the northern part of the catchment to about 1,100 mm in the southern part [8]. The rainfall distribution decreases towards north. While in the northern part, the mean monthly temperature vary from 36°C in March to 27°C in August whiles in the south it ranges between 30°C in March to 24°C in August. The mean annual temperature and Evapotranspiration (ET) are 26°C and 1650 mm respectively [9]. Luvisols, regosols, vertisols, lithosols, planosols, cambisols, gleysols and acrisols are the main types of soil covering the catchment with luvisols, regosols and lithosols being the dominant soil types in the catchment and covering more than half of the area [10]. Agriculture, savannah and grassland are the main land-cover in the catchment.
Description of SWAT model The SWAT model is a medium-to-large-scale river basin model which was developed to predict the impact of land management practices on water, sediment and agricultural chemical yields in large complex watersheds with varying soils, land-use and management conditions over long periods of time [11]. It is a conceptual, physically based long-term continuous watershed scale simulation model that operates on a daily time step that uses a GIS interface and readily available input data such as Digital Elevation Model (DEM), climate, soil and land-use data. The model operations involves division of a watershed into sub-basins by overlaying land-use, soil map and DEM, then further sub-divided into lumped units called hydrologic response units (HRUs). HRUs is the percentages of the sub-watershed area. The overall water balance is generated at HRUs level, involving ET, canopy interception of precipitation, lateral subsurface flow from the soil profile and return flow from shallow aquifers. The simulation process is performed in the surface soil, intermediate zone, shallow and deep aquifers, and open channels. Many studies have successfully used a calibrated and validated model to estimate the impact of climate change on water budget. For example, Mohammed [4], demonstrated the potential of the SWAT model by assessing the impact of climate change on soil water availability and crop yield in Anjeni watershed. SWAT model has also been used by Mango et al. [5] to access land use and climate change impacts on the hydrology of the upper Mara River Basin, Kenya. Again Zhang et al. [12] used SWAT to predict hydrologic response to climate change in the Luohe River Basin. In all the mentioned studies, SWAT to some degree can evaluate the hydrological impact of climate change.
Soil Map The SWAT model needs soil property data: available moisture content, bulk density, texture, chemical composition, physical properties, hydraulic conductivity and organic carbon content for the various layers of each soil type [14], to simulate the response of river basin. Soil data were obtained from Soil and Terrain Database for Western Africa. Eight different soil classes were identified in the study area; Luvisol soil is the dominant soil type in the catchment and covers more than half of the area (Table 2). Luvisols have an agriculture
Model Input Data Digital Elevation Model (DEM) A 90 m resolution DEM from the Shuttle Radar Topography Mission (SRTM) was used for the study. The DEM was used to delineate J Earth Sci Clim Change ISSN:2157-7617 JESCC, an open access journal
Figure 1: Physical layout of White Volta
Volume 6 • Issue 1 • 1000249
Citation: Awotwi A, Kumi M, Jansson PE, Yeboah F, Nti IK (2015) Predicting Hydrological Response to Climate Change in the White Volta Catchment, West Africa. J Earth Sci Clim Change 6: 249. doi:10.4172/2157-7617.1000249
Page 3 of 7 technological emphasis on a balance between fossil-intensive and nonfossil energy sources [18]. A dynamic RCM, REMO, was used to downscale GCM ECHAM4 to determine climate projections for the catchment for the period 2030-2043. The output generated from REMO (mainly rainfall and temperature) were used as input for the SWAT model. REMO is a hydrostatic, three-dimensional atmospheric model, which has been developed by Max-Planck-Institute for Meteorology in Hamburg. It is based on the Europa Model, the former numerical weather prediction model of the German Weather Service and is described in Jacob [19]. REMO uses the physical package of the global circulation model ECHAM4 and like all regional model, REMO requires initial and lateral boundary conditions to run.
River Discharge Data
Figure 2: Mean temperature and rainfall of White Volta catchment
Land cover
Area
Percentage
(km2)
area
59
56
Cropland Grassland
8
8
Savannah
36
34
Urban
1
1
wetland
2
Table 1: Land use Land cover distribution
B horizon that has a cation exchange capacity equal to or more than 24 cmol (+) kg-1 clay and a base saturation of 50 % or more throughout the B horizon to a depth of 125 cm [10]. The Luvisols of the catchment particularly those in the north have low nutrient content and unstable soil structure, thereby making them prone to slaking and erosion on sloping land [15]. Besides the Luvisols, Regosols, Vertisol and Lithosols are the other dominant soils found in the catchment. Regosols are soils from unconsolidated materials that are coarse texture. They are sensitive to erosion due to low coherence of the soil matrix material [16]. The regosols of the catchment have low water holding capacity and high permeability thereby making the soil prone to drought.
The discharge data were obtained from Ghana Hydrological Survey. Daily and monthly discharge data from Nawuni gauge station located on the main White Volta River were used for calibrating and validating because it has the longest period data of the catchment. The available discharge data was from the year 2000-2008. For the period 2000–2004, the gauging record was 98.7% complete. While for the period 2005–2008, the record was 97.4% complete. The missing data values were replaced statistically by similar day averages for the previous years where there were existing data values. Soil Type
Area (Km2)
Percentage Area
Luvisols
53
51
Regosols
17
16
Vertisol
8
7
Lithosols
15
14
Gleysol
3
2
Planosols
3
3
Acrisol
2
2
Cambisol
4
4
Table 2: Catchment soil type distribution
Climate Data The weather variables used for driving the hydrological balance are daily precipitation and minimum and maximum temperature data from 14 weather stations as shown in Figure 3 for the period 20012008, and were used as base line. The data were obtained from the Ghana Meteorological Services Department and the Direction de la Météorologie Nationale, Burkina Faso.
Climate Change Scenarios The climate change scenarios were obtained by downscaled General Circulation Models (GCM), regional projections of climate change based on those documented in Intergovernmental Panel on Climate Change [17]. Due to the rapid economic growth, global population and other factors, the Special Report on Emissions Scenarios, A1B (member of A1 family) which shows “a future world of very rapid economic growth, global population that peaks in mid-century and declines thereafter, and rapid introduction of new and more efficient technologies” [17]. It is distinguished from other scenarios by the J Earth Sci Clim Change ISSN:2157-7617 JESCC, an open access journal
Figure 3: Weather stations used
Volume 6 • Issue 1 • 1000249
Citation: Awotwi A, Kumi M, Jansson PE, Yeboah F, Nti IK (2015) Predicting Hydrological Response to Climate Change in the White Volta Catchment, West Africa. J Earth Sci Clim Change 6: 249. doi:10.4172/2157-7617.1000249
Page 4 of 7
Calibration Both manual and automatic calibration methods were used to calibrate the SWAT model, with discharge from Nawuni gauge station for the period January 1, 2001 - December 31, 2004. The model was warmed up using the data set from January 1, 2000 - December 31, 2000. The warm-up enables the model to cycle multiple times so as to minimize the effect of the user’s estimates of initial state variables. Prior to calibration, sensitivity analysis was performed on twenty-nine parameters. Nine most sensitive parameters; the initial SCS runoff curve number (CN2), soil evaporative compensation factor (ESCO), baseflow alpha factor (ALPHA_BF), threshold water depth in the shallow aquifer (GWQMN), Channel effective hydraulic conductivity (Ch_K2), Soil depth (SOL_Z), available water capacity (SOL_AWC), threshold depth of water in the shallow aquifer (REVAPMIN) and the Surface runoff lag time (SURLAG) were used for the calibration processes (Table 3). Statistical measures such as the Nash-Sutcliffe Efficiency (NSE) and the Coefficient of Correlation (R2) were used to describe and compare the observed and simulated discharge.
Model Performance Evaluation For the calibration to be accepted; (i) the coefficient of determination is (R2) (Eq1) should be greater than 0.60. (ii) the Nash-Sutcliffe model Efficiency (NSE) (Eq 2) should be greater than 0.50 The R2 and NSE are statistical tests used for accessing model predictive performance. The R2 gives information about the strength of the relationship between the models simulated data and the measured data, and ranges from 1 to 0, with 1 being the best fit between the simulated and the observed data. NSE is mostly used by hydrogeologists as a model performance evaluation criterion. It ranges from 1 to -∞. Value 1 of NSE corresponds to a best fit between modeled simulated data and measured data. n Qobs − Qobs Qsim − Qsim ∑ i =1 R2 = 0,5 n 0.5 2 2 n ∑ Qobs − Qobs ∑ Qsim − Qsim i =1 i =1
(
(
)(
)
n
NSE = 1 −
∑ (Q i =1 n
∑ (Q i =1
)
(
(1)
)
sim
− Qobs )
obs
− Qobs
2
)
(2)
2
accounting for water withdrawal for irrigation data, which would also affect the model. From Figure 5, there are over-estimated and under-estimated of the simulated calibrated results (high positive and negative residuals). These residuals are minimal. These errors may be caused by errors in measuring the input data and errors associated with the model. The under-estimation of the low flows may be attributed to more than one aquifer contributing to baseflow which can be handled in the SWAT model. By considering the residuals and the statistics results, the model is ready for validation analysis. The validation was performed on the calibrated SWAT model in the White Volta Catchment for the period January 1, 2005 - December 31, 2008. January 1 - December 31, 2005 data were used for warm up of the model. Even though the available series daily data for validation was not large, the validation result was reasonably good (Figure 6). The Figure 7 and statistical results; R2 of 0.82 and NSE of 0.79 obtained by the simulated daily discharge data and measured daily discharge data for the validation period showed that there is good agreement between simulated and observed flow. Even though the results indicate a good fit between the simulated and measured daily discharge, the residual plot (Figure 7) portrays some errors in the results. The reasons for these errors are similar to that of the calibration stated above. Thus the calibrated model with the set of optimized parameters can confidently be used.
Frequency statistics of RCM and observed climate data The frequency statistics of RCM was achieved by comparing the statistical properties of the downscaled daily data (1995-2008) with the daily observed data (1995-2008).with R2 of 0.92, NSE and 0.81 for temperature and R2 of 0.95 and NSE of 0.84 for precipitation, the Parameter
Sensitivity Rank
CN2
1
ESCO
2
ALPHA_BF
3
GWQMN
4
CH_K2
5
SOL_Z
6
REVAPMIN
7
SOL_AWC
8
SURLAG
9
CN2 = Iinitial Conservation Service (SCS) runoff curve number, ESCO= Soil evaporative compensation factor, ALPHA_BF= Base flow alpha factor, GWQMN = Threshold water depth in the shallow aquifer, CH_K2= Channel effective hydraulic conductivity , SOL_Z = Soil depth, REVAPMIN= Available water capacity, SOL_ AWC = Threshold depth of water in the shallow aquifer, SURLAG = Surface runoff lag time Table 3: Nine most sensitive parameter
Results and Discussions Calibration and validation The statistical analysis of the calibration results; R2 of 0.88 and NSE of 0.84 depict a good agreement between simulated and observed daily discharge. This was further shown in Figure 4, where the observed flow is in good agreement with simulated flow. The higher simulated flows recorded in all the hydrograph, Figure 4, may be due to the absence of input ET data for the SWAT model. The study area has one of the highest ET in the world, so for the model to actually minimize thedifference between measured and simulated streamflow, the recorded data is needed. The higher simulated flow can also be attributed to the lack of J Earth Sci Clim Change ISSN:2157-7617 JESCC, an open access journal
Figure 4: Calibration result of daily simulated and observed flows
Volume 6 • Issue 1 • 1000249
Citation: Awotwi A, Kumi M, Jansson PE, Yeboah F, Nti IK (2015) Predicting Hydrological Response to Climate Change in the White Volta Catchment, West Africa. J Earth Sci Clim Change 6: 249. doi:10.4172/2157-7617.1000249
Page 5 of 7 in agreement with the study done by Jung [23]. According to Table 4, the mean annual surface runoff increased from 111mm to 140 mm which represents 26%, in respond to a small increase of 8% of the mean annual precipitation and 1.7% of the mean annual temperature. The future monthly surface runoff does not differ significantly in pattern and quantity from that of the present (Figure 8).
Figure 5: Residuals from the calibration
The projected increase surface runoff resulted in an overall increase in future discharge. The pattern of monthly future scenario rainfall and discharge in the catchment is the same as the present scenario, but differs in amount (Figure 9). From Table 4, the catchment will experience increase in discharge. This is in agreement with the study conducted by Jung [23]. The simulated mean annual baseflow recorded an increase of 24% in response to the same increase in precipitation. This result will further enhance the occurrence and frequency of saturated soils resulting in high groundwater recharge and high flows of streams and may result in flooding.
Figure 6: Validation result of daily simulated and observed flows
According to Boubacar et al. [24], the mean annual ET value was found to be 6% lower than the observed, however the results from this study shows 6% increase in ET: from present value of 694 mm to future value of 735 mm (Table 4). The result is similar to Andreini et al. [25] who estimated the actual ET rates, as percentage of the total rainfall, for the Volta catchment to be 91%. Also Martin [26] estimated ET rates in the White Volta catchment to be with the range of 70-87% of the total rainfall. This is due to availability of more water at high temperature [27-34] (Figure 9).
Conclusion The hydrological model calibration and validation output showed that the SWAT model simulates the water balance dynamics well for Figure 7: Residuals from the validation analysis
downscaled climate data showed a good correlation with the observed The average yearly precipitation for RCM was 1200.3 mm as against 1101.4 mm for the observed. Thus the catchment can be regarded as being highly prone to the risk of drought according to the projections of REMO and some significant floods based on projected precipitation in the future. From the above statistics, the downscaled future climate data was assumed to be reliable for assessing the effect of future (20302043) climate change on hydrological processes in the White Volta Catchment. Before the future simulation, the model was run for the downscaled 1995-2008 data which represent the present (baseline) data.
Figure 8: Present and future mean monthly surface runoff and baseflow in the White Volta
Impact of climate change on hydrological processes Many climate change for West Africa projected increase in air temperature and precipitation during twenty first century [17,20,21]. Studies of these scenarios using the REMO model illustrated nonlinear responses in water balance components that have important management effects. Although Kasei [22], predicted decrease in rainfall and consequently decrease in the surface runoff from the Volta Basin water balance dynamics, simulated with WaSiM using REMO data. Our results projected increase in rainfall and surface runoff which is
J Earth Sci Clim Change ISSN:2157-7617 JESCC, an open access journal
Figure 9: Present and future mean monthly rainfall and discharge in the White Volta catchment
Volume 6 • Issue 1 • 1000249
Citation: Awotwi A, Kumi M, Jansson PE, Yeboah F, Nti IK (2015) Predicting Hydrological Response to Climate Change in the White Volta Catchment, West Africa. J Earth Sci Clim Change 6: 249. doi:10.4172/2157-7617.1000249
Page 6 of 7
Rainfall Baseflow
Surface runoff (mm) Discharge (mm)
AET
(m m)
(mm)
Baseline
984
139
111
260
694
Future
1061
173
140
313
735
% ∆
8
24
26
20
6
Table 4: Variation of the simulated mean annual baseline and future water components
the study area. The statistical results of calibration; R2 of 0.88 and NSE of 0.84, and that of the validation; R2 of 0.82 and NSE of 0.79 proved this fact. The study came out with an increase in future scenario climate precipitation and temperature of 8% and 1.7% respectively, resulting 26% and 24% increase in surface runoff and baseflow respectively in the catchment. This disproportionate change can be linked to the intensive precipitation events in future climates and the non-linear nature of ET, surface runoff, and groundwater flow. The study suggests that the relationship of annual stream flow to annual precipitation may not be the same in a future climate in that a small increase in precipitation will cause a larger increase in stream flow. This can be due to an increase in recycling of moisture more uniformly from year to year in a future climate. The study also suggests future availability of water resources in the catchment to increase aquifer recharge and runoff in the mist of increased ET driven by rising temperature. Our analysis suggests that the catchment could experience increase rainfalls, and hence become susceptible to even more severe floods conditions. This study also suggests that climate change may well impact the surface and ground water resources of the White Volta catchment, and the catchment may encounter a change in water balance components due to a change in river inflow in the forthcoming decades. This study has therefore demonstrated that the set-up and calibration of a semi-distributed hydrological model, SWAT, in a poor data collected rural West African catchment with variable land-cover, soils and topography can provide dependable results due to the present technology (satellite-based) of estimating rainfall and temperature values, with minimal additional input data, and extra attention to manual or automatic calibration. Acknowledgements The authors are grateful to Ghana Meteorological Services Department and the Direction de la Météorologie Nationale, Burkina Faso, Ghana Hydrological Services (GHS), Royal Institute of Technology (KTH, Sweden) and Council for Scientific and Industrial Research (CSIR), Ghana for their valuable collaborations.
References 1. Njissen B, O’Donnell GM, Hamlet AF, Lettenmaier DP (2001) Hydrologic sensitivity of global river to climate change. Climate Change 50: 143-175. 2. Zhang GH, Nearing MA, Liu BY (2005) Potential effect of climate change on rainfall erosivity in the Yellow River basin of China. Trans ASAE 48: 511- 517. 3. Vörösmarty CJ, Green P, Salisbury J, Lammers RB (2000) Global Water Resources: Vulnerability from Climate Change and Population Growth. Science Journal 289: 284-288. 4. Mohammed Y (2009) Climate change impact assessment on soil water availability and crop yield in Anjeni watershed Blue Nile basin. MSc dissertation, Arba Minch University, Ethiopia. 5. Mango LM, Melesse AM, McClain ME, Gann D, Setegn SG (2010) Land use and climate change impacts on the hydrology of the upper Mara River Basin, Kenya: results of a modeling study to support better resource management. Hydrol Earth Syst Sci 15: 2245–2258.
J Earth Sci Clim Change ISSN:2157-7617 JESCC, an open access journal
6. Liu X, Ren L, Yuan F, Singh VP, Fang X, Yu Z, et al. (2008) Quantifying the effect of land use and land cover change on green water and blue water in northern part of China. Hydrol Earth Syst Sci 5: 735-747. 7. Rajib MA, Rahman MM (2012) A Comprehensive Modeling Study on Regional Climate Model (RCM) Application-Regional Warming Projections in Monthly Resolutions under IPCC A1B Scenario. Atmosphere 3: 557-572. 8. Kasei RA (2009) Modelling impacts of climate change on water resources in the Volta Basin, West Africa. PhD dissertation, Rheinischen Friedrich-WilhelmsUniversität Bonn. 9. Oguntunde PG, Friesen J, Giesen N, Hubert HG, Savenije HHG (2006) Hydroclimatology of the Volta River Basin in West Africa: Trends and variability from 1901 to 2002. Physics and Chemistry of the Earth 31: 1180–1188. 10. FAO-UNESCO (1994) Soil map of the world-Revised Legend. Technical paper 20. Roma: FAO; Wageningen, the Netherlands: ISRIC. 11. Neitsch SL, Arnold JG, Kiniry JR, Williams JR, King KW (2002) Soil and Water Assessment Tool Theoretical Documentation, Version 2000. TWRI Report TR191. Texas Water Resources Institute, College Station, Texas. 12. Zhang X, Srinivasan R, Hao F (2007) Predicting hydrologic response to climate change in the Luohe River basin using SWAT model. A American Society of Agricultural and Biological Engineers 50: 901-910. 13. Di luzio M, Srinivasan R, Arnol DJG, Neitsch SL (2002) ArcView interface for Swat2000, Agricultural Research Service, Texas, US. 14. Setegn SG, Srinivasan R, Melesse AM, Dargahi B (2009) SWAT model application and prediction uncertainty analysis in the Lake Tana Basin, Ethiopia. Hydrology Process 23: 3738-3750. 15. Andreini M, Van de Giesen NC, Van Edig A, Fosu M, Andah W (2000) Volta basin water balance. ZEF discussion papers on development policy. Bonn, Germany. 16. Mando A (1997) The impact of termites and mulch on the water balance of crusted Sahelian soil. Soil Technology 11: 121-138. 17. IPCC – Intergovernmental Panel on Climate Change (2007) Climate Change: Synthesis Report, Cambridge Press, Cambridge, UK. 18. IPCC Climate Change (2001) Impacts, Adaptation and Vulnerability: Contribution of Working Group II to the Third Assessment Report of the Intergovernmental Panel on Climate Change. Cambridge University Press: Cambridge, UK. 19. Jacob D (2001) A note to the simulation of the annual and inter-annual variability of the waterbudget over the Baltic Sea drainage basin, Meteor. Atmosphere 77: 61-73. 20. Van de Giesen N, Liebe J, Jung G (2010) Adapting to climate changein the Volta Basin, West Africa. Current science 8: 1033-1037. 21. Mertz O, Mbow C, Reenberg A, Genesio L, Lambin EF, et al. (2011) Adaptation strategies and climate vulnerability in the Sudano-Sahelian region of West Africa. Atmospheric Science Letters 12: 104–108. 22. Kasei RA (2009) Modelling impacts of climate change on water resources in the Volta Basin, West Africa. PhD dissertation, Rheinischen Friedrich-WilhelmsUniversität Bonn. 23. Jung G (2006) Regional Climate Change and the Impact on Hydrology in the Volta Basin of West Africa. PhD dissertation. IMK-IFU. Garmisch-Partenkirchen, Germany. 24. Boubacar B, Obuobie E, Andreini M, Andah W, Pluquet M (2005) The Volta River Basin: Comparative study of river basin development and management. 25. Adwubi A, Amegashie BK, Agyare WA, Tamene L, Odai SN, et al. (2009) Assessing sediment inputs to small reservoirs in Upper East Region, Ghana. Lakes and Reservoirs: Research and Management 14: 279–287. 26. Martin N (2005) Development of a water balance for the Atankwidi catchment, West Africa - A case study of groundwater recharge in a semi-arid climate. PhD dissertation. University of Göttingen. 27. Christensen JH, Hewitson B, Busuioc A, Chen A, Gao X (2007) Regional Climate Projections, in Climate Change: The Physical Science Basis, Contribution of Working Group I to the Fourth Assessment Report of the Intergovernmental Panel on Climate Change, Cambridge University Press, Cambridge, UK and New York, USA.
Volume 6 • Issue 1 • 1000249
Citation: Awotwi A, Kumi M, Jansson PE, Yeboah F, Nti IK (2015) Predicting Hydrological Response to Climate Change in the White Volta Catchment, West Africa. J Earth Sci Clim Change 6: 249. doi:10.4172/2157-7617.1000249
Page 7 of 7 28. FAO-UNESCO: FAO-UNESCO (1974) Soil map of the World. Vol I, Legend. UNESCO, Paris. 29. Kasei CN (1990) A synopsis on the North of Ghana. Presented at the 2nd Workshop on improving farming systems in the savannah zone of Ghana. Nyankpala Agricultural College. Nyankpala – Tamale, Ghana. 30. Kunstmann H, Jung G (2003) Investigation of feedback mechanisms between Soil moisture, land use and precipitation in West Africa. IAHS publications. 31. Mearns LO, Giorgi F, Whetton P, Pabon D, Hulme M, et al. (2004) Guidelines for use of climate scenarios developed from regional climate model experiments, Tech. Rep. Data Distribution Centre of the IPCC.
32. Moussa R (2008) Significance of the Nash-Sutcliffe efficiency measure for linear rise and exponential recession in event based flood modelling. Geophysical Research Abstracts 10: 1-2. 33. Obuobie E (2008) Estimation of groundwater recharge in the context of future climate change in the White Volta River Basin. PhD dissertation, Rheinische Friedrich Wilhelms Universität, Bonn/ Germany. 34. Santhi C, Arnold JG, Williams JR, Dugas WA, Srinivasan R, et al. (2001) Validation of the SWAT Model on a Large River Basin with Point and Nonpoint Sources. Journal of the American Water Resources Association 37: 1169-1188.
Submit your next manuscript and get advantages of OMICS Group submissions Unique features: • • •
User friendly/feasible website-translation of your paper to 50 world’s leading languages Audio Version of published paper Digital articles to share and explore
Special features:
Citation: Awotwi A, Kumi M, Jansson PE, Yeboah F, Nti IK (2015) Predicting Hydrological Response to Climate Change in the White Volta Catchment, West Africa. J Earth Sci Clim Change 6: 249. doi:10.4172/2157-7617.1000249
J Earth Sci Clim Change ISSN:2157-7617 JESCC, an open access journal
• • • • • • • •
400 Open Access Journals 30,000 editorial team 21 days rapid review process Quality and quick editorial, review and publication processing Indexing at PubMed (partial), Scopus, EBSCO, Index Copernicus and Google Scholar etc Sharing Option: Social Networking Enabled Authors, Reviewers and Editors rewarded with online Scientific Credits Better discount for your subsequent articles
Submit your manuscript at: www.omicsonline.org/submission
Volume 6 • Issue 1 • 1000249