MARINE ECOLOGY PROGRESS SERIES Mar Ecol Prog Ser
Vol. 436: 17–28, 2011 doi: 10.3354/meps09240
Published August 31
Predicting trophic guild and diet overlap from functional traits: statistics, opportunities and limitations for marine ecology C. Albouy1, 2,*, F. Guilhaumon1, 3, 5, S. Villéger1, M. Mouchet1, L. Mercier1, J. M. Culioli4, J. A. Tomasini1, F. Le Loc’h2, D. Mouillot1, 6 1
Univ Montpellier 2 CC 093, UMR 5119, CNRS-UM2-IRD-IFREMER-UM1 ECOSYM, 34095 Montpellier, France 2 IRD, UMR 212 EME, IRD IFREMER UMII, avenue Jean Monnet 34203 Sète cedex, BP 171, France 3 ’CITA-A (Azorean Biodiversity Group), Terra-Cha, Angra do Heroısmo, 9700-851, Terceira, Azores, Portugal 4
Office de l’Environement de Corse, Reserve Naturelle des Bouches de Bonifacio, 20250 Corte, France ’Rui Nabeiro’ Biodiversity Chair, CIBIO - Universidade de Évora. Casa Cordovil, Rua Dr. Joaquim Henrique da Fonseca, 7000-890 Évora, Portugal 6 ARC Centre of Excellence for Coral Reef Studies, James Cook University, Townsville, Queensland 4811, Australia
5
ABSTRACT: Fish diets provide information that can be used to explore and model complex ecosystems, and infer resource partitioning among species. The exhaustive sampling of prey items captured by each species remains, however, a demanding task. Therefore, predicting diets from other variables, such as functional traits, may be a valuable method. Here, we attempted to predict trophic guild and diet overlap for 35 fish species using 13 ecomorphological traits related to feeding ecology. We compared linear discriminant analysis and random forest (RF) classifiers in their ability to predict trophic guild. We used generalized dissimilarity modelling to predict diet overlap from functional distances between species pairs. All models were evaluated using the same cross-validation procedure. We found that fish trophic guilds were accurately predicted by an RF classifier, even with a limited number of traits, when no more than 7 guilds were defined. Prediction was no longer accurate when finer trophic guilds were created (8 or more guilds), whatever the combination of traits. Furthermore, predicting the degree of diet dissimilarity between species pairs, based on their ecomorphological traits dissimilarities, was profoundly unreliable (at least 76% of unexplained variation). These results suggest that we can predict fish trophic guilds accurately from ecomorphological traits, but not diet overlap and resource partitioning because of inherent versatility in fish diets. More generally, our statistical framework may be applied to any kind of marine organism for which feeding strategies need to be determined from traits. KEY WORDS: Generalized dissimilarity modeling · Mediterranean · Fish · Non-linear model · Random forest · Versatility Resale or republication not permitted without written consent of the publisher
Knowledge of species’ diets is a core issue in both fundamental and applied ecology. Indeed, most ecosystem modelling approaches, such as Ecopath with Ecosim (Pauly et al. 2000, Christensen & Walters 2004) or Loops (Levins 1975, Bodini 1998), require integration of the trophic links in food webs. Other quantita-
tive approaches rely on knowledge of the trophic level of species, which necessitates investigation of their diet composition (e.g. Cortes 1999). More generally, gathering species into guilds or functional groups according to their prey items has been recognized as useful in simplifying and modelling highly complex ecosystems (Garrison & Link 2000, Vander Zanden & Vadeboncoeur 2002, Coll et al. 2006) and in develop-
*Email:
[email protected]
© Inter-Research 2011 · www.int-res.com
INTRODUCTION
18
Mar Ecol Prog Ser 436: 17–28, 2011
ing biotic indicators relevant to human impacts (SosaLopez et al. 2005). In addition, overlap in diet composition and resource partitioning between species is a key element of interspecific competition that can determine stable coexistence (Sala & Ballesteros 1997, Colloca et al. 2010). Determining the level of diet overlap among species is, therefore, also a major tool in predicting extirpations of species as a result of competitive interactions with invasive species (Karlson et al. 2007, Glen & Dickman 2008, Arismendi et al. 2009, Gregory & Macdonald 2009, Zeug et al. 2009). In practice, identifying the diet composition of species is a very time-consuming and demanding task with many potential biases. Indeed, a complete knowledge of prey items targeted by omnivorous species is unrealistic in prey-rich communities (Araújo et al. 2008). Diet composition is often assessed using stomach contents, which are influenced by many temporal (Lehikoinen 2005, Horppila 2009) and spatial factors (e.g. opportunistic behaviors; Link & Garrison 2002). Hence stomach content analysis is a time-consuming method that can only provide a fragmentary image of a species’ diet. An alternative approach to investigate dissimilarity in diet composition among species is to study ecomorphological traits used for feeding. This approach has been particularly favoured in fish ecology since the seminal papers of Keast & Webb (1966) and Gatz (1979) but also in the study of benthic invertebrates (Bremner et al. 2003, Danovaro et al. 2008). Reliable morphological indicators of food consumption have been gathered in both empirical (e.g. Ibanez et al. 2007) and laboratory studies (e.g. Winemiller & Taylor 1987). For example, intestine lengths and gill raker morphology are known to be discriminant features among herbivorous, carnivorous and omnivorous fishes (Gatz 1981, Bowen 1983, Castillo-Rivera et al. 1996). Apart from these classical examples, however, evidence of a clear relationship between ecomorphological characteristics and fish diets has been mixed, and even when statistically significant, is often rather weak and of questionable biological importance (Ibanez et al. 2007). Thus, previous studies have reported significant relationships between ecomorphological characteristics and fish diets (Norton 1991, Wainwright & Richard 1995, Ward-Campbell et al. 2005, Maldonado et al. 2009) whereas others have failed to find such relationships (Labropoulou & Markakis 1998, Barnett et al. 2006, Bellwood et al. 2006). The accuracy of diet prediction from ecomorphological traits is of crucial importance in fish ecology because it determines the extent to which unknown diets of some fishes can be predicted from known diets of functionally similar species. Most of these studies used linear discriminant analyses (LDA) and retained
only one set of ecomorphological traits to predict diets, i.e. the set including all of the traits considered a priori relevant to the analysis. Such analyses are likely to reveal only a limited proportion of the explanatory power because particular combinations or subsets of traits may determine fish diets, and most ecomorphological traits will not relate linearly with prey item characteristics (Kramer & Bryant 1995). However, the relevance of many ecomorphological traits in diet assessment, such as gill raker morphology, is still debated (Tanaka et al. 2006), and particular subsets of traits may perform better than extensive collections in predicting diets. Moreover, because no universal ecomorphological trait has yet been shown to explain fish diet, the overlooked question of what represents the best combination of traits is still open. Here, we present a statistical framework to study the links between species diet and functional traits. Through an extensive analysis including all possible combinations among 13 ecomorphological traits, used as predictors for linear as well as non-linear models, we tested the predictability of trophic guild and diet overlap for 35 Mediterranean fish species. We discuss the opportunities and the limitations of the approach but also the broader perspectives that this framework could offer to marine ecology.
MATERIALS AND METHODS Data. Fish collection: The fish species were sampled in the Bonifacio Strait Natural Reserve (80 000 ha; Corsica Island, France, Mediterranean Sea) in 2004 and 2005 (Mouillot et al. 2008). This marine protected area, created in September 1999, is characterized by a predominantly rocky substrate and Posidonia oceanica seagrass beds at shallow depths (~35 m). Adult specimens were captured by artisanal fishermen within or near the marine protected area (Mouillot et al. 2008). Sampling was organized to collect 10 individuals (on average) of 35 fish species belonging to 17 families and 6 orders (1 Anguilliformes, 1 Clupeiformes, 2 Gadiformes, 11 Perciformes, 1 Pleuronectiformes and 1 Zeiformes). Those species cover the full range of trophic guilds: piscivores (e.g. Sphyraena sphyraena and Scorpaena scrofa), planktivores (e.g. Boops boops), herbivores (e.g. Sarpa salpa) and benthic invertebrate feeders (e.g. Mullus surmuletus). The full list of species is provided in Table S1 in the supplement at www.intres.com/articles/suppl/m436p017_supp.pdf. Diet data and ecomorphological traits: Fish diets were obtained from published data based on stomach contents of adult individuals (see Table S1 in the supplement). We obtained quantitative data, i.e. the percentage of each item in each fish diet. When the literature provided un-
Albouy et al.: Predicting diet from functional traits
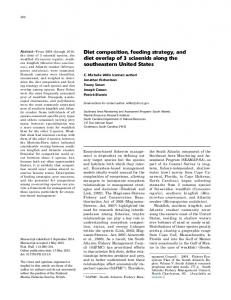
defined dietary categories, such as ‘other’ or ‘unidentified’, data were re-expressed (out of 100%). Unidentified items were always negligible (generally less than 1%) compared with other categories. Thirteen ecomorphomogical traits were estimated for each individual (see Table S2 in the supplement at www.int-res.com/articles/suppl/m436p017_supp.pdf), encompassing a variety of strategies used by fishes for food acquisition (Table 1). As a first step, 17 morphoanatomical measures (Fig. 1) were estimated for each individual. The 13 functional traits (Table 1) were then derived from these morpho-anatomical measures. The second step was to calculate mean trait values for each species from the individual measurements. These continuous traits are the most commonly used in ecomorphological studies on fishes (Sibbing & Nagelkerke 2001, Dumay et al. 2004, Mason et al. 2007, Villeger et al. 2010). Moreover, our set of traits was not designed for a restricted family or morphology, so it could potentially be applied in any study of fish communities (Mouillot et al. 2007, Mason et al. 2008). We acknowledge that the list of traits is not exhaustive and that some more sophisticated traits were not
19
included (Bellwood et al. 2006). We focused, however, on traits that were both easily measurable and commonly used as proxies of diets. Statistical analyses. Trophic guild classification: Classifying species into trophic guilds remains controversial because the level of similarity/dissimilarity used for defining groups can be very subjective. To overcome this limitation, we first calculated pairwise Bray-Curtis dissimilarities between species based on quantitative diets. Then we used the k-means algorithm to create k guilds such that the fishes within each guild were more similar to one another than to fishes in other guilds with respect to their quantitative diets (Legendre & Legendre 1998). Nine gradually more precise trophic classifications were tested for the 35 fish species, comprising from 2 to 10 trophic guilds. Trophic guild prediction: We tested the ability of 2 multivariate classification methods, LDA and random forest (RF), to predict the partitioning of fish species into trophic guilds according to their functional traits. The purpose of LDA is to predict the membership of statistical units (here fish species) to predefined classes (here trophic guilds) by building discriminant axes that
Table 1. List of 13 functional traits derived from 17 morphological measures (see Fig. 1 for definitions) with abbreviations and calculations Functional trait
Abbreviation
Oral gape surface
Osf
Oral gape shape
Osh
Oral gape position
Ops
Protrusion
Pro
Gill raker length
GRlst
Eye size
Edst
Eye position
Eps
Body transversal shape
Bsh
Body transversal surface
Bsf
Calculation Mw × Md Bw × Bd Md Mw Mo Hd
Pro GRl Hd Ed Hd Eh Hd Bd Bw ln
(( π4 × Bw × Bd) +1) ln ( B+1)
Pectoral fin position
PFpsa
Caudal peduncle throttling
CPt
Gut length
Glst
Biomass a
B
PFi PFb CFd CPd Gl Bl
B
Ecological meaning Nature/size of items captured (adapted from Karpouzi & Stergiou 2003) Method to capture food items (Karpouzi & Stergiou 2003) Feeding position in the water column (adapted from Sibbing & Nagelkerke 2001) Relative to capacity and efficiency of the capture (Sibbing & Nagelkerke 2001) Filter feeding ability or gill protection (adapted from Sibbing & Nagelkerke 2001) Prey detection (adapted from Boyle & Horn 2006) Vertical position in the water column (Gatz 1979) Vertical position in the water column and hydrodynamism (Sibbing & Nagelkerke 2001) Hydrodynamism (mass distribution along the body) Pectoral fin use for maneuverability (Dumay et al. 2004) Caudal propulsion efficiency through reduction of drag (Webb 1984) Processing of energy poor resources such as vegetation and detritus (residence time of food) (Kramer & Bryant 1995) Contribution to environment via metabolism
Flatfishes were considered without functional pectoral fins, so PFps was fixed to 0 for these species
20
Mar Ecol Prog Ser 436: 17–28, 2011
sifier: one in the initial selection of individuals (here fish species) for the building of each tree, and one in the selection of the ecomorphological trait used for group splitting at each node. A final guild prediction for a given species is obtained by running that species down the 500 trees of the classifier (i.e. the forest) and using a majority rule to average this ‘forest’ of votes. LDA and RF models were constructed using standardized data (see Fig. S1 in the supplement at www.int-res.com/ articles/suppl/m436p017_supp.pdf) in order to assign equal weights to each Fig. 1. Morphological traits were measured on fish using electronic calipers. functional trait. All possible combina(A) Side view. (B) Mouth gape. (C) Front view. Bd: body depth; Bl: body stantions of traits were created (for trait numdard length; Bw: body width; CFd: caudal fin depth; CPd: caudal peduncle bers ranging from 1 to 13) in order to minimal depth; Ed: eye diameter; Eh: distance between the bottom of the investigate both the influence of the head and the eye center along the head depth axis; Hd: head depth along the number of traits and the identity of traits vertical axis of the eye; Md: mouth depth; Mw: mouth width; PFb: body depth at the level of the pectoral fin insertion; PFi: distance between the insertion of on LDA and RF predictive accuracy. pectoral fin and the bottom of the body; Pro: stretched protrusion length. Also For comparative purposes, LDA and measured, but not shown in diagrams — GRl: gill raker length; Gl: gut length RF models were both evaluated using the same cross-validation procedure. For are linear combinations of the predictor variables (here each combination of traits, the data set was split into 2 functional traits), maximizing the standard deviation of parts: 30 randomly chosen species were used to calibetween-class dispersion and minimizing within-class brate the models whereas the 5 remaining species dispersion by projection (Fisher 1936). LDA is an effiwere used for model evaluation. Model accuracies cient method when assumptions for linear discriminawere obtained from confusion matrices with the mean tion are met (i.e. classes can be separated by lines in 2 percentage of correct assignments as a criterion (Kodimensions, by planes in 3 dimensions and by hyperhavi & Provost 1998). The procedure was repeated 10 planes in higher dimensional spaces). Potential drawtimes for each model, to account for the stochastic backs to LDA include weak performance when groups aspect of the algorithm and thus obtain robust estiare strongly nested and a tendency towards overfitting mates of model accuracy. (Dixon & Brereton 2009). Diet overlap modeling: We used generalized dissimAs an alternative to LDA, we implemented RF classiilarity modeling (GDM) to investigate the relationship fiers, which represent a powerful tool (Biau et al. 2008), between fish diet dissimilarities (Bray-Curtis distance) free of any assumption on data distribution, that has and ecomorphological traits dissimilarities (Euclidean been applied in various different ecological fields distance). GDM is a multivariate extension of the pop(Perdiguero-Alonso et al. 2008, Oppel et al. 2009, ular Mantel approach (Legendre 1993), and was iniCatherine et al. 2010, Mercier et al. 2011). No applicatially developed to model patterns of differentiation in tion to trophic guild discrimination has, however, been community composition in relation to differentiation in performed using this method. Classification with RF is environmental data (Ferrier et al. 2007). Nevertheless, based on the averaging of a large number of classificaGDM is a flexible method that can be adapted to tion trees (Breiman 2001). Each classification tree accommodate a variety of ecological data (Ferrier et al. recursively split a bootstrap data set into binary groups 2007). until the terminal nodes of the tree contain only a Particularly suitable for ecological studies (Ferrier et unique species. Group splitting at each node is carried al. 2007), GDM is able to accommodate 2 types of out by searching among a random subset of predictors recurrent non-linearity. First, GDM can take into (here functional traits), the one that maximizes homoaccount the predicted curvilinear and asymptotic relageneity within each of the 2 groups defined by each tionship between fish dietary dissimilarities, measured node. Five hundred trees were built, each using a difwith the Bray-Curtis index, and their functional disferent data set obtained by bootstrap re-sampling with tances. Indeed, as the functional difference between 2 replacement in the original data set. Thus, 2 levels of species increases, these species may feed on progresrandomisation occurred in the building of the RF classively fewer common prey until they exhibit totally dif-
Albouy et al.: Predicting diet from functional traits
21
ferent diets; the Bray-Curtis index then reaches an asymptotic value of 1 that will remain unchanged regardless of any further increment in the functional distance. GDM takes into account this non-linear relationship by using a link function (Eq. 1) to model the asymptotic relationship between the predicted response (diet dissimilarity between fish species), δ and the ‘multi-predictor combination’ (multivariate functional distance between fish species, ζ: (1)
δ = 1 − e−ζ
GDM also considers a second type of non-linearity related to the increasing rate of dietary turnover along functional trait ranges. This non-linearity is accounted for by fitting flexible functions (I-spline combinations, ƒ) to the functional variables, then using distances between fish species, measured from these functions ƒ, as predictors of the link-transformed dietary dissimilarity. The general form of the model is therefore (see Ferrier et al. 2007 for more details): ζ=α +
P
∑ƒ
p
( x pi ) − ƒp ( x pj )
(2)
p=1
where P is the number of predictors (functional traits). α (the intercept) is the estimated value of the link function for 2 species i and j that have identical values for all explanatory variables and when back-transformed with the inverse link function, it gives an estimate of the expected compositional dissimilarity for 2 species that do not differ in their functional traits (Overton et al. 2009). Each of the P functions is defined as a linear combination of I-splines: ƒp (x p ) =
K
∑a
I
pk pk
(x p )
(3)
k= 1
where K is the number of I-splines estimated for each functional trait, Ipk is the kth I-spline for functional trait xp and apk is the fitted coefficient for Ipk, subject to the constraint apk ≥ 0 The modelling approach was similar to the one applied for the trophic guild prediction procedure (exhaustive comparison of models constructed with all combinations of traits) with the percentage of explanation (deviance) as a criterion (for more details see Fig. S2 in the supplement at www.int-res.com/articles/ suppl/m436p017_supp.pdf). Software: LDA and RF model were implemented using the MASS and RandomForest packages, respectively, in the R statistical environment (R Development Core Team 2008). The PCA was performed using the PCA function in the FactoMineR package. For GDM, we used a package which has been proposed by Ferrier et al. (2007) and modified to account for non-integer abundance data (S. Ferrier et al. pers. comm.).
Fig. 2. Comparison of performance between linear discriminant analyses (LDA) and random forest (RF) models, for 3 classifications — (A) 3 guilds, (B) 6 guilds and (C) 10 guilds — and each combination of traits. RF and LDA are represented by circles and squares, respectively. Maximum (continuous line), minimum (dashed line) and mean (dotted line) percentage of correct fish assignment are provided for each level of combination of traits
22
Mar Ecol Prog Ser 436: 17–28, 2011
Table 2. Mean (± SD) maximum percentage of correctly classified fish species into trophic guilds for 2 discriminant methods and different numbers of trophic guilds. Only the best combination of traits is provided. Trait abbreviations are given in Table 1. The trait with the highest occurrence in best combinations is in bold, whereas the one with the lowest occurrence is in italic Method
Random forest
LDA
No. of Correct trophic guild assignguilds ment (%) 2 3 4 5 6 7 8 9 10 2 3 4 5 6 7 8 9 10
No. of traits
0.98 ± 0.06 0.92 ± 0.1 0.90 ± 0.11 0.70 ± 0.24 0.74 ± 0.16 0.74 ± 0.19 0.60 ± 0.25 0.56 ± 0.18 0.48 ± 0.14 0.96 ± 0.08 0.92 ± 0.14 0.80 ± 0.19 0.62 ± 0.15 0.64 ± 0.21 0.66 ± 0.16 0.58 ± 0.18 0.54 ± 0.25 0.46 ± 0.19
7 8 4 6 7 9 8 6 6 3 7 5 8 5 4 7 8 6
Traits
B Bsh CPt Edst Ops Osf Osh Bsf Bsh Eps GRlst Pro Ops Osf Osh Bsh CPt GRlst Osf Bsf Bsh Eps Glst Grlst Ops B Bsh CPt Edst Eps Glst Pro B Bsh CPt Eps GRlst Glst Osf Pfps Pro B Bsh Edst CPt GRlst Glst Eps Pro Bsf Edst Ops Osf Pfps Pro Bsf Edst Eps Glst Ops Pro Bsf Cpt Eps B Bsf Bsh Cpt Glst Ops Osh Bsf Edst Ops Osf Osh B Bsh CPt Eps Glst Ops Pro Bsf Bsh GRlst Eps Pro Osf Bsh GRlst Ops Pro Bsf Edst Eps Ops Osf PFps Pro B Bsh Edst GRlst Osf Osh Ops PFps Bsh Edst Eps GRlst Osf Pro
methods. On average, RF predicted trophic guild slightly more accurately than LDA. Comparing the maximum percentages of correct assignments between RF and LDA for each classification (from 2 to 10 guilds), we obtained higher percentage values for RF than for LDA (Table 2). The best predictive accuracy for trophic guild was not obtained with the full collection of traits (Fig. 2). For example, the maximum percentage of species correctly classified into 4 trophic guilds was obtained with only 4 traits (body transversal shape, caudal peduncle throttling, gill raker length and oral gape surface) for the RF model. Some traits, such as body transversal surface, were more often present (13 times among 20) in the best combinations than others, for example pectoral fin position (4 times among 20; Table 2).
RESULTS Prediction of diet dissimilarity Prediction of trophic guild The k-means classifications yielded clustering that corresponded to well-identified trophic guilds such as piscivores, planktivores and benthic invertebrate feeders (for more details on guild compositions see Table S3 in the supplement at www.int-res.com/articles/ suppl/m436p017_supp.pdf). The mean percentage of correct assignments decreased with increasing number of guilds (Fig. 2, Table 2): almost all species were correctly classified into 2 trophic guilds whereas less than half of species were correctly assigned to 10 trophic guilds. We evaluated the relative predictive ability of RF and LDA by comparing their minimum, mean and maximum rates of correct assignments along the gradient of the number of traits used as predictors. We exemplify 3 classifications out of 9 representing increasing degrees of precision in the trophic classification (3, 6 and 10 trophic guilds; Fig. 2). For a low number of trophic guilds (3; Fig. 2A) and 8 traits, the maximum percentage of correct assignments was 92% for LDA and RF. For an intermediate number of trophic guilds (6; Fig. 2B), the percentage of correct assignments decreased to 74% for RF and 64% for LDA. Considering a larger number of trophic guilds (10; Fig. 2C) and 6 traits, the maximum percentage of correct assignments fell below 50% for both modelling
Overall, the percentage of explained deviance in diet dissimilarity increased as the number of functional traits considered increased. However, for a given size of the predictors set, there was a substantial variability in the explained deviance in Bray-Curtis dissimilari-
Fig. 3. Percentage of deviance explained by all generalized dissimilarity modelling models for all combinations of traits
23
Albouy et al.: Predicting diet from functional traits
For the classification into 3 trophic guilds (Fig. 5B), planktivorous fishes such as Sardinella pilchardus, Atherina sp. and Boops boops and piscivorous fishes such as Dentex dentex, Zeus faber and Conger conger were clearly discriminated. For the classification into 6 trophic guilds (Fig. 5C), species belonging to different trophic guilds were not clearly discriminated except the planktivorous, piscivorous or benthic invertebrate feeders, for which functional traits were relatively similar within the trophic guild.
DISCUSSION Prediction of trophic guild The results reveal that both LDA and RF could discriminate the principal fish trophic guilds on the basis of functional traits but only to a certain extent. With a fine classification (10 groups), the model Fig. 4. GDM model output summarizing the relationship between diet dispredictions were not accurate, regardless similarity and trait dissimilarity (6 traits considered, see ‘Discussion’) for all pairs of fish species. A (Liza aurata, Zeus faber), B (Diplodus sargus, Diploof the combination of traits (Fig. 2). The dus vulgaris), C (Zeus faber, Sphyraena sphyraena) and D (Symphodus ecomorphological traits used in this study tinca, Diplodus annularis) represent remarkable examples of species (in any combination) were not effective in couples (see ‘Discussion: Prediction of diet overlap’) predicting finely defined trophic guilds, ties. For instance, the explained deviance had a minimainly because fishes sharing similar traits may have mum of 2.4% for 6 traits but reached a maximum of very different diets (Figs. 4 & 5). Nevertheless, with a 24% (Fig. 3) for the combination including the followtrophic classification based on 3 guilds (piscivores, planktivores and others), LDA and RF models correctly ing traits: oral gape position, eye position, biomass, assigned 92% of species when using the optimal comprotrusion, gut length and oral gape shape. This GDM model with 6 traits shows an asymmetric bination of traits (Table 2). Some combinations accurelation between functional and trophic dissimilarities rately predicted wide trophic guilds, suggesting a link (Fig. 4). Two species whose functional attributes were (albeit weak) between diet and morphology. Interesthighly dissimilar (between 1.7 and 2.5) could not have ingly, 90% of correct assignments were reached when the same diet (the empty bottom right triangle of fishes were divided into 4 trophic guilds (to piscivores, Fig. 4). More generally, most of the species pairs with planktivores, benthic invertebrate feeders and others) highly dissimilar traits, such as Zeus faber and Liza using only 4 traits (Bsh, Cpt, Grlst and Osf; see Table 1) and the RF model. aurata (point A in Fig. 4), also had highly dissimilar diets. Conversely, species with small functional differThis result has important implications because it ences in traits (from 0.5 to 1) may have either very simindicates that we can accurately predict fish trophic ilar (point B in Fig. 4) or totally different diets (point C guilds from a few suitable ecomorphological traits in a in Fig. 4; observed dissimilarity of 1). model that accounts for complex interaction structures in the data. Thus, for example, in species-rich assemblages where the description of diet items for all the PCA analysis species is highly demanding, the measurement of a short set of suitable morpholological traits would allow To illustrate the relationships between ecomorphoan investigator to assign fish species to major trophic logical traits and trophic guild, we mapped 2 k-means guilds. trophic classifications (3 and 6 guilds; Fig. 5B,C) on the The study of trophic guilds may identify converfirst plane of a PCA of ecomorphological traits (45.24% gence in the trophic structure of fish communities from of inertia; Fig. 5A). different regions (Mathieson et al. 2000, Boyle & Horn
24
Mar Ecol Prog Ser 436: 17–28, 2011
2006, Irz et al. 2007) and thus identify commonalities in the response of fish communities to various impacts (Munoz & Ojeda 1997, Garrison & Link 2000). The prediction of trophic guilds could also be very useful for the creation of trophic groups to be used in ecosystem modelling approaches. Models such as Loops (Levins 1975) are based on a qualitative approach, whereby interactions between species are represented by the nature of predation without a requirement to quantify the prey ingested. In this context, species could be assigned to broad trophic guilds without knowing their precise diets, just by measuring a relevant combination of easily measurable functional traits. Our results are in accordance with previous studies that demonstrated weak relationships between diet and functional traits in birds (Hormada et al. 2003) and fish (Wainwright et al. 2002, Boyle & Horn 2006, Ibanez et al. 2007), and more precisely for apogonid (Bellwood et al. 2006), chaetodontid (Motta 1988) and cichlid fishes (Barel 1982). In the present study, this weak link is illustrated by members of the Diplodus genus (D. vulgaris and D. annularis) which have common morphological attributes (highly oval body, laterally flat body, similar fins; Miniconi 1994) but are widely divergent in their diet (Rosecchi 1983, Sala & Ballesteros 1997). Similarly, Fig. 5 shows that the herbivorous Sarpa salpa is grouped with other species that are detritivorous (e.g. Mullus surmuletus).
Prediction of diet overlap The best compromise between the number of traits and the percentage of explained deviance by a GDM model was obtained with 6 traits, which explained up to 24% of the deviance. This weak relationship tells us that we cannot rely on ecomorphological traits to predict the level of competitive interactions driven by diet overlap, for which the study of fish stomach and gut contents therefore remains a necessity (Declerck et al. 2002, Mookerji et al. 2004). Despite the low ability of GDM to predict diet overlap, we obtained a clear pattern that revealed the triangular relationship between diet and traits dissimilarities: species with very different ecomorphological Fig. 5. PCA of 13 traits measured in 35 Mediterranean fish species. Coloured polygons illustrate the output of k-means partitioning carried out on diets. (A) Correlation circle of traits; (B) k-means partitioning into 3 trophic guilds (black: piscivorous; green: planktivorous; red: others); (C) k-means partitioning into 6 trophic guilds (black: piscivorous; green: planktivorous; red: benthic invertebrate feeders; purple: benthic invertebrate feeders; blue: macrocarnivorous; yellow: other. For trait abbreviations see Table 1
Albouy et al.: Predicting diet from functional traits
traits (functional distance > 2) could not have a similar diet. For instance, Zeus faber, a demersal piscivorous fish with a very laterally compressed body and rudimentary gill rakers, has a totally different diet from Liza aurata, a benthic detritivorous fish with an elongated fusiform body (point A in Fig. 4). These 2 fish species are not in competition for food resources, as revealed by the high trait dissimilarity linked to a high diet dissimilarity. By contrast, Diplodus sargus and D. vulgaris (point B in Fig. 4) are very similar species in terms of both diet and traits. They share 9 prey items: gastropods, molluscs, decapods, amphipods/isopods, polychaetes, echinoderms, cnidarians/sponges, plants and macroalgae (Rosecchi & Nouaze 1987, Sala & Ballasteros 1997). The strong diet overlap (diet dissimilarity = 0.005) between these 2 species and their potential competitive interaction for resources (if limiting) can, therefore, be predicted from their ecomorphological traits. We found an overall weak relationship between diet dissimilarity and trait dissimilarity, which can be illustrated with many examples. For instance, Symphodus tinca and Diplodus annularis have strong morphological similarity but rather different diets (point D in Fig. 4). Indeed, although they share some common prey items (polychaetes, decapods and molluscs), they show marked differences for others: S. tinca feeds on macrophytes whereas D. annularis feeds on small fish and eggs. Thus, although traits may provide a false signal of intense competition for resources, diet overlap may reveal the opposite, with clear partitioning. The relationship between diet dissimilarity and trait dissimilarity is asymmetric (Fig. 4), and caution is therefore required in predicting diet dissimilarity from trait dissimilarity because species with similar traits may have either none or all of their prey items in common.
Sources of unexplained variation The relative lack of explanatory power in the present study may derive in part from our collection of traits. Although the list is widely used in the literature, it may need to be extended to include other traits that are more directly related to food acquisition. This issue of trait choice has been debated by ecomorphologists for many decades, particularly for birds (James 1982) and fishes (e.g. Gatz 1979), without reaching a consensus. Barnett et al. (2006) and Bellwood et al. (2006) proposed more sophisticated ecomophological traits such as the lower jaw length and head length (tip of premaxilla to posterior margin), but were nonetheless unable to find a clear match between these traits and diet. Qualitative traits, such as the structure of the teeth (Portz & Tyus 2004), could also be used to in-
25
crease the ability to discern diet overlap. Even with these ‘simple’ traits, we obtain similar levels of prediction to those found in previous studies that included more sophisticated traits. The limited success of models in correctly assigning fish species to the correct guild, when these are more finely defined and their number increases, could be due to at least 3 sources of variation that were untestable in our study. Firstly, the boundaries between guilds are less clear (Table S2 in the supplement) and the uncertainty in associating fishes to guilds increases as guild number increases. Secondly, fewer species can be assigned to each guild and the sampling for traits associated with each diet category is therefore less effective. Thirdly, our study ignores potential variation in diets caused by differences in foraging patterns, habitat partitioning and other behavioural factors (Wainwright & Reilly 1994, Luczkovich et al. 1995).
CONCLUSIONS Many studies have tried to predict species’ diets from functional traits or phylogeny, for both applied and theoretical objectives. The weak relationships that have typically been found (e.g. Bohning-Gaese & Oberrath 1999, Boyle & Horn 2006) indicate an intrinsic unpredictability of diets caused by a degree of versatility (Bellwood et al. 2006) that cannot be modelled and/or suffers from methodological limitations, including non-linear effects and large numbers of trait combinations. The present study on 35 species comprised much of the dietary diversity among Western Mediterranean fishes, for which precise diets and ecomorphological traits related to food acquisition were known. We showed that the RF modelling technique, which can account for complex interaction structures in the data, can accurately predict fish trophic guilds when these are quite general (up to 7 groups), even with a limited number of traits. The accurate prediction of fine trophic guilds (8 groups and more) cannot, however, be achieved, regardless of the combination of traits considered. In a similar manner, we were not able to predict the level of diet overlap between fish species pairs based upon similarity in ecomorphological traits. Therefore, our study reinforces the versatility hypothesis of Bellwood et al. (2006), but also reveals that general trophic guilds can be predicted from just a few functional traits, which may be very useful in simplifying the modelling of complex aquatic systems. Beyond the scope of fish ecology, our study exemplifies a statistical framework that may be relevant for other marine organisms. For example, the functional diversity of benthic invertebrate fauna, which is important for both coastal and deep-sea ecosystem function-
Mar Ecol Prog Ser 436: 17–28, 2011
26
ing, can be measured as the number of different trophic roles played by the benthic species and can be inferred from the diversity in morphofunctional traits (Danovaro et al. 2008). Furthermore, the recovery of benthic communities from trawling or pollution could also be investigated through a guild approach (Colvard & Edmunds 2011, Rimet & Bouchez 2011), where the assignment of individuals to feeding guilds, using functional traits, may be less time-consuming and financially costly than individual species identification. One might also be able to monitor the temporal recovery of a damaged benthic community by looking at changes in the types or guilds of fish that feed in the area. For instance, some fish species might feed on the normal, undamaged, surface deposit-feeding worm community. If these fish species are absent for a period of time that coincides with the time period over which the benthic community was damaged and then later reappear, it might be because the surface depositfeeding worms have returned to the benthic community that has recovered from its damaged state. Acknowledgements. We thank the staff of the Bonifacio Strait Natural Reserve for collecting the data. We thank S. Ferrier and G. Manion for programming and modifing the GDM function. We thank D. Mckenzie for his constructive comments on the manuscript and language editing. This work was partly funded by the Total Foundation, the ‘Fondation pour la Recherche sur la Biodiversité’ (project BIODIVMED) and the ANR project AMPHORE. We also thank anonymous referees for helpful comments on the manuscript.
➤ ➤
➤ ➤
➤
➤ ➤ ➤
➤
LITERATURE CITED
➤ Araújo MS, Pinheiro A, Reis SF (2008) Gluttonous predators: ➤
➤ ➤ ➤ ➤ ➤
➤
➤
how to estimate prey size when there are too many prey. Braz J Biol 68:315–320 Arismendi I, Soto D, Penaluna B, Jara C, Leal C, Leon-Munoz J (2009) Aquaculture, non-native salmonid invasions and associated declines of native fishes in northern Patagonian lakes. Freshw Biol 54:1135–1147 Barel C (1982) Towards a constructional morphology of cichlid fishes (Teleostei, Perciformes). Neth J Zool 33:357–424 Barnett A, Bellwood DR, Hoey AS (2006) Trophic ecomorphology of cardinalfish. Mar Ecol Prog Ser 322:249–257 Bellwood DR, Hughes TP, Hoey AS (2006) Sleeping functional group drives coral-reef recovery. Curr Biol 16:2434–2439 Biau G, Devroye L, Lugosi G (2008) Consistency of random forests and other averaging classifiers. J Mach Learn Res 9:2015–2033 Bodini A (1998) Representing ecosystem structure through signed digraphs. model reconstruction, qualitative predictions and management: the case of a freshwater ecosystem. Oikos 83:93–106 Bohning-Gaese K, Oberrath R (1999) Phylogenetic effects on morphological, life-history, behavioural and ecological traits of birds. Evol Ecol Res 1:347–364 Bowen SH (1983) Detritivory in neotropical fish communities. Environ Biol Fishes 9:137–144 Boyle KS, Horn MH (2006) Comparison of feeding guild structure and ecomorphology of intertidal fish assemblages
➤ ➤
➤ ➤
➤ ➤ ➤
from central California and central Chile. Mar Ecol Prog Ser 319:65–84 Breiman L (2001) Random forests. Mach Learn 45:5–32 Bremner J, Rogers SI, Frid CLJ (2003) Assessing functional diversity in marine benthic ecosystems: a comparison of approaches. Mar Ecol Prog Ser 254:11–25 Castillo-Rivera M, Kobelkowsky A, Zamayoa V (1996) Food resource partitioning and trophic morphology of Brevoortia gunteri and B. patronus. J Fish Biol 49:1102–1111 Catherine A, Mouillot D, Escoffier N, Bernard C, Troussellier M (2010) Cost effective prediction of the eutrophication status of lakes and reservoirs. Freshw Biol 55:2425–2435 Christensen V, Walters CJ (2004) Ecopath with ecosim: methods, capabilities and limitations. Ecol Model 172:109–139 Coll M, Palomera I, Tudela S, Sarda F (2006) Trophic flows, ecosystem structure and fishing impacts in the South Catalan Sea, northwestern Mediterranean. J Mar Syst 59: 63–96 Colloca F, Carpentieri P, Balestri E, Ardizzone G (2010) Food resource partitioning in a mediterranean demersal fish assemblage: the effect of body size and niche width. Mar Biol 157:565–574 Colvard NB, Edmunds PJ (2011) Decadal-scale changes in abundance of non-scleractinian invertebrates on a caribbean coral reef. J Exp Mar Biol Ecol 397:153–160 Cortes E (1999) Standardized diet compositions and trophic levels of sharks. ICES J Mar Sci 56:707–717 Danovaro R, Gambi C, Dell’Anno A, Corinaidesi C and others (2008) Exponential decline of deep-sea ecosystem functioning linked to benthic biodiversity loss. Curr Biol 18: 1–8 Declerck S, Louette G, De Bie T, De Meester L (2002) Patterns of diet overlap between populations of non-indigenous and native fishes in shallow ponds. J Fish Biol 61: 1182–1197 Dixon SJ, Brereton RG (2009) Comparison of performance of five common classifiers represented as boundary methods: Euclidean Distance to Centroids, Linear Discriminant Analysis, Quadratic Discriminant Analysis, Learning Vector Quantization and Support Vector Machines, as dependent on data structure. Chemometr Intell Lab 95:1–17 Dumay O, Tari PS, Tomasini JA, Mouillot D (2004) Functional groups of lagoon fish species in Languedoc Roussillon, Southern France. J Fish Biol 64:970–983 Ferrier S, Manion G, Elith J, Richardson K (2007) Using generalized dissimilarity modelling to analyse and predict patterns of beta diversity in regional biodiversity assessment. Divers Distrib 13:252–264 Fisher R (1936) The use of multiple measurements in taxonomic problems. Ann Eugen 7:179–188 Garrison LP, Link JS (2000) Dietary guild structure of the fish community in the Northeast United States continental shelf ecosystem. Mar Ecol Prog Ser 202:231–240 Gatz AJ (1979) Ecological morphology of freshwater stream fishes. Tulane Stud Zool Bot 21:91–124 Gatz AJ (1981) Morphologically inferred niche differentiation in stream fishes. Am Midl Nat 106:10–21 Glen A, Dickman C (2008) Niche overlap between marsupial and eutherian carnivores: Does competition threaten the endangered spotted-tailed quoll? J Appl Ecol 45:700–707 Gregory SD, Macdonald DW (2009) Prickly coexistence or blunt competition? Opuntia refugia in an invaded rodent community. Oecologia 159:225–236 Hormada M, Kuczynski L, Kristin A, Tryjanowski P (2003) Animals of different phenotype differentially utilise dietary niche — the case of the great grey shrike Lanius excubitor. Ornis Fenn 80:71–78
Albouy et al.: Predicting diet from functional traits
➤ Horppila ➤
➤
➤
➤
➤ ➤ ➤
➤ ➤
➤
➤
➤
➤
➤
➤
➤
J (1999) Diel changes in diet composition of an omnivorous cyprinid – a possible source of error in estimating food consumption. Hydrobiologia 400:33–39 Ibanez C, Tedesco P, Bigorne R, Hugueny B and others (2007) Dietary morphological relationships in fish assemblages of small forest streams in the Bolivian Amazon. Aquat Living Resour 20:131–142 Irz P, Michonneau F, Oberdorff T, Whittier T, Lamouroux N, Mouillot D, Argillier C (2007) Fish community comparisons along environmental gradients in lakes of France and North-east USA. Glob Ecol Biogeogr 16:350–366 James FC (1982) The ecological morphology of birds — a review. Ann Zool Fenn 19:265–275 Karlson A, Almqvist G, Skora K, Appelberg M (2007) Indications of competition between non-indigenous round goby and native flounder in the Baltic Sea. ICES J Mar Sci 64:479–486 Karpouzi V, Stergiou K (2003) The relationships between mouth size and shape and body length for 18 species of marine fishes and their trophic implications. J Fish Biol 62: 1353–1365 Keast A, Webb D (1966) Mouth and body form relative to feeding ecology in fish fauna of a small lake, Lake Opinicon, Ontario. J Fish Res Board Can 23:1845–1873 Kohavi R, Provost F (1998) Glossary of terms. Mach Learn 30: 271–274 Kramer D, Bryant M (1995) Intestine length in the fishes of a tropical stream. II. Relationships to diet — the long and short of a convoluted issue. Environ Biol Fishes 42: 129–141 Labropoulou M, Markakis G (1998) Morphological-dietary relationships within two assemblages of marine demersal fishes. Environ Biol Fishes 51:309–319 Legendre P (1993) Spatial autocorrelation: Trouble or new paradigm? Ecology 74:1659–1673 Legendre P, Legendre L (1998) Numerical ecology. Elsevier Science, Amsterdam Lehikoinen A (2005) Prey-switching and diet of the great cormorant during the breeding season in the gulf of Finland. Waterbirds 28:511–515 Levins R (1975) Evolution in communities near equilibrium. In: Cody M, Diamonds JM (eds) Ecology and evolution of communities. Harvard University Press, Cambridge, MA, p 16–50 Link JS, Garrison LP (2002) Trophic ecology of Atlantic cod Gadus morhua on the northeast US continental shelf. Mar Ecol Prog Ser 227:109–123 Luczkovich JJ, Motta PJ, Norton SF, Liem KF (1995) Ecomorphology of fishes. Kluwer Academic Publishers, Dordrecht Maldonado E, Hubert N, Sagnes P, De Merona B (2009) Morphology-diet relationships in four killifishes (Teleostei, Cyprinodontidae, Orestias) from Lake Titicaca. J Fish Biol 74:502–520 Mason NWH, Lanoiselee C, Mouillot D, Irz P, Argillier C (2007) Functional characters combined with null models reveal inconsistency in mechanisms of species turnover in lacustrine fish communities. Oecologia 153:441–452 Mason NWH, Lanoiselee C, Mouillot D, Wilson J, Argillier C (2008) Does niche overlap control relative abundance in French lacustrine fish communities? A new method incorporating functional traits. J Anim Ecol 77:661–669 Mathieson S, Cattrijsse A, Costa MJ, Drake P, Elliott M, Gardner J, Marchand J (2000) Fish assemblages of European tidal marshes: a comparison based on species, families and functional guilds. Mar Ecol Prog Ser 204:225–242 Mercier L, Darnaude A, Bruguier O, Vasconcelos RP and others (2011) Selecting statistical models and variable
➤
➤
➤
➤
➤
➤ ➤
➤ ➤
➤
➤
➤
➤ ➤
➤
27
combinations for optimal classification using otolith microchemistry. Ecol Appl 21:1352–1364 Miniconi R (1994) Les poissons et la pêche en Méditerranée: la Corse. Alain Piazzola & La Marge, Ajaccio Mookerji N, Weng Z, Mazumder A (2004) Food partitioning between coexisting Atlantic salmon and brook trout in the Sainte-Marguerite River ecosystem, Quebec. J Fish Biol 64:680–694 Motta P (1988) Functional-morphology of the feeding apparatus of 10 species of Pacific butterflyfishes (Perciformes, Chaetodontidae) — an ecomorphological approach. Environ Biol Fishes 22:39–67 Mouillot D, Mason N, Wilson J (2007) Is the abundance of species determined by their functional traits? A new method with a test using plant communities. Oecologia 152:729–737 Mouillot D, Culioli J, Pelletier D, Tomasini J (2008) Do we protect biological originality in protected areas? A new index and an application to the Bonifacio Strait Natural Reserve. Biol Conserv 141:1569–1580 Munoz A, Ojeda F (1997) Feeding guild structure of a rocky intertidal fish assemblage in central Chile. Environ Biol Fishes 49:471–479 Norton S (1991) Capture success and diet of cottid fishes — the role of predator morphology and attack kinematics. Ecology 72:1807–1819 Oppel S, Powell A, Dickson D (2009) Using an algorithmic model to reveal individually variable movement decisions in a wintering sea duck. J Anim Ecol 78:524–531 Overton JM, Barker GM, Price R (2009) Estimating and conserving patterns of invertebrate diversity: a test case of New Zealand land snails. Divers Distrib 15:731–741 Pauly D, Christensen V, Walters C (2000) Ecopath, Ecosim, and Ecospace as tools for evaluating ecosystem impact of fisheries. ICES J Mar Sci 57:697–706 Perdiguero-Alonso D, Montero F, Kostadinova A, Raga J, Barrett J (2008) Random forests, a novel approach for discrimination of fish populations using parasites as biological tags. Int J Parasitol 38:1425–1434 Portz D, Tyus H (2004) Fish humps in two Colorado River fishes: a morphological response to cyprinid predation? Environ Biol Fishes 71:233–245 R Development Core Team (2008) R: a language and environment for statistical computing. R Foundation for Statistical Computing, Vienna. Available at www.R-project. org Rimet F, Bouchez A (2011) Use of diatom life-forms and ecological guilds to assess pesticide contamination in rivers: lotic mesocosm approaches. Ecol Indic 11:489–499 Rosecchi E (1983) Regime alimentaire du pageot, Pagellus erythrinus, Linne 1758, (Pisces, Sparidae dans le Golfe du Lion. Cybium 7:17–29 Rosecchi E, Nouaze Y (1987) Comparaison de cinq indices alimentaires utilisés dans l’analyse des contenus stomacaux. J Rev Trav Inst Sci Tech Pêches Maritimes 49:111–123 Sala E, Ballesteros E (1997) Partitioning of space and food resources by three fish of the genus Diplodus (Sparidae) in a Mediterranean rocky infralittoral ecosystem. Mar Ecol Prog Ser 152:273–283 Sibbing F, Nagelkerke L (2001) Resource partitioning by Lake Tana barbs predicted from fish morphometrics and prey characteristics. Rev Fish Biol Fish 10:393–437 Sosa-Lopez A, Mouillot D, Chi T, Ramos-Miranda J (2005) Ecological indicators based on fish biomass distribution along trophic levels: an application to the Terminos coastal lagoon, Mexico. ICES J Mar Sci 62:453–458 Tanaka H, Aoki I, Ohshimo S (2006) Feeding habits and gill raker morphology of three planktivorous pelagic fish spe-
28
➤ ➤
➤
Mar Ecol Prog Ser 436: 17–28, 2011
cies off the coast of northern and western Kyushu in summer. J Fish Biol 68:1041–1061 Vander Zanden M, Vadeboncoeur Y (2002) Fishes as integrators of benthic and pelagic food webs in lakes. Ecology 83:2152–2161 Villeger S, Miranda JR, Hernandez DF, Mouillot D (2010) Contrasting changes in taxonomic vs. Functional diversity of tropical fish communities after habitat degradation. Ecol Appl 20:1512–1522 Wainwright P, Reilly SM (1994) Ecological morphology: integrative organismal biology. University of Chicago Press, Chicago, IL Wainwright P, Richard B (1995) Predicting patterns of prey use from morphology of fishes. Environ Biol Fishes 44: 97–113 Editorial responsibility: Hans Heinrich Janssen, Oldendorf/Luhe, Germany
➤ Wainwright ➤
➤ ➤
P, Bellwood D, Westneat M (2002) Ecomorphology of locomotion in labrid fishes. Environ Biol Fishes 65: 47–62 Ward-Campbell B, Beamish F, Kongchaiya C (2005) Morphological characteristics in relation to diet in five coexisting Thai fish species. J Fish Biol 67:1266–1279 Webb PW (1984) Form and function in fish swimming. Sci Am 251:72–82 Winemiller K, Taylor D (1987) Predatory behavior and competition among laboratory-housed largemouth and smallmouth bass. Am Midl Nat 117:148–166 Zeug SC, Peretti D, Winemiller KO (2009) Movement into floodplain habitats by gizzard shad (Dorosoma cepedianum) revealed by dietary and stable isotope analyses. Environ Biol Fishes 84:307–314 Submitted: May 26, 2010; Accepted: June 6, 2011 Proofs received from author(s): August 24, 2011