APPLIED AND ENVIRONMENTAL MICROBIOLOGY, Dec. 2011, p. 8687–8695 0099-2240/11/$12.00 doi:10.1128/AEM.05568-11 Copyright © 2011, American Society for Microbiology. All Rights Reserved.
Vol. 77, No. 24
Predictive Models for the Effect of Storage Temperature on Vibrio parahaemolyticus Viability and Counts of Total Viable Bacteria in Pacific Oysters (Crassostrea gigas)䌤 Judith Fernandez-Piquer, John P. Bowman, Tom Ross, and Mark L. Tamplin* Australian Seafood Cooperative Research Centre, Box 26, Mark Oliphant Building, Science Park Adelaide, Adelaide, South Australia, Australia, and Tasmanian Institute of Agricultural Research, University of Tasmania, Private Bag 54, Hobart, Tasmania, Australia Received 6 June 2011/Accepted 7 October 2011
Vibrio parahaemolyticus is an indigenous bacterium of marine environments. It accumulates in oysters and may reach levels that cause human illness when postharvest temperatures are not properly controlled and oysters are consumed raw or undercooked. Predictive models were produced by injecting Pacific oysters (Crassostrea gigas) with a cocktail of V. parahaemolyticus strains, measuring viability rates at storage temperatures from 3.6 to 30.4°C, and fitting the data to a model to obtain parameter estimates. The models were evaluated with Pacific and Sydney Rock oysters (Saccostrea glomerata) containing natural populations of V. parahaemolyticus. V. parahaemolyticus viability was measured by direct plating samples on thiosulfate-citratebile salts-sucrose (TCBS) agar for injected oysters and by most probable number (MPN)-PCR for oysters containing natural populations. In parallel, total viable bacterial counts (TVC) were measured by direct plating on marine agar. Growth/inactivation rates for V. parahaemolyticus were ⴚ0.006, ⴚ0.004, ⴚ0.005, ⴚ0.003, 0.030, 0.075, 0.095, and 0.282 log10 CFU/h at 3.6, 6.2, 9.6, 12.6, 18.4, 20.0, 25.7, and 30.4°C, respectively. The growth rates for TVC were 0.015, 0.023, 0.016, 0.048, 0.055, 0.071, 0.133, and 0.135 log10 CFU/h at 3.6, 6.2, 9.3, 14.9, 18.4, 20.0, 25.7, and 30.4°C, respectively. Square root and Arrhenius-type secondary models were generated for V. parahaemolyticus growth and inactivation kinetic data, respectively. A square root model was produced for TVC growth. Evaluation studies showed that predictive growth for V. parahaemolyticus and TVC were “fail safe.” The models can assist oyster companies and regulators in implementing management strategies to minimize V. parahaemolyticus risk and enhancing product quality in supply chains. outbreaks have been linked to oyster consumption, with one death in 1992 and two cases in 2005 (1, 38). Water temperature influences the presence of V. parahaemolyticus. Higher densities of V. parahaemolyticus in U.S. oysters have been observed in samples collected in spring and summer and are significantly correlated with higher water temperature (16, 18, 52). Specifically, V. parahaemolyticus densities decrease in oysters in harvest water less than 14 to 15°C (34, 52). Consequently, climate change is expected to influence geographical exposure levels, as well as the distribution of this and other Vibrio spp. (44, 45). Densities of V. parahaemolyticus are also influenced by temperature during postharvest transport and processing, resulting in multiplication of the bacterium to potentially hazardous levels if oysters are not promptly refrigerated (11, 14, 30). A recent market survey of oyster microbiological quality performed in the United States found that 15% of tested lots exceeded the 10,000 most probable number (MPN)/g V. parahaemolyticus criterion established by the U.S. Food and Drug Administration (FDA) (17, 27). In addition, recent data from the U.S. Centers for Disease Control and Prevention indicate an increase in Vibrio sp. infections from 2001 to 2008 and that V. parahaemolyticus accounted for 52% of the cases of Vibrio sp. infection confirmed for 2009 (2). This emphasizes the need to improve risk management practices for this food-borne bacterium. In response to V. parahaemolyticus risk, the FDA published a V. parahaemolyticus risk assessment that estimates the public
Vibrio parahaemolyticus is a Gram-negative, halophilic, curved, rod-shaped bacterial species indigenous to marine environments (19). Oysters accumulate V. parahaemolyticus via filter feeding that may result in concentrations 100 times greater than those found in the surrounding seawater (16). Consequently, the consumption of raw or improperly cooked oysters can sometimes result in V. parahaemolyticus infection. Disease occurs worldwide (59), with a higher incidence reported in the United States (13, 64). Human disease usually displays as moderate to severe gastroenteritis, although septicemia may occur in individuals with impaired hepatic and renal capacity and the immunocompromised (66). Clinical illness is mostly associated with strains that produce the thermostable direct hemolysin (TDH) and/or TDH-related hemolysin (TRH) that are encoded by the tdh and trh genes, respectively (58). The reported frequency of tdh detection in oysters in studies at least 1 year in duration ranges from 3 to 70% (15, 18, 34, 52) and 17 to 60% for trh (34), depending on the methodology and the region studied. In Australia, V. parahaemolyticus has been isolated from oysters (20, 23, 24, 40, 42), and two reported
* Corresponding author. Mailing address: Tasmanian Institute of Agricultural Research, University of Tasmania, Private Bag 54, Hobart, TAS 7001, Australia. Phone: (613) 6226 6378. Fax: (613) 6226 7450. E-mail:
[email protected]. 䌤 Published ahead of print on 14 October 2011. 8687
8688
FERNANDEZ-PIQUER ET AL.
health impact of pathogenic V. parahaemolyticus associated with raw oyster consumption (25). The risk assessment identified different factors that can markedly influence the presence and outgrowth of the bacterium in oysters, including water temperature, region and season of harvest, and ambient air temperature after harvest, as well as the time between harvest and cooling. V. parahaemolyticus can present a significant hazard when present in shellfish meant for human consumption and when postharvest temperatures are not properly controlled in supply chains. As a result, the U.S. National Shellfish Sanitation Program recommends the use of time-temperature combinations to control V. parahaemolyticus growth during harvest and also provides guidelines for temperature control during transport (26). A comprehensive understanding of the response of V. parahaemolyticus to environmental temperature is the basis for developing effective risk management strategies for regulatory agencies, oyster producers, and consumers. In this regard, predictive microbiology offers a systematic approach to describe microbial responses to different environments (46). Through the use of mathematical models, the viability of pathogenic bacteria can be estimated to minimize risk, enhance product quality, and manage supply chains (21). Mathematical models have been developed for the prediction of V. parahaemolyticus growth as a function of temperature. In bacteriological broth systems, the growth of V. parahaemolyticus over a temperature range of 8 to 45°C (47) and the growth rate and lag time from 10 to 30°C were modeled (67). Predictive models for V. parahaemolyticus growth have also been developed in food matrices. The growth of V. parahaemolyticus in a Korean oyster slurry at 20 to 30°C (67) and in salmon meat from 0 to 35°C (65) have been reported. The FDA also provides a model for the growth of V. parahaemolyticus in American oysters (27). However, there are few predictive models for viability in live oysters and none for V. parahaemolyticus in live Pacific oysters (Crassostrea gigas) (PO). Thus, the objective of this study was to develop mathematical models to describe the effect of storage temperature on the growth rate of V. parahaemolyticus. In parallel, a model was developed for the total viable bacterial count (TVC) in live Pacific oysters. The models were evaluated in PO and Sydney rock oysters (Saccostrea glomerata) (SRO) containing indigenous V. parahaemolyticus harvested from different geographical locations in Australia. MATERIALS AND METHODS Oyster samples. In experiments to produce the predictive model, 10 batches of live PO were harvested by a commercial grower in Pipeclay Lagoon, Tasmania, Australia, between September and December 2008. Following collection, the oysters were placed in a cooler with gel packs and transported within 2 h to the laboratory at the University of Tasmania, Hobart, Tasmania. The oysters were washed with tap water to remove excess mud on the shells, as indicated by the American Public Health Association for the bacteriological examination of shellfish (33); stored at approximately 7°C; and processed within 24 h of harvest. The seawater pH (Waterproof pHTestr1; Oakton, Vernon Hills, IL), temperature and salinity (microprocessor conductivity meter model LF-196; WTW, Germany), and dissolved oxygen (microprocessor oximeter model OXI-196; WTW, Germany) were measured in the top 5 cm of the surface water in the harvest area at the time of sample collection. A total of 1,600 oysters were used in experiments.
APPL. ENVIRON. MICROBIOL. The model for V. parahaemolyticus and TVC viability in PO was evaluated in PO and SRO harvested in Port Stephens, New South Wales (NSW), Australia. Following harvest, the oysters were packed in a cooler, and the temperature was monitored during transport using a temperature data logger (iButton; Maxim Integrated Products, Inc., Sunnyvale, CA). Three different batches of SRO were harvested in April 2009, May 2009, and February 2010; one batch of PO was harvested in February 2010. All batches were shipped to the laboratory in Hobart, Tasmania, by overnight courier and tested within 26 h of collection. A separate batch of PO harvested in the same area in May 2009 was shipped by overnight courier to the South Australian Research and Development Institute (SARDI) Food Safety Laboratory in Glenside, South Australia, and tested within 24 h of harvest. A total of 1,000 oysters were tested for all validation studies using NSW oysters. Bacterial strains. Local strains with the desired combinations of tdh and trh virulence genes were not available. Six V. parahaemolyticus strains (24339, 24340, 24657, 24658, 24659, and 24660) isolated from shrimp in Thailand, and kindly provided by Orasa Suthienkul, Faculty of Public Health, Department of Microbiology, Mahidol University, Bangkok, Thailand, were used to produce the PO model. Cultures were stored at ⫺80°C in modified tryptone soy broth (mTSB) (TSB [CM0129; Oxoid, Adelaide, Australia] supplemented with 3% NaCl and adjusted to pH 8.4) with addition of 15% (vol/vol) glycerol (Sigma-Aldrich, Steinheim, Germany). Colony PCR assay for species and virulence genes. A multiplex PCR assay was performed to detect tdh, trh, and tlh genes (49, 50, 61) in the six different bacterial strains used in the cocktail. The bacterial strains were cultured on thiosulfatecitrate-bile salts-sucrose (TCBS) agar to confirm that the colonial morphology was typical of V. parahaemolyticus (36). For each assay, one isolated colony was mixed in 200 l of sterile distilled water and stored at ⫺20°C, and the sample suspension was used as a template for the PCR assay without DNA extraction. The presence of the three genes was tested using a 20-l reaction mixture containing 2 l DNA template, 10 l ImmoMix Red (Bioline, NSW, Australia), 0.25 M each oligonucleotide reverse and forward primer, and 5 l of RNasefree water (BIO38031; Bioline, NSW, Australia). The oligonucleotide primer sequences used for tlh (F-tlh, 5⬘-ACTCAACACAAGAAGAGATCGACAA-3⬘, and R-tlh, 5⬘-GATGAGCGGTTGATGTCCAA-3⬘) were as reported by Nordstrom et al. (51), and the sequences for tdh (F-tdh, 5⬘-GTAAAGGTCTCTGA CTTTTGGAC-3⬘, and R-tdh, 5⬘-TGGAATAGAACCTTCATCTTCACC-3⬘) and trh (F-trh, 5⬘-TTGGCTTCGATATTTTCAGTATCT-3⬘, and R-trh, 5⬘-CA TAACAAACATATGCCCATTTCCG-3⬘) were as reported by Bej et al. (6) and commercially synthesized (Gene Works, SA, Australia). The PCR cycle program consisted of a denaturation step at 95°C for 10 min, followed by 35 cycles at 94°C for 1 min, 55°C for 1 min, and 72°C for 1 min and a final elongation at 72°C for 7 min. Strain 60 (tlh⫹ tdh⫹ trh⫹) was used as a positive control, and RNase-free water was used as a negative control. Electrophoresis of PCR-amplified DNA (5 l) was conducted at room temperature on a 2% (wt/vol) agarose gel containing GelRed Nucleic Acid Gel Stain (Biotium, CA) in 1⫻ Tris-acetate-EDTA buffer at a constant voltage of 74 V for 80 min. Visualization of DNA was performed with a transilluminator (Bio-Rad, NSW, Australia), and the image was processed using QuantityOne 4.6.6 1-D Analysis software (Bio-Rad, NSW, Australia). The approximate sizes of the PCR products for tlh, tdh, and trh were 200 bp, 250 bp, and 500 bp, respectively, compared to the marker (HLII; BIO33039; Bioline, NSW, Australia). Preparation of V. parahaemolyticus injection inoculum. For each experiment, each V. parahaemolyticus strain was transferred from ⫺80°C storage to a plate of mTSA (mTSB with addition of 1.5% agar [grade J3; Gelita, QLD, Australia]) and incubated at 25°C for 18 to 24 h. For each of the six strains, two or three colonies from each of the mTSA plates were selected and enriched in 9 ml marine broth (MB). MB consisted of 0.5% bacteriological peptone (LP0037; Oxoid, Adelaide, Australia), 0.1% yeast extract (LP0021; Oxoid, Adelaide, Australia), and 3.5% (wt/vol) sea salts (RedSeaFish, Sydney, Australia), with the pH adjusted to 8.4. The six broths were incubated at 25°C for 18 to 24 h. Each culture was adjusted to an optical density at 540 nm (OD540) of 0.15 to 0.25 using 200 l in a Benchmark Microplate Reader (Bio-Rad, NSW, Australia). Two-milliliter aliquots of each working culture were combined to produce a 12-ml cocktail of approximately 3 ⫻ 108 total CFU/ml. The cocktail for oyster injection was diluted in sterile artificial seawater (3.5% [wt/vol] sea salts) to a final concentration of approximately 1.5 ⫻ 106 CFU/ml. For low-temperature storage studies (3.6, 6.2, 9.6, and 12.6°C), the inoculum was prepared to a concentration of 1.5 ⫻ 108 CFU/ml to facilitate modeling inactivation. The inocula were kept on ice in tubes during the injection process for approximately 30 min. It is possible that a slight decrease in cell numbers occurred due to low-temperature sensitivity of V. parahaemolyticus (9); however, the final required initial concentration in oysters was achieved.
VOL. 77, 2011
V. PARAHAEMOLYTICUS AND TVC MODELS FOR C. GIGAS
Oyster inoculation. For each storage assay, an approximately 5-mm notch was drilled in the oyster shell approximately 50 mm from the hinge, based on an average oyster length of 80 mm, using a power drill (Dremel Multipro 395) and avoiding contact with oyster tissue (37). The adductor muscles of 60 oysters were then directly injected with 0.1 ml of the inoculum cocktail using a 1-ml syringe equipped with a 23-gauge needle (Terumo), similar to a method previously reported (29). The remaining 100 oysters were injected with 0.1 ml of sterile artificial seawater. Storage conditions. The injected oysters were stacked in 2 or 3 layers in open plastic containers and stored in incubators at 3.6 ⫾ 0.1, 6.2 ⫾ 0.1, 9.3 ⫾ 0.3, 9.6 ⫾ 0.3, 12.6 ⫾ 0.4, 14.9 ⫾ 0.1, 18.4 ⫾ 0.2, 20.0 ⫾ 0, 25.7 ⫾ 0.2, and 30.4 ⫾ 0.3°C. The storage time varied from 437 h at 3.6°C to 58 h at 30.4°C based on oyster viability during the course of experiments. When sample oyster shells gaped, the oysters were not considered viable and experiments were not continued. The incubator temperature was monitored by placing temperature data loggers between oysters. The resolution of the temperature loggers was 0.5°C. The mean ⫾ standard deviation for each storage temperature measured from the two different data loggers for each experiment was recorded. In model validation studies, SRO containing natural populations of V. parahaemolyticus were stored at 15.3 ⫾ 0.2, 18.0 ⫾ 0.1, 21.8 ⫾ 0.4, 24.2 ⫾ 0.3, and 27.9 ⫾ 0.2°C and PO at 15.0 ⫾ 1, 18.0 ⫾ 0.1, 23.0 ⫾ 1, 24.2 ⫾ 0.3, and 28.0 ⫾ 1°C. Experiments at 15, 23, and 28°C for PO were performed at the SARDI laboratory. Bacterial enumeration. Preliminary studies were conducted to determine the appropriate sample size of injected oysters for bacterial enumeration. Six sets of three oysters each were tested at different storage times. A standard deviation of 0.12 was observed for initial counts and 0.71 after oyster storage, indicating good repeatability among replicates. In model development studies, two separate samples of three oysters injected with V. parahaemolyticus and one sample of 10 seawater-injected oysters were analyzed at selected time intervals. The larger number of controls was used to detect expected variability in background levels of indigenous V. parahaemolyticus (35). At the time of bacteriological analysis, oysters were opened aseptically with a sterile shucking knife as described by the American Public Health Association (33); meat and liquor were placed in a sterile 400-ml filter stomacher bag (A. I. Scientific, Hallam, Australia) with an equal weight of peptone salt solution (PSS) (0.1% bacteriological peptone [LP0037; Oxoid, Adelaide, Australia], 3% NaCl [Ajax Finechem, NSW, Australia], pH 7.4); and the sample was stomached (Colworth Stomacher 400; A. J. Seward, London, United Kingdom) for 2 min. Although buffered saline solution can be used as a diluent in Vibrio sp. assays (7, 36), the use of PSS is recommended in the Australian Standard Methods (58a). Due to the high number of test samples per time interval, the oysters were processed with a stomacher instead of a blender, as reported for other oyster studies (43). The stomached samples were diluted in 10-fold serial increments with PSS, and 100 l was plated in duplicate on TCBS agar (CM0333; Oxoid, Adelaide, Australia) and on marine agar (MB with the addition of 1.5% agar [grade J3; Gelita, QLD, Australia]). The TCBS and marine agar plates were incubated at 37°C for 16 to 18 h and at 25°C for 48 h, respectively. Plated dilutions yielding 30 to 300 CFU/plate were counted manually, and the number of CFU per gram of homogenate was calculated. In studies of oysters containing natural V. parahaemolyticus populations, V. parahaemolyticus was enumerated using a 3-tube MPN method (36) with slight modification. Samples were homogenized and diluted as explained for seawaterinjected oysters, and the salt content of alkaline peptone water (APW) was increased from 1% to 3% NaCl, as this has been reported to improve the isolation of V. parahaemolyticus (10). A 20-g sample of oyster homogenate was mixed with 80 g of modified APW (mAPW) (1% bacteriological peptone [LP0037; Oxoid, Adelaide, Australia], 3% NaCl [Ajax Finechem, NSW, Australia], pH 8.4), and then serial 10-fold dilutions (vol/vol) in PSS were prepared. Ten and 1 milliliter from the initial dilution and 1 milliliter of all other dilutions were individually added to three tubes containing 10 ml mAPW and incubated at 37°C for 16 to 18 h. A 100-l sample of each turbid broth was transferred to a sterile nonskirted 96-well PCR plate (Bioline, NSW, Australia) and stored at ⫺20°C for a maximum of 1 week until it was assayed by PCR. According to the presence or absence of positive bands in the agarose gel, total populations of V. parahaemolyticus were determined using an MPN table (36). MPN-PCR detection of tlh. Determination of the presence of V. parahaemolyticus was carried out as described above for colony PCR, but with some adjustments. Specifically, the primers directed to the tdh and trh genes were omitted and the volumes in the mixture were changed as follows: 20 l reaction mixture containing 2 l sample, 10 l ImmoMix Red, 0.1 M each oligonucleotide reverse and forward primer, and 7.6 l of RNase-free water. The PCR cycles were reduced from 35 to 30, and electrophoresis of the PCR-amplified product
8689
was applied for 30 min instead of 80 min. These conditions were adequate to separate bands and reduced the assay time. Sensitivity of MPN-PCR for tlh detection. The V. parahaemolyticus cocktail was prepared as for oyster injection model studies and was 10-fold serially diluted in mAPW. One milliliter of each dilution was added to individual tubes containing 9 ml mAPW and 1.0 ml of a 10-fold dilution of oyster homogenate (0.1 g oyster/tube), giving final V. parahaemolyticus concentrations of 0 (negative control) to 1.3 ⫻ 106 CFU/ml. Initially and after 16 h at 37°C, samples from each tube were divided into two groups; one was boiled for 10 min at 90°C, and the other was not boiled. Each sample treatment was tested by PCR detection for the tlh gene. Predictive models for V. parahaemolyticus and total viable bacterial count. Plate count data were transformed to log10 values. For growth profiles, the data were fitted with DMFit curve-fitting software v2.1 (courtesy of the Institute of Food Research, Norwich, United Kingdom) to estimate the growth rate (log10 CFU/h) using the growth model reported by Baranyi and Roberts (4). For inactivation profiles, inactivation rates (⫺log10 CFU/h) were estimated by linear regression using Microsoft Excel. For V. parahaemolyticus growth, the square root model (56) was used to describe the growth rate (r) as a function of temperature. The equation for the square root model is as follows:
冑 r ⫽ b ⫻ 共T ⫺ To兲
(1)
and shows a linear relationship between the square root of r and temperature (T), where b is a regression coefficient and To is a hypothetical reference temperature that is an intrinsic property of the organism. The Arrhenius equation (3) was used to estimate the kinetic parameters for the effect of temperature on bacterial inactivation. The equation used was as follows: ln r ⫽ ln A ⫺ Ea/RT
(2)
where r is the rate constant, T is the absolute temperature, Ea is the activation energy, R is the universal gas constant, and A is the collision factor. The values of ln r were plotted against 1/T to calculate the values of Ea/R and A by linear regression using Microsoft Excel. The growth rate of TVC was plotted as a function of temperature, and the data were fitted to the square root model as described for V. parahaemolyticus. All TVC and V. parahaemolyticus kinetic data have been submitted to ComBase, a database for predictive microbiology (5). Model performance. Measurement of goodness of fit for each of the secondary models was done by evaluating the root mean square error (RMSE) and the coefficient of determination (R2) (55). Statistical information on the performance of the secondary models was obtained using regression data analysis in Excel (Table 1). Evaluation of secondary growth models for V. parahaemolyticus and TVC was performed with two different oyster species, PO and SRO, containing natural V. parahaemolyticus populations, during different seasons and from a geographical location different from that used for model development. The secondary model for V. parahaemolyticus growth was compared to other published V. parahaemolyticus models (27, 47, 65, 67).
RESULTS Harvest conditions during oyster collection. The average surface seawater temperature of the harvest area in Tasmania was 15.8 ⫾ 2.2°C, with an observed range of 12.3 to 19.4°C. The ranges of salinity and dissolved oxygen in the same area were 3.4 to 4.8% and 10.7 to 12.2 mg/liter, respectively. The average pH was 8.5 ⫾ 0.1. For the NSW harvest areas, the surface seawater temperature averaged 21.3 ⫾ 3.6°C, with a range of 17.5 to 25.5°C and salinity of 3.1 ⫾ 0.6%, with a range from 2.4 to 3.7%; pH and dissolved oxygen data were not available. PCR assay for species and virulence genes and sensitivity of MPN-PCR for detection of V. parahaemolyticus in injected oysters. Multiplex PCR tests confirmed that all strains possessed tlh. Strains 24339, 24340, 24659, and 24660 contained tdh; strains 24659 and 24660 contained trh, and strains 24657 and 24658 were tdh and trh negative.
8690
FERNANDEZ-PIQUER ET AL.
APPL. ENVIRON. MICROBIOL.
TABLE 1. Regression data analyses of the secondary models Equation
a
Microorganism
Type
Regression
Coefficient
Standard error
t statistica
P value
Lower 95%
Upper 95%
3
V. parahaemolyticus
Growth
Intercept x variable
⫺0.405 0.030
0.117 0.005
⫺3.447 5.815
0.041 0.010
⫺0.779 0.014
⫺0.031 0.047
4
V. parahaemolyticus
Inactivation
Intercept x variable
⫺20.131 4,131.229
5.472 1,538.137
⫺3.679 2.686
0.067 0.115
⫺43.676 ⫺2,486.839
3.413 10,749.296
5
Total viable-bacteria count
Growth
Intercept x variable
0.069 0.010
0.020 0.001
3.395 9.270
0.015 0.000
0.019 0.008
0.118 0.013
Coefficient divided by standard error.
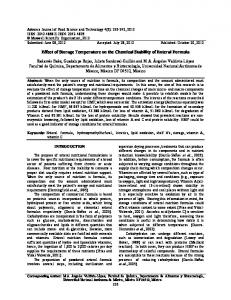
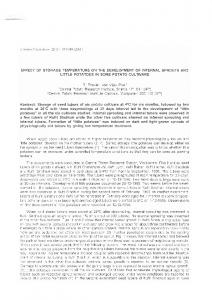
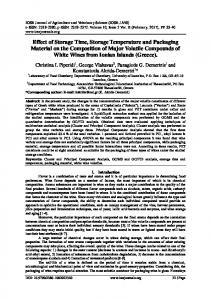
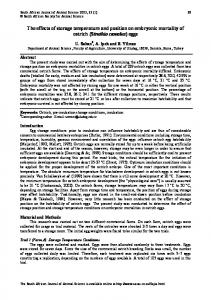
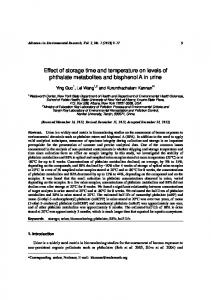
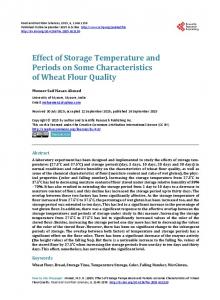
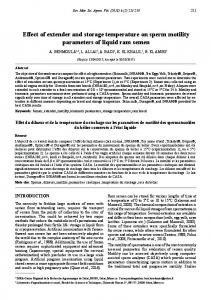
For the MPN-PCR method, the results showed that the limit of reliable detection at the time of sample inoculation (t ⫽ 0 h) was 1.3 ⫻ 105 CFU/ml, regardless of whether samples were boiled or not boiled. After approximately 16 to 18 h enrichment at 37°C, all boiled and unboiled samples from the MPN tubes inoculated with 1.3 to 1.3 ⫻ 106 CFU/ml the previous day produced a positive PCR product. No band was observed for the negative control. The average level of V. parahaemolyticus in the inoculated MPN broth of mAPW incubated overnight, as observed on TCBS plates, was 8.6 log10 CFU/ml. Primary models of V. parahaemolyticus. For growth studies, oysters were injected with an average of 3.4 ⫾ 0.1 log10 CFU/g of the V. parahaemolyticus cocktail. V. parahaemolyticus levels did not significantly increase or decrease at 14.9°C through 169 h. Therefore, the growth rate was assumed to be 0 log10 CFU/h at this temperature. However, oysters stored at temperatures of ⱖ18.4°C supported growth (Fig. 1). The average R2 value for the Baranyi model fitted to the four kinetic growth profiles was 0.85. Growth rates increased with increasing temperature, specifically, 0.030, 0.075, 0.095, and 0.282 log10 CFU/h at 18.4, 20.0, 25.7, and 30.4°C, respectively. Maximum population densities depended on the storage temperature, with the highest levels (i.e., 7.4 log10 CFU/g) observed at 25.7°C after 73 h. At temperatures resulting in V. parahaemolyticus inactivation (i.e., 3.6 to 12.6°C), oysters were injected with an average 5.4 ⫾ 0.2 log10 CFU/g. A linear regression fitted to the data showed an average R2 value of 0.82 (Fig. 2). Overall, inactivation rates decreased with increasing temperature, specifically, ⫺0.006, ⫺0.004, ⫺0.005, and ⫺0.003 log10 CFU/h at 3.6, 6.2, 9.6, and 12.6°C, respectively. The highest, although relatively low, inactivation rate was observed at 3.6°C, with an approximate reduction of 2.5 log10 CFU/g
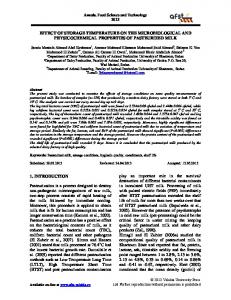
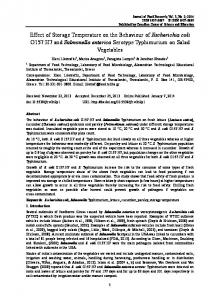
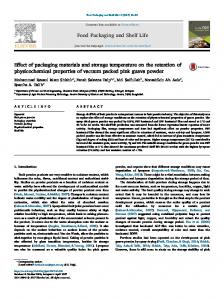
after 437 h. Inactivation below the detection limit (600 CFU/g) was not observed at any storage temperature for the duration of the experiment. Secondary models for V. parahaemolyticus viability in Pacific oysters. Secondary models were produced for both V. parahaemolyticus growth and inactivation. For growth, the square root of the growth rate was plotted as a function of temperature. The square root model was fitted as shown in Fig. 3a. The estimated values for parameters b and To were 0.0303 and 13.37, respectively (equation 3). Goodness of fit comparing observed and predicted values showed an RMSE of 0.05 and an R2 value of 0.92.
冑r ⫽ 0.0303 ⫻ 共T ⫺ 13.37兲
(3)
A linear Arrhenius model was used to describe the change in V. parahaemolyticus numbers [ln (⫺log CFU/h)] from 3.6 and 12.6°C as a function of temperature [1/(T ⫹ 273.15)], as shown in Fig. 3b. Estimated values for the terms Ea/R and A were 4,131.2 and 1.81 ⫻ 10⫺9, respectively (equation 4). Analysis of predicted and observed values was performed. The RMSE of the fitted model was 0.09, and the R2 value was 0.78. ln r ⫽ ln 1.81 ⫻ 10⫺9 ⫹ 4131.2 ⫻ 关1/共T ⫹ 273.15兲兴
(4)
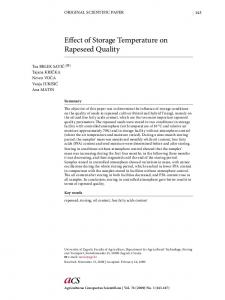
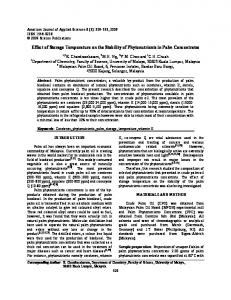
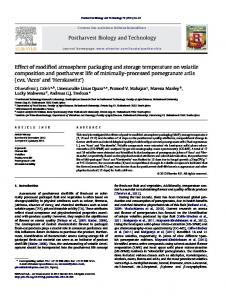
The square root model (equation 3) was compared to other published V. parahaemolyticus models (27, 47, 65, 67). Growth of V. parahaemolyticus in live PO was slower than that reported for bacteriological broth and salmon meat and for American oysters (Crassostrea virginica) between 15 and 29°C. In comparison to oyster slurries, the model deviated between 20 and 24°C, showing faster growth in live PO (Fig. 4). Evaluation of the secondary V. parahaemolyticus growth model in Pacific and Sydney rock oysters containing natural V. parahaemolyticus populations. The growth rates of natural pop-
FIG. 1. Growth of V. parahaemolyticus in live Pacific oysters stored at 18.4 to 30.4°C. Shown are counts (F) in log10 CFU/g and fitted curves (lines).
VOL. 77, 2011
V. PARAHAEMOLYTICUS AND TVC MODELS FOR C. GIGAS
8691
FIG. 2. Inactivation of V. parahaemolyticus in live Pacific oysters stored at 3.6 to 12.6°C. Shown are counts (F) in log10 CFU/g and linear regression fit (lines).
ulations of V. parahaemolyticus were tested at five different storage temperatures for PO and SRO. V. parahaemolyticus multiplied in PO at 23 and 28°C at 0.034 and 0.198 log10 MPN/h, respectively. These growth rates were lower than model predictions. Populations increased from 2.4 log10 MPN/g to 4.4 log10 MPN/g over 60 h storage at 23°C and to 4 log10 MPN/g after 40 h storage at 28°C. In contrast, no significant increase in V. parahaemolyticus levels was observed in PO stored at 15, 18, and 24.2°C. For these temperatures, average V. parahaemolyticus densities were 2.9 ⫾ 0.4, 3.3 ⫾ 0.3, and 3.3 ⫾ 0.4 log10 MPN/g, respectively, over the duration of storage. Unlike PO, V. parahaemolyticus did not grow in SRO at any tested storage temperature. The average V. parahaemolyticus levels during storage were 2.6 ⫾ 0.4 log10 MPN/g at 15.3°C, 2.4 ⫾ 0.5 log10 MPN/g at 18°C, 3.8 ⫾ 0.3 log10 MPN/g at 21.8°C, 2.6 ⫾ 0.7 log10 MPN/g at 24.2°C, and 3.0 ⫾ 0.4 log10 MPN/g at 27.9°C. Primary models of total viable bacterial counts. The kinetics of TVC growth were determined using the seawater-injected control oysters in parallel with measuring V. parahaemolyticus in injected oysters. Growth on marine agar was observed at all storage temperatures tested (3.6 to 30.4°C). The average R2 value for the Baranyi model fitted to the eight kinetic growth profiles was 0.97 (Fig. 5). Growth rates increased with increasing temperature, specifically, 0.015, 0.023, 0.016, 0.048, 0.055, 0.071, 0.139, and 0.135 log10 CFU/h at 3.6, 6.2, 9.3, 14.9, 18.4, 20.0, 25.7, and 30.4°C, respectively. Maximum population densities depended on the storage temperature, and the levels observed were between 7.1 (30.4°C after 29 h) and 8.4 (3.6°C after 289 h) log10 CFU/g. Development and evaluation of a secondary model for total viable bacterial counts in Pacific oysters. The square root of the growth rate was plotted versus the storage temperature and fitted with the square root model as shown in Fig. 6a. The
FIG. 3. (a) Square root secondary model for V. parahaemolyticus growth. (b) Arrhenius model for inactivation. Shown are observed growth or inactivation rates (F) and the fitted model (lines).
estimated values for parameters b and To were 0.0102 and ⫺6.71, respectively (equation 5). The goodness of fit comparing observed and predicted values showed an RMSE of 0.02 and an R2 value of 0.93. The growth model was only applicable for a range of temperature from 3.6 to 30.4°C.
冑r ⫽ 0.0102 ⫻ 共T ⫹ 6.71兲
(5)
The secondary model (equation 5) was evaluated against TVC growth rates at two temperatures for PO and five temperatures for SRO harvested in NSW. TVC multiplied in PO at 18 and 24.2°C at 0.012 and 0.026 log10 CFU/h, respectively. Populations increased from 5 to 6 log MPN/g after 31.5 h storage at 24.2°C and after 89.5 h storage at 18°C. TVC growth in SRO was observed only at 24.2°C. At this temperature, populations increased from 5 log10 CFU/g to 6.7 log10 CFU/g over 103.5 h, showing a growth rate of 0.020 log10 CFU/h. Lower growth rates were observed than for model predictions for PO and SRO from NSW at all tested storage temperatures. TVC and V. parahaemolyticus models (equations 3, 4, and 5) were compared as shown in Fig. 6b. TVC rates were markedly greater than V. parahaemolyticus rates from approximately 4 to 23°C. However, V. parahaemolyticus growth rates exceeded those of TVC at temperatures greater than 23°C. DISCUSSION The development of a predictive model for V. parahaemolyticus viability in oysters can improve risk management practices by identifying temperatures to control growth during postharvest processing, storage, and transport. Such interven-
FIG. 4. Comparison of different secondary models for V. parahaemolyticus growth. (a) Model for V. parahaemolyticus (equation 3) (solid black line) and broth system reported by Yoon et al. (67) for the pathogenic strain (dashed line) and by Miles et al. (47) (solid gray line). (b) Model for live oysters derived from this study (equation 3) (solid black line), model for a Korean oyster slurry reported by Yoon et al. (67) for the pathogenic strain (dashed gray line), model in salmon meat by Yang et al. (65) (solid gray line), and the model proposed by the FDA (27) for American oysters (dashed black line).
8692
FERNANDEZ-PIQUER ET AL.
APPL. ENVIRON. MICROBIOL.
FIG. 5. Growth of TVC in live Pacific oysters stored at 3.6 to 30.4°C. Shown are counts (F) in log10 CFU/g and fitted curves (lines).
tions could decrease the risk of marketplace oysters exceeding the 10,000/g V. parahaemolyticus densities recommended by the FDA (17, 27) and also cases of infection from raw or undercooked oyster consumption (2). Although predictive models have been previously developed for V. parahaemolyticus viability in broth systems (47, 67) and in some food matrices (27, 65, 67), there is no such model for V. parahaemolyticus in live PO. In addition, little is known about Vibrio sp. viability in SRO. In this study, data for model development were based on artificial inoculation of oysters by injection into the adductor muscle, a technique previously used to study summer mortalities for PO (29). Other studies have contaminated oysters by placing them in seawater aquaria inoculated with V. parahaemolyticus (57). It is possible that different routes of inoculation might affect the distribution of V. parahaemolyticus in oyster tissues. For example, in natural oysters, V. parahaemolyticus and Vibrio vulnificus appear to accumulate at higher densities in the digestive glands than in other tissues (60, 63). To account for this possibility, V. parahaemolyticus growth rates using injected oysters were compared with natural levels of the bacteria in model evaluation experiments. PO were injected with a cocktail of pathogenic and nonpathogenic V. parahaemolyticus strains to produce a model more representative of environmental conditions. The use of fast-growing strains for modeling pathogenic V. parahaemolyti-
FIG. 6. (a) Square root secondary model for TVC growth. Shown are observed rates (F) and the fitted model (line). (b) Comparison of secondary models for TVC (equation 5) (solid line) and V. parahaemolyticus (equations 3 and 4) (dashed line) in Pacific oysters.
cus has also been reported (47). Although the same strain may not display the fastest growth under all conditions (54), a model based on a strain cocktail will generally result in more fail-safe predictions. Levels of V. parahaemolyticus injected in PO were stable at 14.9°C during all experiments and increased or decreased at other storage temperatures. Based on various reports, 15°C storage may be close to the lower temperature boundary for V. parahaemolyticus. In a Korean oyster slurry, growth of V. parahaemolyticus was not observed at 15°C (67), whereas levels increased in artificially contaminated oysters (Crassostrea plicatula) at this temperature (57). Growth of V. parahaemolyticus at temperatures above 20°C has been previously reported for American oysters (12, 30) and in a Korean oyster slurry (67). The estimated growth rate in American oysters stored at 26°C was 0.17 log10/h (30); a lower growth rate was observed in this study for artificially contaminated PO. The maximum population densities observed in this study were different for each storage condition tested; the highest was approximately 7.4 log10 CFU/g at 25.7°C. This exceeds the 6 log10 CFU/g maximum population density reported in an artificially inoculated Korean oyster slurry at 20°C (67) and the 5.8 log10 CFU/g for naturally occurring V. parahaemolyticus in American oysters stored at 26°C (30). In addition to direct thermal effects, other factors that may influence V. parahaemolyticus growth include the types and levels of competitive endogenous bacteria, host defense systems that vary by oyster species, and the possible release of antimicrobial factors when oyster tissue is homogenized (i.e., in a tissue slurry). The lag phase parameter was not considered for primary modeling. It is reasonable not to assume a lag phase when there are no adverse conditions of temperature, pH, water activity, or nutrient availability that could stress bacteria and induce lag time (30), and it is a more fail-safe approach. Numerous studies have reported that V. parahaemolyticus is sensitive to and gradually inactivated by cold storage temperatures. Below 12.6°C, levels of injected V. parahaemolyticus in PO decreased. Similarly, V. parahaemolyticus growth was not
VOL. 77, 2011
V. PARAHAEMOLYTICUS AND TVC MODELS FOR C. GIGAS
observed at 10°C in a Korean oyster slurry and in American oysters (12, 67). In contrast, the minimum temperature for V. parahaemolyticus growth in broth has been reported to vary between 5°C (9) and 8.3°C (47). Differences in the minimum temperature for growth and survival of V. parahaemolyticus can be due to strain variation (9) and/or to the sample matrix (67). We observed a reduction of 2.5 log10 CFU/g after 18 days storage at 3.6°C, which is higher than the 0.8 log10 CFU/g reduction for natural populations in American oysters after 14 to 17 days storage at 3°C (30). The square root model (equation 3) described slower growth than for previous V. parahaemolyticus models, with the exception of a Korean oyster slurry (Fig. 4b). Differences among these studies could be due to different food matrices, strain variability, and/or the role of oyster host defenses. Oysters containing natural populations of V. parahaemolyticus were used for model validation. Levels of V. parahaemolyticus in PO and SRO after nonrefrigerated shipment to the laboratory for approximately 26 h during summer and early autumn were in the range of 2.4 to 4.0 log10 MPN/g. These levels are in agreement with reported concentrations of V. parahaemolyticus ranging from 0.4 MPN/g to 4.4 log10 MPN/g and a median of 3 log10 MPN/g in purified live NSW SRO sampled at wholesale (24). A similar V. parahaemolyticus average level of 2.4 log10 CFU/g was found in purified live SRO shipped from NSW to Tasmania in April 2002 (40). These reported V. parahaemolyticus levels are also similar to the 2 log10 to 3 log10 CFU/g observed in summer American oysters (18). The V. parahaemolyticus model predicted growth for all validation study temperatures; however, growth was only observed at 23 and 28°C, and at lower rates. This could be due to variation in the levels and types of competitive flora among different oyster-growing regions and/or differences in bacterial strains. These experiments were performed at SARDI laboratories, and possibly shorter shipment time from NSW to SARDI laboratories, compared to those in Tasmania, may have caused changes in the profiles of the background bacteria. Interestingly, SRO did not allow V. parahaemolyticus growth at any storage temperature tested. This agrees with other reported studies in which V. parahaemolyticus counts did not increase significantly when SRO were stored at 30°C for as long as 7 days (24). It has been noted that SRO are unique in being able to survive high air temperature up to 36°C and a wide salinity range of 1.5 to 5.5% (48). Such resistance to V. parahaemolyticus growth may indicate that SRO have enhanced host defenses. Reports show that V. parahaemolyticus pathogenic strains have longer lag times and lower growth rates than nonpathogenic strains (67) and that levels of pathogenic strains are generally several log units lower than total V. parahaemolyticus levels in harvested oysters (17, 18, 52). We used a combination of strains that possessed the tdh and trh genes as virulence markers, as well as nonpathogenic strains. Criticisms are that these major virulence factors may not fully account for the growth of all clinical strains (32, 62). Specifically, a heat-labile protein (protease A) produced by a clinical V. parahaemolyticus tdh- and trh-negative strain has been identified as a potential virulence factor (39). Furthermore, recent outbreaks have
8693
been related to a nonpandemic tdh- and trh-negative strain (28). Environmental levels of V. parahaemolyticus are commonly measured by the MPN method described in standard methods for the examination of foods (33a, 58a). However, this method is time-consuming and labor-intensive and is not amenable to studies where numerous time intervals are necessary to build a robust model. In this regard, several scientific studies describe alternative but equally valid methods to enumerate pathogenic and nonpathogenic V. parahaemolyticus strains by colony hybridization, real-time PCR, or both (17, 34, 51, 52). For model development, we used the TCBS direct-plating method because V. parahaemolyticus cells were injected into oysters at levels well above the low background (⬍600 CFU/g) levels of indigenous Vibrio spp. When background Vibrio spp. were detected in controls, it was after exponential growth of the injected V. parahaemolyticus strains. In addition, enumeration comparing direct plating on TCBS and conventional MPN methods, as described by Kaysner and DePaola (36), at six time intervals showed they were not significantly different (Student’s t test; P ⬎ 0.05). For validation studies, the MPN-PCR format was preferred over plating enrichments on TCBS because the former method was not influenced by non-V. parahaemolyticus bacteria that can also grow on TCBS and interfere with detection (22). The MPN-PCR method has been evaluated successfully for V. parahaemolyticus detection and enumeration in seafood samples (8). The sensitivity of the MPN-PCR method used in this study was examined, and it was found to detect the tlh gene when enrichment broth was seeded with as few as 1.3 cells/ml. The kinetics of TVC growth were studied. There was an approximate increase of 2.5 and 3 log10 CFU/g in TVC for PO stored at 20.0°C for 3 days and at 6.2°C for 10 days, respectively. TVC levels have also been measured in American oysters, where an increase of approximately 3 log units was observed after storage at 7 and 21°C for 10 days (41) and an increase of approximately 1 log10 was observed after storage at 22°C for 3 days (12). Differences among studies could be due to different oyster species and medium compositions (e.g., the NaCl level), as well as incubation temperatures, which can select for the growth of different indigenous bacterial species. The secondary model for TVC (equation 5) predicted higher growth rates than those observed for PO and SRO from NSW. Possible reasons may include that the growing waters in NSW select for a different type of bacterial flora, as mentioned for previous similar observations (41), showing different growth rates than bacteria found in the relatively cooler waters in Tasmania. Also, injection of seawater may have injured oyster tissues, causing a release of nutrients, a change in oyster physiology, and/or weaker defense systems that resulted in higher bacterial growth. The bivalve feeding rate is temperature dependent, and oysters harvested from different locations and at different times may have had different bacterial species compositions and concentrations. Furthermore, oyster shipments from NSW could have enhanced the growth of certain bacteria compared to those occurring at harvest. Similar to V. parahaemolyticus validation studies, TVC rates differed between PO and SRO. For example, TVC growth at 24.2°C was approximately 1.5 times slower in SRO than in PO. When the TVC model is compared to the V. parahaemolyti-
8694
FERNANDEZ-PIQUER ET AL.
cus model (Fig. 6b), we observe that V. parahaemolyticus shows higher growth rates than TVC at temperatures above 23°C. Since sensory analyses were not performed in this study, it cannot be determined if V. parahaemolyticus would grow to high levels before consumers reject the product. In the case of V. vulnificus, elevated levels in American oysters during storage trials were observed before 100% sensory rejection (41). The authors suggested that simple olfactory analysis of raw shellstock may not be an adequate means to prevent oysterassociated V. vulnificus infections. The V. parahaemolyticus mathematical models reported in this study can be used by regulatory agencies, oyster producers, and consumers to minimize the risk of illness, enhance product quality, and manage supply chains. The models for V. parahaemolyticus viability (i.e., growth and inactivation) reduce uncertainty in the exposure model component of the FDA V. parahaemolyticus risk assessment, as the growth rate was estimated from broth-based studies and extrapolated to oysters for only one temperature (25). Kinetic data for V. parahaemolyticus viability in PO and SRO generated during this study have been submitted to the United Nations Food and Agriculture Organization/World Health Organization risk assessment group in response to a 2010 call for data. These data will be used to evaluate the validity of models used to help nations manage Vibrio sp. risk in foods. These models might also be integrated with remote sensing technology to predict growth of V. parahaemolyticus based on harvest levels measured by satellite infrared spectra of surface seawater temperature. This technology has been applied to V. parahaemolyticus levels in oysters at harvest, and it was concluded that data obtained from remote sensing could substitute for direct measurements (53). This study took a worst-case approach, using a cocktail of strains to observe higher growth and lower inactivation rates. Variability in survival and growth among V. parahaemolyticus strains has been observed in broth systems at different temperatures (9, 47). This can be due to intrinsic properties of the strains and/or to variation in strain susceptibility to isolation media (31). A stochastic approach would also be useful to describe these uncertainties. With further refinement and validation, the model for TVC growth in PO could be used to manage oyster supply chains and to identify practices that limit TVC growth (i.e., reduce spoilage). The levels of TVC that correlate with oyster spoilage and other organoleptic properties have not yet been determined. This study reports the development and evaluation of models for V. parahaemolyticus and TVC growth in live C. gigas based on the effect of postharvest temperature in the range of 3.6 to 30.4°C. This knowledge will be translated into tertiary models (computer software programs) that can be used by the oyster industry to optimize process conditions and reduce the risk of V. parahaemolyticus illness. The models are overly fail safe for SRO, requiring a separate approach yet indicating that temperature controls for the species could be different to manage V. parahaemolyticus risk. ACKNOWLEDGMENTS This work formed part of a project of the Australian Seafood Cooperative Research Centre and received funds from the Australian
APPL. ENVIRON. MICROBIOL. Government’s CRC program, the Fisheries R&D Corporation, and other CRC participants. We thank Tom Madigan, Damian May, and Cath McLeod of the South Australian Research and Development Institute for collaboration with Pacific Oyster studies and the Australian Shellfish Quality Assurance Program managers and the Department of Primary Industries in Tasmania, New South Wales, and South Australia for support and participation in the project. REFERENCES 1. Anonymous. 2005. Case study: Ring Ring, p. 30. In NSW Food Authority (ed.), Annual report 2004/2005. NSW Food Authority, Silverwater, NSW, Australia. 2. Anonymous. 2010. Preliminary FoodNet data on the incidence of infection with pathogens transmitted commonly through food—10 states, 2009. MMWR Morb. Mortal. Wkly. Rep. 59:418–422. 3. Arrhenius, S. 1915. Quantitative laws in biological chemistry. G. Bell and Sons, Ltd., London, United Kingdom. 4. Baranyi, J., and T. A. Roberts. 1994. A dynamic approach to predicting bacterial growth in food. Int. J. Food Microbiol. 23:277–294. 5. Baranyi, J., and M. L. Tamplin. 2004. ComBase: a common database on microbial responses to food environments. J. Food Prot. 67:1967–1971. 6. Bej, A. K., et al. 1999. Detection of total and hemolysin-producing Vibrio parahaemolyticus in shellfish using multiplex PCR amplification of tl, tdh and trh. J. Microbiol. Methods 36:215–225. 7. Blackstone, G. M., et al. 2003. Detection of pathogenic Vibrio parahaemolyticus in oyster enrichments by real time PCR. J. Microbiol. Methods 53: 149–155. 8. Blanco-Abad, V., J. Ansede-Bermejo, A. Rodriguez-Castro, and J. MartinezUrtaza. 2009. Evaluation of different procedures for the optimized detection of Vibrio parahaemolyticus in mussels and environmental samples. Int. J. Food Microbiol. 129:229–236. 9. Burnham, V. E., et al. 2009. Growth and survival differences of Vibrio vulnificus and Vibrio parahaemolyticus strains during cold storage. J. Food Sci. 74:M314–M318. 10. Colwell, R. R. 1984. Vibrios in the environment, p. 48. John Wiley and Sons, New York, NY. 11. Cook, D. W., et al. 2002. Vibrio vulnificus and Vibrio parahaemolyticus in U.S. retail shell oysters: a national survey from June 1998 to July 1999. J. Food Prot. 65:79–87. 12. Cook, D. W., and A. D. Ruple. 1989. Indicator bacteria and Vibrionaceae multiplication in post-harvest shellstock oysters. J. Food Prot. 52:343–349. 13. Daniels, N. A., et al. 2000. Vibrio parahaemolyticus infections in the United States, 1973–1998. J. Infect. Dis. 18:1661–1666. 14. Davey, G. R. 1985. Food poisoning in New South Wales: 1977–84. Food Technol. Aust. 37:453–457. 15. Deepanjali, A., H. Sanath-Kumar, I. Karunasagar, and I. Karunasagar. 2005. Seasonal variation in abundance of total and pathogenic Vibrio parahaemolyticus bacteria in oysters along the southwest coast of India. Appl. Environ. Microbiol. 71:3575–3580. 16. DePaola, A., L. H. Hopkins, J. T. Peeler, B. Wentz, and R. M. McPhearson. 1990. Incidence of Vibrio parahaemolyticus in U.S. coastal waters and oysters. Appl. Environ. Microbiol. 56:2299–2302. 17. DePaola, A., et al. 2010. Bacterial and viral pathogens in live oysters: 2007 United States market survey. Appl. Environ. Microbiol. 76:2754–2768. 18. DePaola, A., J. L. Nordstrom, J. C. Bowers, J. G. Wells, and D. W. Cook. 2003. Seasonal abundance of total and pathogenic Vibrio parahaemolyticus in Alabama oysters. Appl. Environ. Microbiol. 69:1521–1526. 19. Desmarchelier, P. M. 2003. Pathogenic vibrios, p. 333–358. In A. D. Hocking (ed.), Foodborne microorganisms of public health significance, 6th ed. Australian Institute of Food Science and Technology, Waterloo, NSW, Australia. 20. Desmarchelier, P. M. 1978. Vibrio parahaemolyticus and other vibrios. Food Technol. Aust. 30:339–345. 21. Devlieghere, F., K. Francois, B. De Meulenaer, and K. Baert. 2006. Modelling food safety, p. 397–437. In P. A. Luning, F. Devlieghere, and R. Verhe (ed.), Safety in the agri-food chain. Wageningen Academic Publishers, Wageningen, The Netherlands. 22. Dileep, V., et al. 2003. Application of polymerase chain reaction for detection of Vibrio parahaemolyticus associated with tropical seafoods and coastal environment. Lett. Appl. Microbiol. 36:423–427. 23. Eyles, M. J., and G. R. Davey. 1984. Microbiology of commercial depuration of the Sydney Rock oyster, Crassostrea commercialis. J. Food Prot. 47:703– 706. 24. Eyles, M. J., G. R. Davey, and G. Arnold. 1985. Behavior and incidence of Vibro parahaemolyticus in Sydney rock oysters (Crassostrea commercialis). Int. J. Food Microbiol. 1:327–334. 25. FDA. 2005. Quantitative risk assessment on the public health impact of pathogenic Vibrio parahaemolyticus in raw oysters. FDA, Washington, DC. 26. FDA. 2007. Control of shellfish harvesting. National Shellfish Sanitation Program guide for the control of molluscan shellfish. FDA, Washington, DC.
VOL. 77, 2011
V. PARAHAEMOLYTICUS AND TVC MODELS FOR C. GIGAS
27. FDA. 2007. Naturally occurring pathogens. National Shellfish Sanitation Program guide for the control of molluscan shellfish. FDA, Washington, DC. 28. García, K., et al. 2009. Dynamics of clinical and environmental Vibrio parahaemolyticus strains during seafood-related summer diarrhea outbreaks in southern Chile. Appl. Environ. Microbiol. 75:7482–7487. 29. Garnier, M., Y. Labreuche, C. Garcia, M. Robert, and J. L. Nicolas. 2007. Evidence for the involvement of pathogenic bacteria in summer mortalities of the Pacific oyster Crassostrea gigas. Microb. Ecol. 53:187–196. 30. Gooch, J. A., A. DePaola, J. Bowers, and D. L. Marshall. 2002. Growth and survival of Vibrio parahaemolyticus in postharvest American oysters. J. Food Prot. 65:970–974. 31. Hara-Kudo, Y., et al. 2001. Improved method for detection of Vibrio parahaemolyticus in seafood. Appl. Environ. Microbiol. 67:5819–5823. 32. Honda, T., T. Iida, Y. Akeda, and T. Kodama. 2008. Sixty years of Vibrio parahaemolyticus research. Microbe 3:462–466. 33. Hunt, D. A., J. Miescier, J. Redman, A. Salinger, and J. P. Lucas. 1984. Molluscan shellfish, fresh or fresh frozen oysters, mussels, or clams, p. 592– 595. In M. L. Speck (ed.), Compendium of methods for the microbiological examination of foods, 2nd ed. American Public Health Association, Washington, DC. 33a.International Organization for Standardization. 2007. Technical specification. ISO/TS 21872-1, Microbiology of food and animal feeding stuffs— horizontal method for the detection of potentially enteropathogenic Vibrio spp., part 1, detection of Vibrio parahaemolyticus and Vibrio cholerae. International Organization for Standardization, Geneva, Switzerland. 34. Johnson, C. N., et al. 2010. Relationships between environmental factors and pathogenic Vibrios in the Northern Gulf of Mexico. Appl. Environ. Microbiol. 76:7076–7084. 35. Kaufman, G. E., A. K. Bej, J. Bowers, and A. DePaola. 2003. Oyster-to-oyster variability in levels of Vibrio parahaemolyticus. J. Food Prot. 66:125–129. 36. Kaysner, C. A., and A. DePaola. 2004. Bacteriological analytical manual, FDA online, chapter 9. FDA, Washington, DC. http://www.fda.gov/Food /ScienceResearch/LaboratoryMethods/BacteriologicalAnalyticalManualBAM /ucm070830.htm. 37. Kaysner, C. A., M. L. Tamplin, M. M. Wekell, R. F. Stott, and K. G. Colburn. 1989. Survival of Vibrio vulnificus in shellstock and shucked oysters (Crassostrea gigas and Crassostrea virginica) and effects of isolation medium on recovery. Appl. Environ. Microbiol. 55:3072–3079. 38. Kraa, E. 1995. Surveillance and epidemiology of foodborne illness in NSW, Australia. Food Aust. 47:418–423. 39. Lee, C. Y., M. F. Cheng, M. S. Yu, and M. J. Pan. 2002. Purification and characterization of a putative virulence factor, serine protease, from Vibrio parahaemolyticus. FEMS Microbiol. Lett. 209:31–37. 40. Lewis, T., M. Brown, G. Abell, T. A. McMeekin, and J. Sumner. 2003. Pathogenic Vibrio parahaemolyticus in Australian oysters. Project 2002/409. University of Tasmania, Hobart, Australia. 41. Lorca, T. A., M. D. Pierson, G. J. Flick, and C. R. Hackney. 2001. Levels of Vibrio vulnificus and organoleptic quality of raw shellstock oysters (Crassostrea virginica) maintained at different storage temperatures. J. Food Prot. 64:1716–1721. 42. Madigan, T. L., K. J. Lee, A. M. Pointon, and C. J. Thomas. 2007. A supply-chain assessment of marine Vibrios in Pacific oysters in South Australia: prevalence, quantification and public health risk. Project 2005/401. Univeristy of Adelaide, Adelaide, Australia. 43. Mahmoud, B. S. M., and D. D. Burrage. 2009. Inactivation of Vibrio parahaemolyticus in pure culture, whole live and half shell oysters (Crassostrea virginica) by X-ray. Lett. Appl. Microbiol. 48:572–578. 44. Marques, A., M. L. Nunes, S. K. Moore, and M. S. Strom. 2010. Climate change and seafood safety: human health implications. Food Res. Int. 43: 1766–1779. 45. Martinez-Urtaza, J., J. C. Bowers, J. Trinanes, and A. DePaola. 2010. Climate anomalies and the increasing risk of Vibrio parahaemolyticus and Vibrio vulnificus illnesses. Food Res. Int. 43:1780–1790. 46. McMeekin, T., et al. 2008. The future of predictive microbiology: strategic research, innovative applications and great expectations. Int. J. Food Microbiol. 128:2–9. 47. Miles, D. W., T. Ross, J. Olley, and T. A. McMeekin. 1997. Development and
8695
evaluation of a predictive model for the effect of temperature and water activity on the growth rate of Vibrio parahaemolyticus. Int. J. Food Microbiol. 38:133–142. 48. Nell, J. A. 1993. Farming the Sydney rock oyster (Saccostrea commercialis) in Australia. Rev. Fisheries Sci. 1:97–120. 49. Nishibuchi, M., and J. B. Kaper. 1985. Nucleotide sequence of the thermostable direct hemolysin gene of Vibrio parahaemolyticus. J. Bacteriol. 162: 558–564. 50. Nishibuchi, M., et al. 1989. Cloning and nucleotide-sequence of the gene (trh) encoding the hemolysin related to the thermostable direct hemolysin of Vibrio parahaemolyticus. Infect. Immun. 57:2691–2697. 51. Nordstrom, J. L., M. C. L. Vickery, G. M. Blackstone, S. L. Murray, and A. DePaola. 2007. Development of a multiplex real-time PCR assay with an internal amplification control for the detection of total and pathogenic Vibrio parahaemolyticus bacteria in oysters. Appl. Environ. Microbiol. 73:5840– 5847. 52. Parveen, S., et al. 2008. Seasonal distribution of total and pathogenic Vibrio parahaemolyticus in Chesapeake Bay oysters and waters. Int. J. Food Microbiol. 128:354–361. 53. Phillips, A. M. B., A. DePaola, J. Bowers, S. Ladner, and D. J. Grimes. 2007. An evaluation of the use of remotely sensed parameters for prediction of incidence and risk associated with Vibrio parahaemolyticus in Gulf Coast oysters (Crassostrea virginica). J. Food Prot. 70:879–884. 54. Rasch, M. 2004. Experimental design and data collection, p. 1–20. In R. C. Mckellar and X. Lu (ed.), Modeling microbial responses in food. CRC Press, Boca Raton, FL. 55. Ratkowsky, D. A. 2004. Model fitting and uncertainty, p. 151–196. In R. C. Mckellar and X. Lu (ed.), Modeling microbial responses in food. CRC Press, Boca Raton, FL. 56. Ratkowsky, D. A., J. Olley, T. A. McMeekin, and A. Ball. 1982. Relationship between temperature and growth rate of bacterial cultures. J. Bacteriol. 149:1–5. 57. Shen, X., et al. 2009. Effect of temperature on uptake and survival of Vibrio parahaemolyticus in oysters (Crassostrea plicatula). Int. J. Food Microbiol. 136:129–132. 58. Shirai, H., et al. 1990. Molecular epidemiologic evidence for association of thermostable direct hemolysin (TDH) and TDH-related hemolysin of Vibrio parahaemolyticus with gastroenteritis. Infect. Immun. 58:3568–3573. 58a.Standards Association of Australia/Standards New Zealand. 1997. Food microbiology. Method 2.9, examination for specific organisms: Vibrio parahaemolyticus. AS/NZS 1766.2.9:1997. Standards Australia, Homebush, NSW, Australia. 59. Su, Y.-C., and C. Liu. 2007. Vibrio parahaemolyticus: a concern of seafood safety. Food Microbiol. 24:549–558. 60. Tamplin, M. L., and G. M. Capers. 1992. Persistence of Vibrio vulnificus in tissues of gulf coast oysters, Crassostrea virginica, exposed to seawater disinfected with UV light. Appl. Environ. Microbiol. 58:1506–1510. 61. Taniguchi, H., H. Ohta, M. Ogawa, and Y. Mizuguchi. 1985. Cloning and expression in Escherichia coli of Vibrio parahaemolyticus thermostable direct hemolysin and thermolabile hemolyisin genes. J. Bacteriol. 162:510–515. 62. Vongxay, K., et al. 2008. Pathogenetic characterization of Vibrio parahaemolyticus isolates from clinical and seafood sources. Int. J. Food Microbiol. 126:71–75. 63. Wang, D., S. Yu, W. Chen, D. Zhang, and X. Shi. 2010. Enumeration of Vibrio parahaemolyticus in oyster tissues following artificial contamination and depuration. Lett. Appl. Microbiol. 51:104–108. 64. Weis, K. E., R. M. Hammond, R. Hutchinson, and G. M. Blackmore. 2011. Vibrio illness in Florida, 1998-2007. Epidemiol. Infect. 139:591–598. 65. Yang, Z.-Q., et al. 2009. Predictive model of Vibrio parahaemolyticus growth and survival on salmon meat as a function of temperature. Food Microbiol. 26:606–614. 66. Yeung, P. S., and K. J. Boor. 2004. Epidemiology, pathogenesis, and prevention of foodborne Vibrio parahaemolyticus infections. Foodborne Pathog. Dis. 1:74–88. 67. Yoon, K. S., et al. 2008. A model of the effect of temperature on the growth of pathogenic and nonpathogenic Vibrio parahaemolyticus isolated from oysters in Korea. Food Microbiol. 25:635–641.