Preliminary draft: Please do not cite this version of the paper.
Strengthening the Resilience of the Zimbabwean Economy to Higher Food and Fuel Prices
Godfrey Mahofa and Anna Strutt1 University of Cape Town and University of Waikato November 2013
1
The findings, interpretations and conclusions expressed herein are those of the authors and do not necessarily reflect the view of the World Bank Group, its Board of Directors or the governments they represent. Contact author is Godfrey Mahofa
[email protected].
Abstract
After experiencing a decade-long recession, the Zimbabwean economy is now on a recovery path. However, economic recovery efforts in the country may be hampered by international market shocks particularly increases in global food and fuel prices. In this paper, we analyse the impact of higher international prices on the Zimbabwean economy using a multi-region, multisector computable general equilibrium model, known as the Global Trade Analysis Project (GTAP) model. We enhance the standard GTAP model using MyGTAP to incorporate household survey data for Zimbabwe into the model, facilitating richer and more comprehensive analysis of different households within the economy. Our results suggest that some macroeconomic variables such as real GDP are likely to decline as a result of the food and fuel price shocks, with urban households tending to suffer more from such shocks. This paper also aims to identify potential policy responses to help mitigate the negative impacts of higher food and fuel prices on Zimbabwe. Understanding the impact of economic policies in the presence of external market shocks is critical for the design of policies aimed at strengthening the economy’s resilience to these kinds of international commodity price rises. We find that policies which reduce trade transaction costs or remove tariffs appear potentially important for cushioning the Zimbabwean economy from higher world prices. Key words: Food and Fuel prices, Zimbabwe, price volatility, policy responses, MyGTAP
2
Contents Abstract ........................................................................................................................................... 2 1. Introduction ................................................................................................................................. 6 2. Impact of higher food and fuel prices ......................................................................................... 9 2.1 Trends in commodity prices................................................................................................................ 9 2.2 Impacts of higher commodity prices ................................................................................................. 11
3. Empirical framework ................................................................................................................ 14 3.1 GTAP Model and projections to 2015 .............................................................................................. 14 3.2 Splitting Zimbabwe households using MyGTAP ............................................................................. 15 3.3 Closure .............................................................................................................................................. 16
4. Scenarios considered................................................................................................................. 17 4.1 Commodity price shocks ................................................................................................................... 17 4.2 Policy responses ................................................................................................................................ 18
5. Empirical results and discussion ............................................................................................... 20 5.1 Overall impacts and assessment ........................................................................................................ 20 5.2 Impact of potential policy responses ................................................................................................. 26 5.4 Sensitivity analysis and some qualifications ..................................................................................... 32
6. Concluding remarks .................................................................................................................. 33
3
List of Figures
Figure 1: Trends in world food and fuel prices (commodity price indices, 2000=100) ............... 11 Figure 2: Trade balance by commodity in the initial database (million US dollars) .................... 21 Figure 3: Effect on real sectoral output (% change) ..................................................................... 24
4
List of Tables
Table 1: International Price Shocks .............................................................................................. 18 Table 2: Impact of world price increase on the Zimbabwean Economy (percentage changes) ... 22 Table 3: Impact on trade: change in the value of commodity trade (US$ million) ...................... 23 Table 4: Impact of price shocks on real factor prices in Zimbabwe ............................................. 26 Table 6: Impact of policy responses on real sectoral output (percentage changes) ...................... 28 Table 7: Impact of policy responses on real factor prices in Zimbabwe ...................................... 29 Table 8: Impacts on household income (percentage changes) ..................................................... 31
5
1. Introduction The Zimbabwean economy has experienced an economic crisis and a decade-long recession. During this period the country experienced hyper-inflation, reaching an estimated monthly rate of 79.6 billion percent in mid-November 2008 – the second highest inflation in world history (Hanke and Kwok, 2009). Zimbabwe suffered continued periods of negative real Gross Domestic Product (GDP) growth, massive devaluation of the currency, low productive capacity utilization (below 10 percent for the manufacturing sector), high levels of unemployment, food shortages and massive de-industrialization (Ministry of Economic Planning, 2009). Although now on a recovery path, per capita GDP was lower in 2010 than during the 1980s and the country remains one of the poorest in Southern Africa (World Development Indicators, 2012). Most of the key sectors, including agriculture and mining, experienced sharp declines in growth rates and the fiscal situation also deteriorated. Even prior to the recent economic crisis, there were worrying increases in poverty in Zimbabwe, with the national headcount poverty ratio more than doubling from 35% in 1993 to 72% in 2003 (World Development Indicators, 2012). Although the proportion of households below the poverty line in urban areas remains lower than in rural areas, even urban poverty increased strikingly from 8% in 1993 to 42% in 2001 (World Bank Development Indicators, 2012). These general trends in development indicators can be viewed against a background of political instability and adoption of poor economic and agricultural policies by the Zimbabwean government. Since the end of 1997, the economy of Zimbabwe started to deteriorate sharply, following the Government’s involvement in the Democratic Republic of Congo conflict and payments of packages to liberation war veterans. This unbudgeted expenditure resulted in the crash of the Zimbabwe dollar in mid-November 1997 and prices of commodities started to increase. Also during this period the government embarked on the controversial Fast Track Land Reform Programme, which destroyed the agricultural sector, resulting in increased food
6
insecurity and poverty. The problems were increased by the withdrawal of multilateral and bilateral donor support to the country in early 2000.2 In 2008, the signing of a Global Political Agreement between the two main political parties and adoption of a multicurrency system brought a new era in the economy of the country (Ministry of Economic Planning, 2009). The parties agreed to restore economic stability and growth through implementing an economic recovery strategy and plan. However, despite significant improvements in economic policies, important policy challenges and vulnerabilities remain in trying to address economic problems (IMF, 2010). Since 2006 the prices of food and fuels in international markets have been on the increase and the prices have remained highly volatile (FAO, 2012). In particular, maize prices in Zimbabwe are extremely volatile as compared to other countries in the region (Minot, 2012). These price rises and volatility pose a significant threat to the economic recovery process in Zimbabwe. High food and fuel prices in international commodity markets will impact on the functioning of the economy, particularly since Zimbabwe is dependent on revenue from exports of agricultural products and also on imported commodities for intermediate and final use. Fuels, food, machinery, chemicals, manufactured goods, transport equipment and passenger cars accounted for a large share of imports in 2011 (Ministry of Finance, 2011). Rising world prices in key commodities are likely to impact adversely on the terms of trade for an import dependent country like Zimbabwe, with consequences for the balance of payments and the rest of the economy. The World Bank (2008) notes there are various factors which determine whether high food prices will improve or worsen the situation of particular households. First, the impacts of high prices differ across households in a country, depending on whether they are net producers or consumers of the commodity concerned. Net producers of food are expected to gain from high prices whereas net consumers tend to suffer. High prices therefore affect urban and rural households differently, with the overall impact depending on whether the gains to net producers outweigh the adverse impacts on consumers (Ivanic and Martin, 2008). Second, the impact also depends on the products involved. If products consumed by poor households have increased in price, we expect greater damage to poor households. Third, the patterns of household incomes 2
See Coomer and Gstraunthaler (2011), Chitiga and Mabugu (2008) for discussion of these and associated issues impacting the Zimbabwean economy.
7
and expenditure will determine the poverty impacts of higher prices. Low income households spending most of their income on food will be hurt more by increased food prices than high income households which spend a lower proportion of their budget on food items. Finally, the policy responses of government have an important bearing on how different households will be affected by higher prices. Empirical evidence recently has shown that domestic price insulation mechanisms, such as trade restrictions, have actually increased the spike in world food prices and the poverty-reduction impacts of such insulating policies in developing countries is low (Anderson et al., 2013). Recent historical experience in Zimbabwe does not seem to indicate that useful policies were put in place to protect households from commodity price increases. For example, following the increase in world prices of commodities in 2007, the Government of Zimbabwe imposed price controls on basic food items. However, during this period up to the end of 2008, the country was experiencing hyperinflation caused by quasi-fiscal operations undertaken by the Central Bank and these policy responses were probably an attempt to curb domestic inflation. In the fuel market, the government officially controlled the distribution of fuel at controlled prices to government institutions and selected individuals. This resulted in the creation of a black market, where fuel was available at high prices reflecting world prices.3 After the formation of the Government of National Unity and adoption of a multi-currency regime in 2009 (Mutengezanwa et al. 2012), the government liberalized grain markets, but policy inconsistencies still prevail. For example, in 2012 the government imposed tariffs on selected foodstuffs such as vegetables, maize-meal, cooking oil, flour and rice. Regional import tariffs on agricultural products such as potatoes, tomatoes, onions and other related products were increased from 10% to 25% (Ministry of Finance, 2011). These tariffs are mainly directed at imports coming from South Africa. The government also continues to intervene in the fuel market and recently there was an increase in excise duty on diesel and petrol. The excise duty on diesel and petrol was increased from 16 and 20 cents per litre to 20 and 25 cents per litre respectively, with effect from 1 August 2012 (Ministry of Finance, 2012). This increase in excise duty on the back of volatile international oil markets may have a negative impact on the economy. Higher fuel prices result in market wide price adjustments, due to the increase in 3
See Jones (2010) and IMF (2008) for further discussion of these issues.
8
transport cost, which in turn will jeopardize the recovery of an already fragile economy. The impacts are likely to be exacerbated by power shortages, since most companies have to resort to generators since the capacity of the country to generate electricity for use in industry was destroyed with the economic recession and damage to infrastructure. To improve policy in Zimbabwe, there is need for a clearer understanding of the effect of various policies on the economy in the presence of external market shocks. Research examining the impact of world market shocks on the Zimbabwean economy and possible policy responses is scant, exacerbating the inability of policymakers to come up with clear economic policy solutions. The current study examines the impact of higher food and fuel prices on the Zimbabwean economy and evaluates policy options that may be used to mitigate the impact of such shocks. We also consider the distributional impacts of policy responses by examining impacts on different types of households.
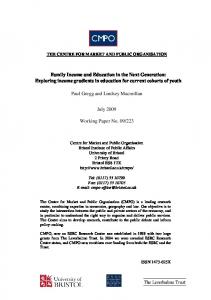
2. Impact of higher food and fuel prices 2.1 Trends in commodity prices Since 2006 the prices of main staple food crops such as maize, wheat, and rice have increased in world markets. According to the FAO, food prices rose by 7% in 2006 and 27% in 2007, and the increase continued until the first half of 2008. Figure 1 shows the trends in prices of fuel and food in international markets. Generally world prices of fuels and food have been on the increase since the 1970s, reaching a peak in 2008. While world commodity prices then fell back somewhat, by 2012, the FAO food price index was above the 2008 peak, suggesting that the upward trend remains. The prices of commodities such as cereals, oils and sugar contributed much to the increase in the food price index (FAO, 2010). Some projections suggest that commodity prices are likely to remain high for the next decade. Anderson and Strutt (2012) discuss a range of alternative views on long-term international agricultural prices. Their own core projection to 2030 allows the price of farm products to be only slightly higher than their 2004 baseline prices; however they also model the potential for significant increases in primary product prices under alternative scenarios over the next few decades. 9
There are a number of developments in international commodity markets which help to explain significant fluctuations in prices; chief among them is the positive relationship between food and oil prices. This is related to policies recently set by some countries which encouraged the use of maize and other oil crops for the production of biofuels (Ogg, 2010). Biofuels production could raise future prices of maize and other crops by 72% (Rosengrant et al., 2008) as encouraging the use of these crops to produce fuel will raise prices of food since the supply of food in the market will decline. Ogg (2010) noted that if oil prices move upwards towards $160 per barrel, subsidized production of biofuels will increase and the amount of crops produced for food would decline, resulting in increase in the price of food. On the other hand if oil prices fall below a certain threshold of say $40 per barrel, maize prices will also fall because oil is now affordable and there is no need to encourage biofuels production to substitute for the expensive oil. Other factors contributing to the increased volatility in commodity prices are; (1) strong demand in emerging economies such as China, India, South Africa and Russia, although softening recently, (2) a decline in oil production, and (3) rising production costs and unfavourable weather conditions due to climate change (Ogg, 2010). Productivity declines in the agricultural sector are also considered one of the factors contributing to the rise in prices (Headey and Fan, 2008).
10
Figure 1: Trends in world food and fuel prices4 (commodity price indices, 2000=100) 400 350 300 250 200 150 100 50 0
All food
Crude petroleum
Source: UNCTADSTAT (2013) These high prices have caused havoc in net food and oil importing countries such as Zimbabwe. Because of the decade long economic recession, many people have been made particularly vulnerable to such international shocks. Domestic price increases induced by world price shocks are likely to drive more people into poverty since most people spend a large portion of their income on basic food items. The future outlook is that world market prices are likely to remain significantly higher than 2004 levels and there are calls for policy responses to manage such high prices which may have a negative impact on economic recovery prospects of Zimbabwe. 2.2 Impacts of higher commodity prices A number of researchers have studied the impact of higher international prices of commodities on economies of different countries. One would expect that since most developing countries like Zimbabwe are agricultural production focused, increases in prices of these commodities in international markets would benefit the country and also rural farmers. Agriculture in Zimbabwe is the main economy activity and will continue to be so in the foreseeable future. Agriculture contributed only around 16 percent of GDP in 2011. However, the most recently available data 4
Equally weighted average price per barrel of UK Brent (light), Dubai (medium), Texas (heavy).
11
for 2005 indicated that the sector provided employment for almost 65 percent of the population at a time when agriculture was still contributing less than 20 percent to GDP (World Bank, 2012), and about 60 percent of all raw materials for the industry. If a country is a net exporter of these commodities the country can reap the benefits of high prices, but despite being an agricultural based economy it turns out that, like many developing countries, Zimbabwe is a net importer of food. The likely impact of price increases on vulnerable developing countries is not yet clear, but in the short run these countries are likely to lose out. The IMF (2008) examines the balance of payments and fiscal balance effects of higher food and fuel prices on low-income African countries and also explores possible policy responses to protect such economies. Using a descriptive approach where they characterised countries according to the extent of the shock, policy responses and the success of such policy adjustment, the IMF study found that the impact of higher prices on the balance of payments is large on average but the incidence is countryspecific, depending on initial conditions and trade patterns. Their results indicate that Zimbabwe was one of the countries hardest hit by the price increases. The Ministry of Finance (2011), documents the impact of international commodity prices on the Zimbabwean economy. They show that there are some positive benefits to be obtained from higher prices of tobacco, cotton and other mineral commodities, which has seen the agricultural and mining sectors growing faster than other sectors in recent years. However, higher prices of food and fuel have resulted in unsustainable trade and current account deficits (Ministry of Finance, 2011). The Ministry of Finance also documents some of the policy responses to cope with such shocks. The policies recommended include; (1) value addition - since the prices of valued added products are assumed to be more stable, (2) product and market diversification to avoid reliance on a few commodity exports and markets, (3) building reserves and macroeconomic stability. However, the problem with this descriptive analysis is that there is no quantitative examination of the impact of price shocks on the economy in the presence of such policies. There is need for a quantitative analysis which assesses alternative policy responses and presents clear policy recommendations.
12
Diao et al. (2002) conducted a quantitative analysis of the impact of declines in world prices of tobacco on the Zimbabwean economy using a computable general equilibrium model. They found that declines in prices of tobacco will have a negative effect on the economy through depreciation of the exchange rate, decline in tobacco exports and also increase in the consumer price index. Other studies elsewhere in the developing world have shown that higher world prices of commodities have a negative impact on economic performance. Ivanic and Martin (2008), using cross-country data from several low income countries, showed that high food prices had a negative effect on developing countries. Arndt et al (2008) analyse the impact of higher food and fuel prices on the Mozambican economy using a computable general equilibrium model, finding that the impact of fuel price shocks dominates from both the macroeconomic and poverty perspective. This finding suggests that fuel price changes are important and policies should be adopted to deal with such shocks. They consider possible trade policies, subsidies, and improved agricultural technology policy responses to help insulate the country from international price shocks. Conclusions from their study highlight the importance of the agricultural production response in general and export response in particular. This emphasizes the importance of considering policy options that improve productivity and the competitiveness of the economy. Fofana et al. (2008) examine the impact of policy responses on the South African economy to a US$10 exogenous increase in oil prices. Using a computable general equilibrium model linked to a micro-simulation household model they find that GDP would decline by 2%, while the budget deficit and unemployment increases. They also find that poverty increases, but the effect differs across different households. The poorest are severely affected and rural households who depend on income transfers are less affected. Their study documents the impact of various policy responses to oil price shocks on the South African economy and different household groupings in the country, noting there are differential impacts across different households. The implication of these findings is that for other countries in Africa, policy responses to prices shocks might have a different impact on different types of households. Thus it is important for Zimbabwe to try to assess the differential impacts of policy responses to shocks on households. The above studies provide useful insights on the impact of higher commodity prices on Zimbabwe and other developing countries. However, studies in Zimbabwe have concentrated on 13
the macroeconomic impacts and have not analysed alternative policy responses to such price shocks. Also, most of the studies have been descriptive rather than quantitative analysis of impacts and possible policy responses. Given the persistence of food and fuel price shocks there is need to come up with clear policies to protect the economy and people of Zimbabwe. Therefore the current study simulates domestic policy response packages to higher food and fuel prices, including assessing distributional impacts of such policies on different households.
3. Empirical framework 3.1 GTAP Model and projections to 2015 To capture the effects of price shocks and potential policy changes on the economy and households, it is necessary to use an economy-wide framework which takes into account complex interactions between factor incomes and prices in determining outcomes at the household level. Increases in the price of food and fuel will also change the country’s terms of trade and this will affect the whole economy and fuel, in particular, will tend to increase production costs throughout the economy. Since food and fuel price changes will have complex effects on economic performance, we adopt a general equilibrium approach to undertake this analysis. We use the Global Trade Analysis Project (GTAP) model, a multi-region, multi-sector computable general equilibrium model (Hertel, 1997), along with MyGTAP to facilitate modelling of multiple household types (Walmsely and Minor, 2012). This model is used with the GTAP version 8.1 data base, which has a base year of 2007 for 134 countries or regions and 57 sectors (Narayanan et al. 2012). We aggregate the database into 18 sectors and 13 regions, representing regions and sectors of particular importance to the Zimbabwean economy and poor households (see Appendix Tables A1 and A2 for details of the database aggregation we use). Use of this global general equilibrium model enables examination of the general equilibrium and open economy impacts of higher food and fuel prices on the Zimbabwean economy. Our analysis will trace the impacts on output of different sectors of the economy, prices of commodities, terms of trade, real GDP and implication for factor returns.
14
Our analysis is forward looking, thus we first project the world economy to 2015, following a similar approach to that employed in Anderson and Strutt (2012) and other studies. Over the period from our baseline of 2007 to 2015, we assume that national real GDP, population, unskilled and skilled labor, capital, agricultural land, and extractable mineral resources (oil, gas, coal and other minerals) grow at exogenously set rates, using assumptions drawing on the work of Anderson and Strutt (2014). We pay particular attention to ensure that the pattern of trade and production appropriately reflects the Zimbabwean economy.5 From this projected 2015 database, world price increase scenarios are modelled, then combined with a range of policy scenarios to evaluate impacts for the overall economy as well as particular household-types. Trade liberalization is a potential policy response to international price volatility that, while likely to lead to overall benefits to the economy, may impact household types in different ways and we explore these impacts. Reducing a range of barriers to regional trade of basic staples is likely to be of particular importance within Africa (World Bank 2012a). Policy measures to improve trade facilitation as well as agricultural productivity in Zimbabwe will also be explored. 3.2 Splitting Zimbabwe households using MyGTAP Since this study aims to evaluate potential policy responses to higher world prices of food and fuel, including assessing the distributional impacts of such polices, we supplement the GTAP database with national household survey data for Zimbabwe to split households.6 This facilitates a richer and more comprehensive analysis of increased commodity prices on different households within the economy, providing a platform to evaluate various policy options that may be used to cushion the overall economy and particular household types from global market shocks. We split households and factors using the 2001 household income and consumption survey data from Zimstat (Central Statistics Office, 2005). For consumption splits we use information on 5
Including adjusting the key export sector of minerals and metals where exports in the 2007 database are about 54% of total Zimbabwe exports. This is in marked contrast to the average level of about 30% over the 8 years from 2002, which seems a more credible share of Zimbabwe exports for 2015. 6 Initially using a historical social accounting matrix combined with available published data. However, if the 2009 household survey data become available for Zimbabwe, we will update to incorporate this.
15
average annual household consumption by sector and commodity groups, with consumption shares calculated from this information. We map these as closely as possible to the GTAP sectors we model, however, it should be noted that commodity groupings provided by the survey do not exactly match those in the GTAP aggregations.7 We also use data from the 1991 Zimbabwe Social Accounting Matrix (SAM) for splitting factors. The 1991 SAM has 27 sectors, 9 factors (4 labor categories, 3 capital and 2 land) and 5 household groupings. In terms of the factors, the 4 labour categories in the SAM are: 1) large scale unskilled workers, 2) unskilled formal labour, 3) unskilled informal labour and smallholder, and 4) skilled labour. Capital is divided into: 1) capital large scale, 2) capital smallholder, and 3) other capital. In the current study, given consumption data limitations, we are only able to split households into two categories: rural and urban. In terms of factors of production, we split labor into 4 categories of unskilled rural, unskilled urban, skilled rural and skilled urban. We split capital into two categories of agricultural capital which comprises capital large scale and smallholder, and other capital. Land and natural resources are not split in the current study. The split data is used in conjunction with a recently developed extension tool for the GTAP model, which facilitates the incorporation of multiple household types for a particular country (Walmsely and Minor, 2012). Under this approach, we replace the standard GTAP regional household for Zimbabwe with multiple private households and a separate government.8 This contrasts with the approach, for example, of Ahmed et al. (2011), which considers the impact of climate volatility on poverty in Tanzania following earlier work by Hertel et al. (2004) to estimate changes in income and consumption of households in the neighborhood of the poverty line. Data from Mabugu and Chitiga (2008) are also used to define factor ownership shares of the two households, with these factor ownership shares useful for determining disposable incomes. 3.3 Closure We adjusted the standard GTAP closure to better reflect some key structural features of the Zimbabwean economy. Developing regions, including Sub-Saharan Africa (SSA), tend to be 7
With a particular limitation being that food is aggregated into one sector in the report, while our GTAP aggregation, there are various categories of food including wheat, grains and livestock products. 8
Private household expenditure can be modeled using either a CDE or a Linear Expenditure System (LES) specification. In the current study we use a CDE specification for private household expenditure in Zimbabwe, due to solving difficulties encountered when applying large commodity price shocks with an LES system. However, we note this choice does not appear to substantially alter the types of results we report in this paper.
16
characterized by unskilled labour unemployment. Therefore we relax the standard assumption of full employment, modifying the model closure for Zimbabwe and other SSA countries to allow unemployment of unskilled labour.9 For Zimbabwe we also fix the government budget deficit relative to government income to help ensure that Zimbabwe maintains a similar government budget balance. We also fix the trade balance relative to income for Zimbabwe by allowing investment to adjust. The country is running a negative trade balance in the initial database and this closure ensures that the country will not be able to finance the increased costs of imports by larger trade deficits.10
4. Scenarios considered In this section, we discuss the experiments conducted and the results from the simulations. We begin by characterizing the two price and five policy shocks before presenting and discussing the results from these simulations. Results are discussed in terms of overall impacts on the economy and the differential impacts on different household types. Analysing results according to the type of households has important implications for policies aimed at improving inclusive growth. 4.1 Commodity price shocks The shocks are conducted in such a way that we simulate what would happen in 2015 if commodity prices were to increase in magnitudes similar to 2007-2008 world price increase. Various studies have documented the magnitude of price changes during the 2007-2008 period, with many studies reporting a world price increase of more than 70 percent (Arndt et al., 2008; World Bank, 2008; Headey and Fan, 2008; Ivanic and Martin,2008). However, there is high degree of uncertainty on where prices will be in the next ten years. We adopted lower magnitudes of price changes, as shown in Table 1, since most of those reported in the literature are in nominal terms but real prices may also remain high over the next decade. According to OECD-FAO (2011) projections, there are several factors that will put pressure on prices of commodities. Projections of input costs suggest that they are likely to increase, because energy 9
We endogenize the supply of unskilled labour and exogenize the real wage rate of unskilled labour in SSA and Zimbabwe. 10 It also restricts Zimbabwe from achieving windfall gains in international competitiveness when productivity is reduced in other regions to achieve the world commodity price increases we model.
17
and feed related costs have been on the increase. Also productivity growth is slowing in comparison to the previous decade. The slower growth in productivity, coupled with increased demand in food, will put an upward pressure on prices. We consider two commodity price increase scenarios: 1) agriculture and food price shocks, and 2) a shock to petroleum products to proxy a fuel price increase. Table 1 shows the magnitude of the shocks to be implemented for various commodities. We model these price increases as exogenous changes in world prices, resulting from global productivity reductions in these sectors.11
Table 1: International Price Shocks Commodity
World price increases (%)
Rice 70 Wheat 70 Other Cereal Grains 60 Sugar 40 Veg & fruit, oilseeds, plant fibre 25 Other crops 25 Dairy prods and raw milk 40 Meats and other livestock 25 Processed Food 40 Petroleum and coal products 70 Source: Authors’ assumptions, as explained in the text. 4.2 Policy responses To analyse the impact of policy responses on the economy and households, we combine the price shocks described above with a range of policy scenarios. For policy scenarios we simulate the removal of all import tariffs on agricultural products in Zimbabwe from all regions and also a movement towards improved market access by lowering trade transaction costs. To analyse improved market access through reductions in transaction costs we lower the effective price associated with delivery of products from different regions in Sub-Saharan Africa, since greater 11
Appropriate closure rules are implemented in order for us to shock world prices. Since prices are endogenous in the GTAP model, we swap the appropriate world prices with world sectoral productivity to exogenize the world price of the relevant tradable commodities in Zimbabwe.
18
economic integration implies prices of commodities between countries will converge. Reducing transaction costs has been found to be important in facilitating participation in markets, hence encouraging agroprocessing and value addition (Diao et al., 2008). We consider four policy scenarios: two of which combine the world food price shock with policy responses and the other two combines the world fuel price shock with a potential policy response:
The first policy scenario models the removal of all tariffs on agricultural and food products in Zimbabwe, combined with the world food price shocks. We assume a full removal of import duties on all agricultural food products coming into Zimbabwe. While this may currently be viewed as unrealistically ambitious, we explore it in an effort to better understand the potential for farm trade reform to cushion the Zimbabwe economy from the food price shocks.
The second policy scenario considers the impact of a reduction in trade transaction costs within the Sub-Saharan Africa region, combined with a world food price shock. To model the effects of an improvement in trade facilitation measures, we implement an approach introduced in Hertel et al. (2001) which allows for a region-specific shift in the Armington import demand function, effectively lowering the foreign market price. This approach was used by Stone et al. (2012) to assess the impact of improved regional trade facilitation among Greater Mekong Sub-region countries, which we follow with a more conservative assumption that improved trade facilitation leads to an effective intraregional import price reduction of 5%.
The third policy scenario explores a trade liberalization response to the world price increase for petroleum products. In particular, we consider a 50 percent reduction in import duties applied on these products by Zimbabwe.
The final policy scenario also considers the impact of reduced trade transaction costs within the SSA region, combined with world price increase of petroleum products.
19
5. Empirical results and discussion 5.1 Overall impacts and assessment Since Zimbabwe has a trade deficit for some food commodities and also for petroleum products (Figure 2), higher world prices may be expected to harm the terms of trade, with implications for balance of payments and the rest of the economy. Results of the price and policy experiments are shown in Tables 2-8. The impacts of price shocks on macroeconomic variables are shown in Table 2. The increases in the world price of food commodities and fuel that we model result in the increase in the costs of imported food and fuel in the country. Increases in price of food only will lead to a real GDP decline of 2.12 % in our results. This is largely driven by a large decline in investment in Zimbabwe. An increase in food prices will worsen the balance of payment deficit in the country since the country is a net food importer. With a fixed trade balance, a deficit in the balance of payments implies that investment is falling in the country. Table 2 also shows that much of the decline in real GDP comes from the increase in the price of cereal crops, which are important food crops for the country. Since Zimbabwe is a low income country and the majority of the population spent a large fraction of their income on food, one would expect a food price increase to have significant impact on incomes and consequently GDP. The increase in world fuel prices had a much larger impact on real GDP than food price increases. In the fuel scenario real GDP declines by 5.27 % and this is largely driven by a decline in private consumption expenditure.
20
Figure 2: Trade balance by commodity in the initial database (million US dollars)
500
0
-500
-1,000
-1,500
Source: Authors’ 2015 projections based on GTAP Version 8.1 database
21
Table 2: Impact of world price increase on the Zimbabwean Economy (percentage changes) Increase in world prices GDP Terms of Trade Total Food Price Effect -2.2 4.1 Effect of different commodity price shocks Other cereals -1.4 -3.4 Rice -0.1 -0.3 Wheat -0.4 0.0 Sugar 0.3 1.3 Veg & fruit _ oilseeds 0.1 1.3 Other crops 0.2 5.2 Dairy -0.1 0.2 Other livestock 0.1 0.4 Processed food -0.8 -0.6 Fuel Prices -5.3 -5.8
Source: Authors’ model results The food price shock improves Zimbabwe’s terms of trade by 4.1 %, whilst a fuel shock results in a 5.8% decline in terms of trade. An increase in world food prices pushes up the aggregate price received of goods exported from Zimbabwe by 9.7 %, while the aggregate price paid for tradables imported by Zimbabwe increases by 5.4 %. On the other hand the increase in world fuel prices increases the price received for exports from Zimbabwe by 3.7% but the price of imports increases by more than 10 %, leading to the significant terms of trade decline in this scenario. Table 3 shows the effect of commodity price changes on trade in Zimbabwe. The first column shows the overall change in imports and exports as a result of increases in food prices, whereas the second column shows the effect due to fuel price increases. Increases in the world price of food will result in huge increases in imports of commodities such as dairy, other livestock products, beverages and tobacco, rice and other cereal grains. On the other hand there will be a decline in imports of heavy manufactures and minerals and metals. In terms of exports, Zimbabwe will experience significant export growth in sectors such as wheat, agroprocessing (processed food), and rice. Other sectors that experience export growth are other cereals and sugar.
22
Results for fuel price increase indicate that the country will reduce imports of almost all commodities with the exception of wheat, extraction industries, and heavy manufacturing. Exports of almost all sectors will slightly grow with the exception of sectors such as vegetable & fruits, oilseeds, other crops and services.
Table 3: Impact on trade: change in the value of commodity trade (US$ million)
Rice Wheat Other Cereal Grains Sugar Veg & Fruits, Oilseeds Othercrops Forestry & Fish Dairy Other Livestock Oil Other Extraction Beverages & Tobacco Processed Food Light Manufacturing Petroleum & Coal Products Minerals and Metals Heavy Manufacturing Services
Food Price shock Imports Exports 15.2 0.0 27.5 0.8 201.2 0.9 0.1 69.7 22.7 42.6 19.3 87.6 0.7 -1.3 8.8 3.0 19.1 -9.4 0.0 0.0 -16.7 -14.8 13.7 -37.2 67.2 113.1 -24.8 -143.4 9.8 -2.7 -125.5 -162.4 -544.9 -43.9 213.4 -32.1
Fuel Price shock Imports Exports -1.2 0.0 0.3 0.0 -16.1 0.1 0.0 16.2 -2.5 -2.0 -2.3 -8.3 -0.1 1.1 -0.8 1.9 -1.5 14.3 0.0 0.1 6.7 26.7 -1.2 17.5 -13.7 12.7 -6.5 2.4 175.3 65.4 -2.0 5.1 31.8 6.4 -54.0 -23.2
Source: Authors’ model results Higher food and fuel prices will have an effect on the pricing structure of different commodities and also on resource allocation, which in turn will have an effect on the output of different sectors of the Zimbabwean economy. The differential impacts on real sectoral production depend in part on whether the commodities are substitutes or complements with the sector experiencing a shock. If goods are substitutes and compete for resources, then an increase in the price of the other good will tend to shift resources away from the other commodity towards the commodity experiencing a price increases. Impacts on real output also depend on whether the product experiencing a shock is an important input in the production of commodities for that sector. If the sector uses more of the commodity experiencing a price increase, we would expect a decline 23
in output of that sector since increases in prices will also increase production costs and hence reduce production. In addition, the demand structure also contributes to the distributional structure of price shocks among sectors of the economy.
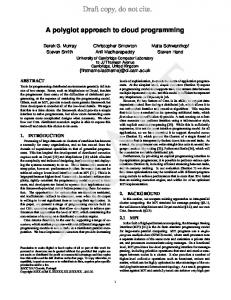
Figure 3: Effect on real sectoral output (% change) 200
300 Value change
100
150
50
75
0
0
%
225
-50
-75
-100
-150
-150
-225
-200
-300
-250
-375
US$ million
Proportional change 150
Source: Authors’ model results Figure 3 shows the results of the impact of price increases on real sectoral output in Zimbabwe. An increase in the world price of food leads to large increases in output of sectors such as wheat (145%), dairy (93%), processed food (85 %), livestock (60%), and other cereals (58%). These percentage increases translate into particularly high dollar values for the relatively large sectors such as dairy, other livestock, as also indicated in Figure 3. An increase in the price of food and agricultural products generally results in an increase of domestic sales and much of it is coming from the increased demand by firms in Zimbabwe for intermediate domestic inputs as output expands. Increases in world food prices induce a supply response in these sectors. There is a consequent general equilibrium effect of resources being drawn into the food sectors simulated to experience particularly significant relative price, leading to sectors such as other crops being projected to experience a slight decline since the relative price increase for this sector is 24
relatively small. The increase in the price of food and agricultural products is likely to lead to a more significant decline in output of manufacturing and service sectors, particularly heavy manufacturing and services, which is due primarily due to a decline in domestic sales emanating from a decline in intermediate demand by firms for inputs. For sectors such as minerals & metals, beverages & tobacco, and other crops, the decline in output is mainly attributed to reduced exports sales from Zimbabwe. While the increase in the price of fuel products is likely to lead to an expansion of the sector experiencing the price increases, it will increase operational costs and hence result in a decline in output on other sectors, particularly those which use fuel intensively. Results show a reduction in output in almost all sectors except rice, sugar, extraction, and beverages & tobacco. Dairy sector will experience a large decline in output as a result of a decline in domestic sales emanating from drop in demand. With these changes in output of different sectors, prices of factors of production also change in the economy. Table 4 below shows the effect of world commodity price shocks on returns to factors of production, relative to the price index for private consumption expenditure, in Zimbabwe. An increase in the price of food and agricultural products will, not surprisingly, significantly increase returns to land in the whole economy. The stock of agricultural land is assumed fixed in our simulation, therefore as output expands in the sectors that use land intensively, this raises the price of land. Results also indicated that increases in the world price of the other crops sector has a particularly large impact on the return to land, relative to other food commodity price shocks. The other crops sector is a large agricultural sector that uses more than 50 percent of the value added by agricultural land in Zimbabwe in our base dataset; therefore expansion of this sector has a particularly strong impact on the price of land. Other factors which gain are skilled rural labour and agricultural capital. Increases in output of agricultural and food sectors increase the demand for these inputs, thereby increasing returns to these factors. The contraction in output in manufacturing and service sectors leads to a fall in demand for skilled urban workers, and also non agricultural capital. This causes real returns for skilled urban to fall by 12% and non-agricultural capital to decline by 9%.
25
On the other hand, an increase in the price of fuel will lead to a decline in returns to all factors of production except natural resources. A fuel price increase has induced cost increases that result in reduction in output of most sectors of the economy and this in turn will lead to a decline in demand for these factors, thus pushing factor prices down.
Table 4: Impact of price shocks on real factor prices in Zimbabwe Food shock 219 -37 35 -12 -9 138
Land Natural Resources Skilled rural Skilled urban Other Capital Agricultural Capital Source: Authors’ model results
Fuel shock -28 3 -3.3 -13 -12 -13
5.2 Impact of potential policy responses In an attempt to evaluate policy options which might be used to cushion the Zimbabwean economy from higher prices, we consider scenarios combining the world commodity price shocks with various policy interventions, as described above. The results of these scenarios are reported in Tables 5-7. Table 5 reports results of the impact of various policy options on macroeconomic variables. In the face of food and agricultural price increases, our results suggest that full liberalization of agricultural trade is not sufficient to offset the dampening impact of the world food price on real GDP for Zimbabwe. However, it should be noted that in the presence of this policy the decline in GDP (-1.1%) is significantly lower than that experienced if no trade liberalisation policy is implemented (-2.1%), representing about a percentage point less decline of real GDP. The increases in terms of trade decline by about 0.9 percentage points as a result of the policy. There is a significant growth in the country’s real GDP if trade transaction costs in SSA are reduced. This suggests the importance of reducing trade transactions costs as an insulating policy
26
against high international food prices. There is also a significant increase in terms of trade. That is, the reduction of transaction costs will result in a 5.5 % improvement in the terms of trade. Partial removal of duties on fuel will dampen, but not completely offset, the decline in real GDP due to a fuel product price shock, suggesting that a removal of duty on fuel will help to partially cushion the overall economy from this external price shock. However, it should be noted that the policy appears to worsen the decline in terms of trade slightly. On the other hand, reduction of transactions costs in the presence of high international fuel prices appears to lead to significant growth in real GDP, as indicated in the final row of Table 5. Table 5: Impact of policy responses on macroeconomic variables GDP Food Price + Agric trade liberalisation in Zimbabwe Food Price + Reduction of trade transaction costs in SSA Fuel Shock + Partial removal of duties on fuel in Zimbabwe Fuel Shock + Reduction of trade transaction costs in SSA Source: Authors’ model results
-1.1 2.9 -4.3 0.6
Terms of Trade 3.2 5.5 -6.1 -4.5
The impact of policy responses on sectoral output is shown in Table 6. Results show that different policy interventions in Zimbabwe will have differential impacts on sectoral output. Some sectors will be favored by a particular policy while others suffer. For example agricultural trade liberalisation in the presence of world price increases still results in decreases in output in sectors such as services, other crops, heavy manufacturing, mineral & metals, beverages and tobacco, and extraction. Reduction in trade transaction costs in Sub-Saharan Africa (SSA) in the presence of higher world food prices particularly increases sectoral output of other livestock, dairy, minerals and metals, forestry & fish, sugar, other cereals, processed food, and light manufacturing. The increases in output are higher than if world food prices increase without reducing trade transaction costs. Column three of Table 6 shows the effect of partial reduction in tariffs on fuel products in the presence of high international fuel prices. Only sectors such as wheat and extraction benefit from the policy, with the majority of sectors seeming to suffer. For example, sectoral output of rice
27
now declines as a result of the policy. Reducing transactions costs tends to increase output or reduce negative impacts of the fuel shock for most sectors.
Table 6: Impact of policy responses on real sectoral output (percentage changes) Food Price + Food Price + Fuel Shock Fuel shock + Agric trade Reduction of + Partial Reduction of liberalisation in trade removal of transaction Zim transaction duties on costs in SSA costs in SSA fuel in Zim
Rice Wheat Other Cereal Grains Sugar Veg & Fruit, Oilseeds Other crops Forestry & Fishery Dairy Other Livestock Oil Other Extraction Beverages & Tobacco Processed Food Light Manufacturing Petroleum & Coal Minerals & Metals Heavy Manufacturing Services Source: Authors’ model results
14.3 134.3 59.1 42.0 3.5 -5.0 12.3 87.2 59.1 -1.8 -5.3 -12.7 70.6 11.1 4.1 -12.1 -40.1 -7.4
-41.3 125.4 70.0 16.9 -2.8 -17.8 26.6 159.8 105.4 -4.1 -5.6 -8.4 107.4 18.2 7.5 11.5 -49.7 -5.8
28
-2.0 1.2 -6.0 6.3 -4.5 -4.7 -5.1 -10.2 -2.1 8.7 1.2 2.3 -1.1 -6.7 71.3 -0.8 -1.6 -5.8
-5.9 -0.6 -2.9 10.3 -3.1 -7.3 -1.2 -0.9 6.8 8.4 1.2 1.7 2.0 -3.3 78.9 5.1 -8.1 -4.2
Table 7: Impact of policy responses on real factor prices in Zimbabwe Food Price + Food Price Fuel Shock Fuel Shock + Agric trade + Reduction + Partial Reduction of liberalisation of trade removal of trade in Zim transaction duties on transaction costs in SSA fuel in Zim costs Land Natural Resources Skilled rural Skilled urban Other Capital Agricultural Capital Source: Authors’ model results
212.8 -33.5 39.4 -10.2 -7.7 142.9
247.0 -31.6 52.6 -8.9 -5.2 194.6
-20.9 4.6 0.0 -11.0 -10.1 -8.0
-16.2 7.3 5.8 -7.0 -6.0 0.0
Table 7 shows the impact of policy responses on factor prices. These results can be compared with results on impacts of world price increases on factor prices in Zimbabwe (Table 4). In the presence of a food price hike, the return to land increases more significantly when trade transaction costs are reduced. The change in wages paid to skilled rural workers is increased by 18 percentage points in this scenario. Also there is an improvement in wages paid to skilled urban and returns to other capital, since the decline is now low. Returns to agricultural capital also increase significantly by 57 percentage points. Agricultural trade liberalisation in the presence of food price increase will tend to result in lower improvements in returns to factors of production. Overall, reduction of import duties on fuel leads to a lower decline in real returns to factors such as land, skilled urban, other capital, and agricultural capital, in comparison to a situation where there is no removal of duties. Real wages of skilled rural workers will increase. Reduction of trade transaction costs will increase real returns to all factors of production, relative to the scenarios where only fuel price shocks are implemented. Of importance for policy are the changes in the distribution of income among different households. This will depend on how much of the factors are owned by the households and on changes in factor prices, which are in turn affected by changes in the production structure, along with factor intensities and mobility in different sectors. Since returns to land improve in the whole economy as a result of world food price increases we expect incomes of rural households to increase since they own most of the land. Real wages paid to skilled rural and returns to 29
agricultural capital also increase, hence we expect households who own such factors to experience an increase in income. Table 8 indicates that a food price hike could more than double the income of rural households, whereas income of urban households declines slightly. A fuel shock decreases income of both rural households and urban households, although rural households are the hardest hit in this case. Total private consumption for rural households increases, whilst for urban households consumption decreases as a result of increases in world food and agricultural prices. In the case of fuel price increases both urban and rural experience a decline in consumption. In terms of policy responses, agricultural trade liberalisation in Zimbabwe in the presence of food price will increase income of rural households at a lower rate, while urban households’ income will increase by 0.18 %. Reducing trade transaction costs in SSA will increase the income of both rural and urban households by a higher magnitude. Partial removal of duties on fuel will tend to reduce income of all households by a lower magnitude, suggesting the importance of such a policy in partially cushioning households. The last column of table 8 confirms the importance of reducing trade transactions in SSA as a mechanism to cushion households from price shocks. In this scenario there is a significant improvement in incomes of all households and this in turn will lead to growth in consumption expenditure. The price of commodities purchased by different households will impact the capacity of households to effectively participate in markets. Results indicate that higher world food prices tend to increase consumer prices for rural households by a higher magnitude than is the case for urban households. In the case of a fuel price shock, urban households face higher price increases than rural households.
30
Table 8: Impacts on household income (percentage changes) Price Shocks Food Price Fuel Effect Price Effect
Change in household income Change in total private consumption expenditure
Rural Households Urban Households Rural Households
Urban Households Rural Households Change in consumer Urban price index Households Source: Authors’ model results
Food Price + Agric trade Liberalisation in Zim
Policy Responses Food Price + Fuel Shock + Fuel Shock + Reduction of Partial Reduction of trade removal of trade transaction transaction duties on fuel costs costs in SSA in Zim
171.6
-14.0
165.9
245.5
-7.5
38.3
-0.5
-9.8
0.2
24.3
-7.8
20.6
311.4
-19.9
322.8
461.2
-11.0
9.3
-1.1
-9.9
-0.4
6.9
-7.9
-0.6
15.1
3.9
12.6
17.2
3.6
5.2
11.3
6.1
9.6
13.5
5.2
7.3
31
5.4 Sensitivity analysis and some qualifications In this section we consider the sensitivity of some key results to changes in the macroeconomic closure assumptions used above. In particular we explore how sensitive the commodity price shock results are to our assumption of unskilled labour unemployment in the SSA region. We find that increases in world prices of food and fuel of the same magnitude as considered previously appear to have smaller impact on real GDP for both the food and fuel shock. That is, the impact on real GDP result in a less severe decline than with unemployment in the model, with the decline being 0.5 percentage points lower in the case of food shock and 4.4 percent worse in the case of fuel price shocks . The smaller decline in real GDP is due to all workers remaining fully employed, despite the contraction of the Zimbabwe economy. In the case of the fuel price shock, the impact on unskilled employment was even more severe with rural unemployment increasing and urban unemployment increasing by a large percentage. Therefore when we move to a closure of no unemployment, the impact on real GDP (and sectoral output) is much less severe. While this study aims to improve understanding of the potential impact of world commodity price rises on Zimbabwe, along with possible policy responses, results must of course be considered with caution. While we hope useful insights have been generated, there are always limitations to this type of large-scale modelling effort. For example, modifying our assumption on rural unemployment in Zimbabwe and other SSA countries has the potential to significantly impacts results, as shown in the sensitivity analysis. Thus future research should consider the issue of appropriate macroeconomic closures when modelling economies such as Zimbabwe, particularly ensuring appropriate unemployment assumptions, including under alternative policy responses. We also note that we model world price increases via global sectoral productivity reductions in countries other than Zimbabwe. However, other mechanisms could also cause the price increases and these could be usefully explored in future work. Finally, while we have used a well-respected international database and augmented it with household data, we acknowledge the relatively weak quality of the underlying Zimbabwe datasets that are available, and therefore appropriate caution interpreting results is needed.
32
6. Concluding remarks Higher world food and fuel prices are a potential threat to the economic recovery process in Zimbabwe and are likely to push people into poverty, particularly since most households have been made more vulnerable to shocks by a decade-long recession. This study examined the impacts of higher international food and fuel prices on the Zimbabwean economy, including impacts on different households and potential impacts of various policy responses to the shocks. Our results suggest that in the case of food price hikes, real GDP declines but terms of trade improve, whereas in the case of a fuel shock GDP declines even more significantly and terms of trade deteriorate. A food price shock causes an increase in the value of food imports and a decline in non food imports, though food processing, wheat and rice experience significant growth in export values. The fuel price increase causes factor prices to fall and a real depreciation in Zimbabwe, which results in slight growth in exports of almost all sectors, however, overall GDP declines significantly. Our results indicate that many sectors experience an increase in output as a result of an international food price shock, whereas with the international fuel products price shock, more than half of the sectors experience a decline in output. Results also indicate that returns to land, skilled rural labour and agricultural capital will increase when food prices rise, whilst returns to other factors are likely to decrease. Increases in the world price of fuel decreases returns to all factors, with the exception of natural resources. Therefore, our results indicate that a food price increase will increase incomes of rural households and decrease incomes of urban households. In the case of fuel price increase both rural and urban households experience a decline in income. This suggests that there are winners and losers in these scenarios, raising the issue of possible need for compensatory mechanisms to be put in place, particularly given the economic vulnerability of many people in Zimbabwe at present. Policy mechanisms need to be put in place that strikes a careful balance between the interests of different players. We considered a range of alternative policy scenarios, evaluating their effectiveness in cushioning various aspects of the economy from price shocks. The impacts of these policies varied across sectors and agents; however, improving trade facilitation in SSA appears potentially important for cushioning the Zimbabwean economy from external shocks, as does removal of import tariffs, though perhaps to a lesser extent. 33
References Ahmed, S.A., Diffenbaugh, N.S., Hertel, T.W., Lobell, D.B., Ramankutty, N., Rios, A.R., Rowhani, P., 2011. Climate volatility and poverty vulnerability in Tanzania, Global Environmental Change, Volume 21, Issue 1: 46-55. Anderson, K. & Strutt, A., 2014, Emerging Economies, Productivity Growth, and Trade with Resource-Rich Economies by 2030. Australian Journal of Agricultural and Resource Economics 58 (forthcoming). Anderson, K., & Strutt, A., 2012. The Changing Geography of World Trade: Projections to 2030. Journal of Asian Economics, 23, 303-323. Anderson, K., Ivanic, M and Martin, W, 2013. Food Price Spikes, Price Insulation and Poverty. Policy Research Working Paper 6535. Washington D.C.: World Bank. Arndt, C., Benfica, R., Maximiano, N., Nucifora, A., Thurlow, J., 2008. Higher Fuel and Food Prices: Impacts and responses for Mozambique. Agricultural Economics 39 supplement, 497-511. Bautista, R, M., Thomas, M, 1999. A 1991 Social Accounting Matrix for Zimbabwe, Trade and Macroeconomics Division Discussion paper, IFPRI, Washington D.C. Central Statistical Office Zimbabwe, 2005. Income , Consumption and Expenditure Survey Report 2001,Harare. Chitiga, M.,Mabugu, R, 2008. Evaluating Impact of Land Redistribution: A CGE Microsimulation Application to Zimbabwe. Journal of African Economies, Volume 17(4), 527-549. Coomer J, & T. Gstraunthaler, 2011. The Hyperinflation in Zimbabwe. Quarterly Journal of Austrian Economics 14(3): 311-346.
34
Diao, X., Fan, S., Headey, D., Johnson, M., Pratt, N, A., Yu, B., 2008. Accelarating Africa’s Food Production in Response to Rising Food Prices: Impacts and Requisite Actions. IFPRI Discussion Paper 00825. Diao, X., Robinson, S., Marcelle, T and Wobst, P, 2002. Assessing the Impacts of Declines in the World Price of Tobacco on China, Malawi, Turkey and Zimbabwe, TMD Discussion Paper, International Food Policy Research Institute. Fofana, I., Mabugu, R and Chitiga, M, 2008. Analysing the Impacts of Alternative Policy Responses to Higher Oil Prices using an Energy focused Macro-Micro Model for South Africa, Financial and Fiscal Commission. Food and Agriculture Organisation, 2010. The State of Food and Agriculture. FAO Publications Food and Agriculture Organisation, 2012. Price Volatility from a Global Perspective. Paper prepared as background to high level meeting on Food price volatility and the role of speculation,
July,
Available
at
http://www.fao.org/fileadmin/templates/est/meetings/price_volatility/Price_volatility_Tec hPaper_V3_clean.pdf. Hanke, S.H. and A.K.F. Kwok, 2009. On the Measurement of Zimbabwe’s Hyperinflation. Cato Journal 29(2): 353-364. Headey, D and Fan, S, 2008. Anatomy of crises: the causes and consequences of surging food prices. Agricultural Economics 39 supplement, 375-391. Hertel, T, W., Preckel, P, V., Reimer, J.J., 2001. Trade Policy, Staple Food Price Variability and the Vulnerability of Low-Income Households. GTAP Working Paper, West Lafayette, Indiana. Hertel, T. W., T. Walmsley, and K. Itakura. 2001. Dynamic Effects of the “New Age” Free Trade Agreement between Japan and Singapore. Journal of Economic Integration 16(4): 446–84.
35
Hertel, T.W. (ed), 1997. Global Trade Analysis: Models and Applications. Cambridge University Press. Hertel, T.W., Ivanic, M., Preckel, P.V., Cranfield, J.A.L., 2004. The earnings effects of multilateral trade liberalization: implications for poverty. World Bank Economic Review 18, 205–236. International Monetary Fund (IMF), 2010. Zimbabwe: Challenges and Policy Options After Hyper-Inflation. Africa Department. International Monetary Fund, 2008. The Balance of Payments Impact of the Food and Fuel Price Shocks on low Income African Countries: A Country-by-Country Assessment. African Department Ivanic, M., Martin, W, 2008. Implications for higher global prices for poverty in low-income countries. Agricultural Economics 39 supplement, 405-416. Jones, J.L., 2010. Freeze: Movement, narrative and the Disciplining of Price in Hyperinflationary Zimbabwe. Social Dynamics: A Journal of African Studies 36(2): 335-351. Ministry of Economic Planning and Investment Promotion, 2009. Short Term Economic Recovery Programme (STERP), Getting Zimbabwe Moving Again. Ministry of Finance, 2011.The 2012 National Budget Ministry of Finance, 2012.The 2013 National Budget Minot, N., 2012. Food Price Volatility: Has it Really Increased? IFPRI Discussion paper 01239 Mutengezanwa, M., F.N. Mauchi, K. Njanike, J. Matanga and R.N. Gopo, 2012. The Possibility of Reintroducing the Zimbabwean Dollar.
Australian Journal of Business and
Management Research 2(6):1-8. Narayanan, B., Aguiar, A., McDougall, R. (eds.) 2012. Global Trade, Assistance, and Production: The GTAP 8 Data Base, West Lafayette: Center for Global Trade Analysis, Purdue University. www.gtap.agecon.purdue.edu/databases/v8/v8_doco.asp 36
OECD-FAO, 2011. Agricultural Outlook 2011-2020, Ogg, C. W, 2010. Commodity Price Levels in Poor Countries: Recent causes and remedies, Policy Issues, P19, A publication of Agricultural and Applied Economics Association. Rosengrant, M., Zhu, T., Msangi., S and Susler, T, 2008. Global scenarios for biofuels: Impacts and Implications. Review of Agricultural Economics, 30(3), 495-505. Stone, S., Strutt, A., & Hertel, T. W., 2012. Socio-economic Impact of Regional Transport Infrastructure in the Greater Mekong Subregion. In B. N. Battacharyay & M. Kawai (Eds.), Infrastructure for Asian Connectivity (pp. 95-138). Cheltenham and Massachusetts: Edward Elgar. UNCTADSTAT,
2013.
Statistical
Database
(online).
Available
from
http://unctadstat.unctad.org/ReportFolders/reportFolders.aspx[Date accessed 26.03.2013]. Walmsely, T and Minor, P, 2012. MyGTAP Model: A Model for Employing Data from the MyGTAP Data Application: Multiple Households, Split Factors, Remittances, Foreign Aid and Transfers. World Bank, 2008. Rising food prices: Policy options and World Bank Response. Paper prepared as background to the Meetings of the Development Committee, April, Available at http://siteresources.worldbank.org/NEWS/Resources/risingfoodprices_backgroundnote_a pr08.pdf. World Bank, 2012. World Development Indicators. Washington D.C.: World Bank. Accessed from http://data.worldbank.org/country/zimbabwe, 4 November 2012. World Bank, 2012a. Africa Can Help Feed Africa: Removing Barriers to Regional Trade in Food Staples. Washington D.C.: World Bank.
37
APPENDICES Table A1: Aggregated Commodities in the GTAP Model New Sector Description Rice Rice - raw and processed Wheat Wheat Other Cereal Grains Other cereal grains Sugar Sugar - processed and raw Vegetables, fruit & Oilseeds Veg&fruit,oilseeds,plant fibre Othercrops Other crops ForFish Forest & fish Dairy Dairy prods and raw milk Other Livestock Meats and other livestock Oil Oil Other Extraction Coal, gas, other minerals BevTobacco Beverages and tobacco ProcFood Processed Food LightMnfc Light Manufacturing PetrolCoalPr MinandMet HeavyMnfc Services
Petroleum and coal products Minerals and metal products Heavy Manufacturing Services
38
Original GTAP Sectors pdr pcr wht gro sgr c_b v_f osd pfb ocr frs fsh mil rmk ctl oap wol cmt omt oil coa gas omn b_t ofd vol tex wap lea lum ppp mvh otn omf p_c nmm i_s nfm fmp ele ome ely gdt wtr cns trd otp wtp atp cmn ofi isr obs ros osg dwe
Table A2: Country Aggregation New Region Description Zimbabwe Zimbabwe SouthAfrica South Africa Malawi Malawi Zambia Zambia RestSSAfrica Rest of Sub Saharan Africa
MENA EU_27
Middle East and North Africa EU_27
US United States of America RestNAmerica Rest of North America LatinAmer Latin America China RAsiaPacific
China Rest of Asia Pacific
RestofWorld
Rest of World
Comprising Original GTAP regions zwe zaf mwi zmb cmr civ gha nga sen xwf xcf xac eth ken mdg mus moz tza uga xec bwa nam xsc bhr irn isr kwt omn qat sau tur are xws egy mar tun xnf aut bel cyp cze dnk est fra deu grc hun irl ita lva lta lux mlt nld pol prt svk svn esp swe gbr bgr rou usa can mex xna arg bol bra chl col ecu pry ury ven xsm cri gtm hnd nic pan slv xca xcb chn aus nzl xoc hkg jpn kor mng twn xea khm idn lao mys phl sgp tha vnm xse bgd ind npl pak ika xsa che nor xef alb blr hrv rus ukr xee xer kaz kgz xsu arm aze geo
39