Journal of Mountain Science Vol 4 No 1 (2007): 077~085 http://jms.imde.ac.cn DOI: 10.1007/s11629-007-0077-5
Preliminary Results on Hydrological and Hydrochemical Features of Kartamak Glacier Area in Mt. Muztag Ata ZHAO Huabiao Key Laboratory of Cryosphere and Environment, CAREERI, CAS, Lanzhou Gansu 730000, China Corresponding author, E-mail:
[email protected]
YAO Tandong, XU Baiqing Institute of Tibetan Plateau Research, CAS, Beijing 100085, China; Key Laboratory of Cryosphere and Environment, CAREERI, CAS, Lanzhou Gansu 730000, China
Abstract: The variations of the meltwater runoff draining from Kartamak Glacier in Mt. Muztag Ata in China were studied by using the measured hydrological data from 1 June to 25 August 2003. The meltwater runoff is mainly affected by ambient temperature and precipitation. Meltwater and precipitation samples were collected from 10 to 23 August 2003. Their pH, EC (electric conductivity) and the major ions (Na+, K+, Ca2+, Mg2+, Cl-, NO3-, SO42-) were determined. pH values showed a positive correlation with EC values for all samples. Meltwater samples were slightly alkaline. Sulfate and calcium were the dominant anion and cation in the measured ions, respectively. All the ion concentrations had inverse relationships with runoff or water level. In order to discuss the origins of dissolved chemical substances in the glacial meltwater, a principal component analysis was carried out. The results showed that water-rock interaction determined the ion components of the meltwater. Keywords: Muztag Ata; Kartamak Glacier; Meltwater runoff; Hydrochemical characteristics
Received: 7 August 2006 Accepted: 20 November 2006
Introduction The global warming will have pronounced effects on glacier variations and the glacier runoff from glaciated areas (YE et al. 1999, LU et al. 2005). The glacier meltwater is a very important water source, supplying and regulating stream flows in the inland arid area of China. Therefore,studies on the glacier runoff have significant values for socio-economic development in the arid areas in the future (YE et al. 1999, SHEN et al. 2001, SHI 2001). It is greatly significant to conduct the hydrochemistry investigations of glacier meltwater for not only helping us learn the changes in stream water quality against the future climate, but also providing the foundations for studying the relationship between atmospheric environment and ecological environment (LIU et al. 1999). Mt. Muztag Ata (75°04′E, 38°17′N) of 7546 m a.s.l., locating in the East Pamirs, stands on the boundary of Akto County and Taxkorgan in Xinjiang, China. The precipitation in Pamirs mainly originates from westerly current and the annual precipitation gradually decreases from west to east, because of the longer distance from the moisture
77
ZHAO Huabiao et al.
sources and the enhancing barrier function by the mountains (SHI et al. 2000). It was estimated that the precipitation at the snow line was about 450 mm ~ 600 mm per year in Mt. Muztag Ata (SU et al. 1989). The meltwater draining from these glaciers on the west of the Muztag Ata supplies the Karakol Lake, flows through the Gez River, and meets with the Tarim River (PU et al. 2003). The Kartamak Glacier, lies on the west of Muztag Ata, belongs to valley glaciers in morphol-
ogic type and flows in westward direction with its top reaching at the mountain peak. During the period from June to August 2003, a series of hydrologic and meteorological observations were done and some meltwater samples melted from the Kartamak Glacier were collected. Using the measured hydrological and hydrochemical data, this paper analyzed and discussed the hydrological and hydrochemical characteristics of the Kartamak Glacier.
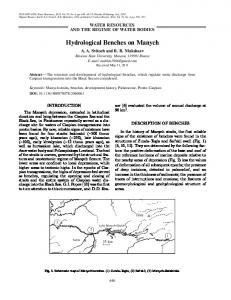
Figure 1 The sketch of the study area
1 Locations and Methods Figure 1 shows the hydrological observation sites. The mainstream extends from the Kartamak Glacier terminus, and a branch outflows from the junction between the right lateral moraine ridge and the mountain. Hydrological site I was about 1 km far from the end of the glacier tongue in the main watercourse, where we mounted a monthly water-level gauge (Recording the water level continuously in one-month period). SiteⅡ was about 80 m away from the lateral moraine, where we set up a daily water-level gauge (Recording the water level continuously for a day). The sampling sites were chosen due to the regular hydrological cross sections and to avoid sampling before different water masses were thoroughly mixed. Despite different flow path, the turbidities of meltwater in the two streams are almost the same. Some meteorological observations were still carried out, such as for precipitation and air temperature.
78
Before the collection of the meltwater samples, the polyethylene bottles were filled with meltwater, agitated and then decanted. This procedure was repeated for three times. The samples were collected at 17:00 on each day at siteⅠ (All the time in this paper is Beijing Time), and at 8:00, 14:00 and 20:00 at site Ⅱ. The water samples were also collected hourly during 12 ~ 16 August at site Ⅱ. The total numbers of meltwater samples were 13 and 116 for site I and site Ⅱ, respectively, and another 8 precipitation samples (only be used to determine pH and EC values) were collected during the same sampling period. All samples were immediately stored in refrigerators in the field and kept in a cold room at -20℃ after taken back and all the experiments were completed in the Key Laboratory of Cryosphere and Environment, CAREERI, Chinese Academy of Sciences. Melted at a room temperature, the samples were centrifuged but not filtered before analysis just for avoiding more contamination. pH and EC values were measured by acidom-
Journal of Mountain Science Vol 4 No 1 (2007)
eter (pHSJ-4A) and conductivity meter (DDSJ-308A), respectively, which were made by Shanghai REX Instrument Factory, China. All the pH and EC readings were normalized at 25℃. K+, Na+, Ca2+, Mg2+, Cl-, NO3- and SO42- were determined by Dionex-300 ion chromatograph. The chromatography conditions were as follows: for cations, CS12A analytical column, CG12A guard column, 25mM MSA eluent, CSRA-ULTRA 4-mm suppressor and 25µL sample loop; for anions, AS11 analytical column, AG11 guard column, 7.5mM NaOH eluent, ASRS-ULTRA Ⅱ 4-mm suppressor and 25µL sample loop. The accuracy was about 1 μg·L-1.
2 Results and Analyses 2.1 Runoff We couldn’t get the flow-velocity data using the available current meter because of the lower water level in siteⅡ. But we all know that water level is the most direct parameter of the runoff characteristics; so we can use water level instead to discuss the characteristics of hydrological variations for siteⅡ. Air temperature and radiation balance had clear diurnal variations in Mt. Muztag Ata, and accordingly, the meltwater runoff also had a periodic diurnal variation (HE et al. 2005). The meltwater runoff of the Kartamak Glacier occurred mostly between June and August. The runoff increased gradually in early June, and reached the peak in middle and late July, then decreased in early August. That is the overall trend of the runoff
variations during the ablation period. Figure 2 shows the variations in discharge and water level in siteⅠand siteⅡ, respectively. It is obvious that the runoff in the two sites had the similar changes approximately, except that there is short lag time between them. It is because that a small puddle, formed in the headwaters of the branch due to siltation, exerted a reservoir action on the water level change. The ambient temperature obviously affected the fluctuations of meltwater runoff. For site I, we compares the runoff with the soil temperature and air temperature during the same period (Figure 3, from July 21 to August 25, 2003), and found that the correlation between runoff and soil temperature was a little higher than that between runoff and air temperature. The correlation coefficients are 0.825 and 0.804 (significant all at 0.01), respectively. Figure 4 shows the relationship among the air temperature, precipitation and discharge at site I. It can be seen that each precipitation event coincided with the discharge decrease, which was caused by the weakening glacier ablation because of the lower air temperature and increased albedo by the fresh snow. The discharge began to increase along with the rising of air temperature after the end of precipitation. An exceptional case was on June 20, on which day because the air temperature did not decrease, the precipitation did not cause the discharge decrease. From the above, we can conclude that the primary impact factor on the meltwater runoff was the ambient temperature, and then was the precipitation.
Figure 2 Variations in discharge and water level at site I and site II, respectively
79
ZHAO Huabiao et al.
Figure 3 Relationship between discharge and ambient temperature
Figure 4 Variations of air temperature, precipitation and discharge at site I
2.2 Hydrochemical characteristics Table 1 and Table 2 are for the chemical composition of meltwater samples. Table 1 Ion concentrations (mg·L-1), EC (μs·cm-1) and pH of meltwater samples from site I
80
No.
Date
Na+
K+
Mg2+
Ca2+
Cl-
NO3-
SO42-
EC
pH
001
8-10
0.30
0.35
0.21
7.17
0.51
0.00
1.91
43.6
7.04
002
8-11
0.24
0.51
0.19
5.25
0.35
0.00
0.70
30.3
6.82
003
8-12
0.18
0.27
0.13
5.93
0.22
0.01
0.71
32.9
7.12
004
8-13
0.09
0.20
0.09
5.17
0.11
0.00
0.61
26.1
6.83
005
8-14
0.19
0.41
0.20
7.05
0.23
0.01
0.94
37.9
6.83
006
8-15
0.15
0.24
0.14
5.05
0.18
0.01
0.55
26.7
6.77
007
8-16
0.10
0.31
0.13
4.23
0.12
0.00
0.29
21.7
6.72
008
8-17
0.14
0.37
0.16
4.73
0.17
0.01
0.38
24.8
7.13
009
8-18
0.17
0.48
0.21
7.32
0.21
0.00
0.50
38.7
6.99
010
8-19
0.11
0.32
0.16
9.14
0.10
0.36
0.60
48.1
7.11
011
8-20
0.28
0.42
0.28
10.48
0.38
0.01
1.35
58.1
7.19
012
8-21
0.26
0.29
0.19
5.80
0.41
0.00
1.14
32.9
7.10
013
8-22
0.24
0.26
0.17
3.56
0.30
0.00
0.65
27.2
6.91
Journal of Mountain Science Vol 4 No 1 (2007)
Table 2 Ion concentrations (mg·L-1), EC (μs·cm-1) and pH of meltwater samples from site II No.
Date
Na+
K+
Mg2+
Ca2+
Cl-
NO3-
SO42-
EC
pH
001-003
8-10
0.46
0.96
0.54
13.32
0.49
0.46
7.23
77.5
7.66
004-006
8-11
0.50
1.15
0.57
14.42
0.65
0.50
7.84
83.1
7.49
007-025
8-12
0.46
0.99
0.54
14.08
0.50
0.33
6.93
78.2
7.29
026-042
8-13
0.45
0.95
0.56
14.68
0.48
0.43
7.77
81.88
7.17
043-059
8-14
0.55
1.12
0.68
15.65
0.64
0.79
10.27
96.3
7.36
060-076
8-15
0.54
1.13
0.65
14.90
0.61
0.71
9.45
92.6
7.43
077-093
8-16
0.46
1.00
0.54
12.96
0.50
0.51
8.07
82.1
7.27
094-098
8-17
0.48
1.06
0.56
13.03
0.52
0.42
7.31
81.9
7.27
099-101
8-18
0.48
0.92
0.49
11.94
0.54
0.20
6.42
74.6
7.18
102-104
8-19
0.49
0.96
0.55
13.95
0.52
0.55
8.04
85.2
7.47
105-107
8-20
0.54
1.04
0.63
13.90
0.57
0.77
7.77
85.9
7.72
108-110
8-21
0.65
1.27
0.73
14.96
0.72
0.17
8.60
92.3
7.81
111-123
8-22
0.60
1.17
0.69
15.25
0.67
0.72
8.20
91.9
7.91
114-116
8-23
0.49
1.01
0.56
14.08
0.49
0.25
6.99
84.5
7.45
2.2.1 pH and EC The pH values of site I, site II and precipitation samples ranged from 6.72 to 7.19, 6.77 to 8.53 and 5.65 to 6.55, respectively. The pH values of site II samples were higher than the ones of site I, which was caused by that glacial debris in the tributary river were much easier to dissolve in the meltwater than bare bedrock in the main river did. The pH values of precipitation were lower than those of meltwater, which means that H+ loss occurred in the melting process, and reflects the interactions between meltwater and underlying clasts during the runoff generation process. Research had shown that the pH values of a year-round precipitation ranged from 5.7 to 7.9 with the average of 6.9 in Glacier No.1 at the headwater of the Urumqi River, Tianshan, Xinjiang, China. The lower pH values appeared mostly in summer and autumn because of lower atmospheric alkaline dust contents in the atmosphere resulting from frequent precipitation events at that time (HOU et al. 1999). Frequent precipitations might also be one of the
reasons for lower pH values of the precipitation samples in Mt. Muztag Ata. The original acidity of natural rain calculated by CO2 partial pressure in the atmosphere at sea level was around 5.6 (Radojevic and Bashkin 1999). According to David and others (2003), the low CO2 partial pressure in the high elevation area was not a major contributor to the comparatively high pH value of its precipitation, and the chemical analysis indicated that the major contributor to alkaline precipitation was the continental dust on the Tibet Plateau. Nevertheless, it was a pity that we had no enough precipitation samples analyzing chemical components. However, we still consider that the precipitation pH in Mt. Muztag Ata is controlled by alkaline dust from the surrounding area. EC is usually used as a surrogate measure of total ion concentrations in meltwater (David 1979 & 1981, KANG 2000). The EC values ranged between 21.7 ~ 58.1 μs·cm-1, 39.1 ~ 103.3 µs·cm-1 and 2.62 ~ 32.20 µs·cm-1 for site I, site II and precipitation samples, respectively. It can be observed that the EC values of site II samples are apparently
81
ZHAO Huabiao et al.
higher than those of site I, and the precipitation EC is the lowest among all these samples. We know that water-soluble acidic and alkaline substances all can make the meltwater EC high, but they have opposite effects on pH values. Positive relationship exists between pH and EC of meltwater, which means that the meltwater is not or little affected by the acidic substances. The correlation coefficient between pH and EC of precipitation is 0.653. The
positive correlation is also observed in precipitation in the headwater area of the Urumuqi River and in the snow on the Qinghai-Tibet Plateau, respectively (YAO et al. 1993, HOU et al. 1999). We can say that it is not the acidic matter, but the soluble salt in alkaline dust that makes the EC values high in the inland arid area of China. Figure 5 shows the relationship between pH and EC for all samples.
Figure 5 Relationship between pH and EC in meltwater (daily average) and precipitation.
2.2.2 Major ion concentrations By comparing Table 1 and Table 2, it's easy to find that all the ion concentrations of site I samples were correspondingly lower than those of site II samples, which is consistent with the EC values discussed above. Sulfate and calcium were the dominant anion and cation in the measured ions, respectively. Each ion of all site II samples had stable percentage composition, but it was not the same as site I, indicating that the external factors of siteⅡriver course had little effects on the chemical components of meltwater in the runoff process. Differently from other research areas (YAO et al. 1993, SHENG et al. 1996), the average concentration of K+ in meltwater was higher than that of Mg2+ in this area, which was the same as in Zepu Glacier area (SHENG and CAO 1993). This could be explained by that the magnitude of ion concentration correlated closely with the lithology of local bedrock. The content of feldspar (including potas-
82
sium feldspar and plagioclase) and quartz was more than 50 % in the mineral components of gneiss (YE et al. 1996), which caused a little higher K+ concentration than Mg2+. After comparing the variations of ion concentrations, we could find that all the ions had the similar concentration changes in the same group of samples, except for nitrate. However, for the same ion, the changing trend of concentrations was different on each day during 12 ~ 16 August for siteⅡsamples (figure omitted). 2.2.3 Relationship between ion concentration and EC The correlation matrix of ion concentration and EC is shown in Table 3. The lower left half of Table 3 is a correlation matrix for 13 samples of site I, and the upper right half is for 116 samples of site II. The correlation coefficients for sample site I between EC and Ca2+, Mg2+ and SO42- are 0.97, 0.74
Journal of Mountain Science Vol 4 No 1 (2007)
and 0.62, respectively. The conductivity has a high correlation with each ion for site II samples, and high correlation coefficients exist between all ions excluding NO3-, which means that each ion has the similar and stable sources. Bare bedrock is exposed in the main river course, so the possible sources of ions for site I include rock hydrolization, atmospheric sedimentation and wind-blown dust from
nearby ground surface. There are low correlations between NO3- and each ion in all samples, and even inverse correlations appear in site I samples, indicating that NO3- has different sources from other ions. The NO3- in meltwater originates from the production of atmospheric photochemistry, microbial nitrification in soil and possibly anthropogenic sources.
Table 3 Correlation matrix of concentration of major ions and EC. The lower left half representing site I, and the upper right half representing site II Na+ Na+
K+
Mg2+
Ca2+
Cl-
NO3-
SO42-
EC
0.96
0.97
0.78
0.97
0.44
0.79
0.88
0.93
0.75
0.93
0.44
0.78
0.85
0.84
0.95
0.46
0.86
0.93
0.77
0.38
0.85
0.90
0.45
0.82
0.88
0.48
0.49
K+
0.35
Mg2+
0.78
0.66
Ca2+
0.26
0.39
0.64
Cl-
0.97
0.30
0.69
0.2
NO3-
-0.34
-0.05
-0.12
0.45
-0.37
SO42-
0.79
0.13
0.61
0.49
0.85
-0.14
EC
0.46
0.39
0.74
0.97
0.39
0.39
0.95 0.62
Note: Boldface, significant at 0.01; underline, at 0.05.
2.2.4 Relationship between ion concentrations and runoff The ion concentrations show inverse correlations with runoff and water level (Figure 6. All ions have the same concentration changes except NO3-, so only Na+ is shown). We know that the discharge increases with flow velocity, then the contact time between riverbed and stream water becomes shorter. The shorter time is not enough for soluble substances to be dissolved in stream water when it flows through. Dilution effect is possibly another reason (SHENG et al. 1996). 2.2.5 Classification of meltwater components In order to discuss the origins of each chemical substance from the interrelation of fluctuations in the concentrations of dissolved substances in meltwater, a principal component analysis was carried out. Due to the few numbers of samples for
site I, statistical analysis was only done for the 116 samples from siteⅡ. The soluble substances for statistical analysis consisted of eight sorts of ions subject to chemical analysis, and H+ calculated from the pH. Since ion concentrations ranged widely in magnitude and fluctuation, they were normalized into dimensionless values using the following equation (Keisuke 2003):
Vij =
Cij − C j
σj
Where Vij is the normalized value of the jth ion in the ith sample; Cij is the concentration of the jth ion in the ith sample; Cj is the average concentration of the jth ion in the period for the statistical analysis; and σj is the standard deviation of the concentration of the jth ion in the period for the statistical analysis.
83
ZHAO Huabiao et al.
The principal component analysis was applied for 116 samples of siteⅡ. Two principal components with eigenvalues of 1.0 or more were sampled, and varimax rotation was carried out for factor loadings. The factor loadings of each ion were obtained as shown in Table 4. The first factor loading of Mg2+ shows a positive highest value, followed by the positive, relatively high values of Na+, Cl-, K+, SO42- and Ca2+, then NO3- and H+. The second factor loading of H+ is the only positive value,
while that of NO3- shows a negative highest value. The first factor can be interpreted as a factor to show whether the ion is of rock or soil origin, and the second factor shows whether the ion originates from dry or wet deposition. The explained variance of the first factor is as high as 66.3 %, which means that this factor can explain 66.3 % of the fluctuations in ionic content of meltwater. Of the entire fluctuations, 83.8 % can be attributed to the first and second factors.
Figure 6 Relationships between sodium concentration and discharge (site I, a), and between ion concentration and water level (site II, b).
Table 4 Factor loadings of each ion for site II samples
84
Variable
Factor 1
Factor 2
Na+
0.943
-0.206
K+
0.929
-0.182
Mg2+
0.968
-0.172
Ca2+
0.869
-0.136
Cl-
0.941
-0.196
NO3-
0.403
-0.62
SO42-
0.902
-0.105
H+
0.003
0.92
Eigenvalue
5.3032
1.4036
Cumulative explained variance
66.30%
83.8 %
Journal of Mountain Science Vol 4 No 1 (2007)
3 Conclusion By analyzing the measured and experimental data of the Kartamak Glacier meltwater in Mt. Muztag Ata, it can be concluded that the meltwater runoff of Kartamak Glacier is related closely to ambient temperature, and that the glacier ablation occurs mostly from June to August. The meltwater is a little alkaline, and pH has a positive correlation with EC, which is caused by much alkaline substances dissolved in stream water. The chemical compositions of meltwater collected at the same sampling site are relatively stable. The interfaces such as rock and soil are the sources of soluble matter in the meltwater, thus the water-rock interaction and the status of ice-snow dominate the hydrochemical characteristics of glacier meltwater.
Since the chemical compositions of stream water varied greatly from day to day, and the sampling period was short, the characteristic changes discussed in this paper are somewhat limited. More studies are needed in this area in the future.
Acknowledgements This work was supported by the National Basic Research Program of China (Grant No. 2005CB422004), the Knowledge Innovation Project of CAS of China (Grant No. KZCX3-SW-339), and the Innovative Research Team of the National Natural Science Foundation of China (Grant No. 40121101).
References David D. Zhang, Mervyn Peart, C.Y. Jim et al. 2003. Precipitation chemistry of Lhasa and other remote towns, Tibet. Atmospheric Environment 37: 231 ~ 240. David N.Collins. 1979. Hydrochemistry of Meltwaters Draining from an Alpine Glacier. Arctic and Alpine Research,11(3): 307 ~ 324. D.N.Collins. 1981. Seasonal Variation of Solute Concentration in Melt Waters Draining from an Alpine Glacier. Annals of Glaciology, 2: 11 ~ 16. HE Xiaobo, DING Yongjian, LIU Shiyin, et al. 2005. Observation and Analyses of Hydrological Process of the Kartamak Glacier in Muztag Ata. Journal of Glaciology and Geocryology, 27(2): 262 ~ 268. (In Chinese). HOU Shugui, Qin Dahe, Ren Jiawen, et al. 1999. The Present Environmental Processes of the pH and Conductivity Records in the Glacier No.1 at the Head waters of Urumqi River, Tianshan Mountains. Journal of Glaciology and Geocryology, 21(3): 225 ~ 232. (In Chinese). KANG Shichang, QIN Dahe, YAO Tandong, et al. 2000. A study on precipitation chemistry in the late summer in the northern slope of Mt. Xiaxabangma. Acta Scientiae Circumstantiae, 20(5): 574 ~ 578. (In Chinese). Keisuke Suzuki. 2003. Chemistry of stream water in a snowy temperate catchment. Hydrological Processes, 17: 2795–2810. LIU Fengjing, Mark Williams, Cheng Guodong, et al. 1999. Hydrochemical process of snowmelt and stream water in Urumqi River, Tianshan Mountains. Journal of Glaciology and Geocryology, 21(3): 213 ~ 219. (In Chinese). LU Aigang, DING Yongjian, PANG Hongxi et al. 2005. Impact of Global Warming on Water Resource in Arid Area of Northwest China. Journal of Mountain Science, 2(4):313 ~ 318. PU Jianchen, YAO Tandong, DUAN Keqin. 2003. An Observation on Surface Ablation on the Yangbark Glacier in the Muztag Ata, China. Journal of Glaciology and Geocryology, 25(6): 680 ~ 684. (In Chinese). Radojevic, M., Bashkin, V.N., 1999. Practical Environmental Analysis. Royal Society of Chemistry, Cambridge. SHEN Yongping, LIU Shiyin, WANG Genxu, et al. 2001. Fluc-
tuations of glacier mass balance in watersheds of Qilian Mountains and their impact on water resources of Hexi region. Journal of Glaciology and Geocryology, 2001, 23(3): 244 ~ 250. (In Chinese). SHENG Wenkun, CAO Zhentang. 1993. Hydrochemical Characteristics of Glacier Area in Zepu. In: YAO Tandong, et al. (eds.), Glaciological Climate and Environment on Qing-Zang Plateau. Beijing: Science Press. Pp 48 ~ 52. (In Chinese). SHENG Wenkun, WANG Ninglian, PU Jianchen. 1996. The Hydrochemical Characteristics in the Dongkemadi Glacier Area, Tanggula Range. Journal of Glaciology and Geocryology, 18(3): 235 ~ 243. (In Chinese). SHI Yafeng, HUANG Maohuan, YAO Tandong, et al. 2000. Glaciers and Their Environments in China—the present, past and future. Beijing, China: Science Press. Pp 36 ~ 37. (In Chinese). SHI Yafeng. 2001. Estimation of the water resources affected by climatic warming and glacier shrinkage before 2050 in West China. Journal of Glaciology and Geocryology, 23 (4): 333 ~ 341. (In Chinese). SU Zhen, LIU Shiyin, WANG Zhichao. 1989. Modern glaciers of Mt.Muztagata and Mt.Kongur. Journal of Natural Resouces, 4(3): 241~246. YAO Tandong, SHENG Wenkun, PU Jianchen. 1993. Chemical Composition and Variation in Tanggula Ice Core. In: YAO Tandong, et al. (eds.), Glaciological Climate and Environment on Qing-Zang Plateau. Beijing: Science Press. Pp 38 ~ 43. (In Chinese). YAO Tandong, SHENG Wenkun, YANG Zhihong. 1993. A Study on Ice and Snow Chemistry in Qing-Zang (Tibet) Plateau. In: YAO Tandong, et al. (eds.), Glaciological Climate and Environment on Qing-Zang Plateau. Beijing: Science Press. Pp 8 ~ 15. (In Chinese). YE Baisheng, HAN Tianding, DING Yongjian. 1999. Some changing characteristics of glacier streamflow in Northwest China. Journal of Glaciology and Geocryology, 21(1): 54 ~ 58. (In Chinese). YE Junlin, HUANG Dinghua, ZHANG Junxia. 1996. Introduction to Geology. Beijing, China: Geology Press. Pp 110. (In Chinese).
85