Journal of Minerals and Materials Characterization and Engineering, 2012, 11, 744-756 Published Online July 2012 (http://www.SciRP.org/journal/jmmce)
Preparation and Characterization of Electrically and Thermally Conductive Polymeric Nanocomposites Mousam Choudhury, Smita Mohanty, Sanjay K. Nayak*, Rakesh Aphale Laboratory for Advanced Research in Polymeric Materials (LARPM), Central Institute of Plastics Engineering & Technology, Bhubaneswar, India Email: *
[email protected] Received June 1, 2012; revised July 5, 2012; accepted July 22, 2012
ABSTRACT The dielectric properties of composites and nanocomposites composed of epoxy resin as base matrix and AlN (Aluminum Nitride) as micro and nanofiller has been studied at variable loading of AlN. To improve the dispersion of the filler within the polymer matrix, AlN was surface modified with silane coupling agent (SCA). The thermal conductivity behavior of epoxy/AlN composites and nanocomposites has been studied at variable percentage of filler and temperatures. Test result indicated an increase of thermal conductivity of the composites at 20 wt% of AlN. Also, silane treated composites exhibited improved electrical conductivity properties wherein the electrical insulation property decreased in terms of di-electric strength and resistivity. Keywords: Epoxy; Micro-AlN; Nano-AlN; Insulation; Electrical Properties; Resistivity
1. Introduction Ceramic filler reinforced polymer composites have generated considerable interest in the recent years in the areas as of electronic packaging. Relative case of processibility and excellent flexibility in these composites has driven them as potential candidates for development of devices for electric stress control and high storage capability and high permittivity material. Epoxy, a versatile thermoset resin has been widely utilized as a packaging and insulating material in electronic and electrical industries, due to its high resistivity, low dielectric constant and excellent processibility. However, certain impediments like low thermal conductivity and high CTE of these polymers have resulted in thermal failure during its enduse application. Moreover, in addition to thermal and electrical properties, mechanical properties of epoxy resin as a substrate and packaging material also plays a vital role. Several investigation pertaining to improving the stiffness and strength in the electronic packaging materials with the use of inorganic fillers like (Al2O3, SiO2, ZnO and BeO) [1-6] have been suggested. Similar other fillers such as silicon carbide SiC [3,7,8], nitride (AlN and BN) [1-3,5,7-18] and carbon based materials are also known to effectively resolve the problems of thermal dissipation. Aluminium nitride (AlN), an inorganic/ceramic filler *
Corresponding author.
Copyright © 2012 SciRes.
with high intrinsic thermal conductivity (319 W/mK) [19] high electrical resistivity (>1014 Ω·cm) [20], low dielectric constant (8.9 at 1 MHz) [20] and low cost has generated considerable research interest as a reinforcing agent in the recent years. Various researches on polymer/AlN composites with modified CTE, tensile strength and dielectric constant have been performed and reported. In the present study, AlN—epoxy composites prepared using solvent casting technique has been investigated. AlN particles at micro and nano levels have been used as a reinforcing filler to evaluate its effect on thermal and electrical conductive properties of the epoxy resin. Also AlN has been modified using wet-reflux method and silane based coupling agent has been used to improve the compatibility with the matrix polymer. Various properties such as dielectric strength, volume and surface resistivity, thermal conductivity of the composites and nanocomposites have been studied. Also, the morphology of the composites has been investigated employing scanning electron microscopic technique.
2. Experimental 2.1. Raw Materials Aluminium Nitride (AlN) with an average diameter of less than 4 µm was obtained from M/s Accer chemicals, Mumbai. Nano size AlN of less than 100 nm was procured from Aldrich chemicals. The epoxy resin used in the present study was liquid JMMCE
M. CHOUDHURY
diglycidyl ether of Bisphenol-A type (Araldite LY556) with an equivalent weight per epoxide group of 195 g/mol, has been supplied by M/s Marshal polymers, Kolkata, India. The hardener Triethylene tetramine (TETA, HY951) was also obtained from M/s Marshal Polymers, Kolkata, India. γ-Aminopropyl-triethoxysilane (A1100) with a chemical formula C6H17NO3Si, having a density 1.027 g/cc was purchased and used as a coupling agent, from M/s Sigma Aldrich, India. All other reagents of AR grade have been used as such without any further modification.
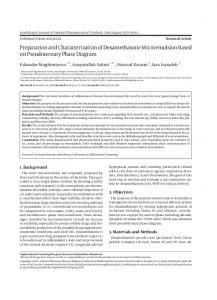
2.2. Surface Modification of AlN Particles The surface modification of AlN Particles using γ-aminopropyl-triethoxysilane coupling agent was carried out using wet-reflux method. In wet reflux method the ethanol/water/AlN mixture was sonicated for 90 minutes with addition of 10% silane by weight of AlN. The amount of coupling agent used, was 10 wt% based on the weight of the AlN powder. Coupling agent/ethanol solution was slowly added to 90% ethanol and 10% water mixture by a dropping funnel. Then the mixture was stirred continuously for 2 h and AlN powder was added subsequently. The coupling agent/ethanol/AlN powder mixture was stirred using an electric mixer for 3 h at 80˚C. The resulting slurry was centrifuged at 12000 rpm for 15 min and then washed with ethanol. The surface modification of particles using γ-aminopropyl-triethoxysilane is represented in the reaction scheme (Figure 1).
2.3. Synthesis of Epoxy/AlN Micro and Nanocomposites Using Casting Technique Epoxy/AlN micro and nanocomposites were prepared using casting technique, initially; required quantity of AlN powder was added to the epoxy resin and stirred. Then the hardener TETA of desired amount was added to the epoxy/AlN mixture and resulting mixture was stirred vigorously to ensure homogenous dispersion of the AlN within the epoxy matrix. Finally, the mixture was poured onto stainless steel mold, pre-cured in an oven at 135˚C for 3 h and then maintained for 12 h at ambient temperature. The post curing was carried out at 80˚C for 2 h, 100˚C for 1 h and 120˚C for 2 h respectively. Then the mold were left in the oven and allowed to cool gradually to room temperature. Similar procedure was also employed for preparation of epoxy/AlN nanocomposite. In case of epoxy/AlN microcomposites both surface-treated and untreated AlN have been fabricated. The compositions in both surface-treated and untreated epoxy/AlN composites are maintained the same as shown in the Table 1. Various compositions prepared have been highlighted in the Table 1. Copyright © 2012 SciRes.
ET AL.
745
2.4. Characterization 2.4.1. Density Test of Composites and Nanocomposites The density test of the epoxy/AlN composites and nanocomposites was measured by the Archimedes principle using alcohol as the medium. The theoretical densities in the sample were calculated based on the density of AlN of 3.26 g/cm3 and the measured density of the epoxy. The volume percent of filler was determined from the density of the neat epoxy and filler. 2.4.2. Dielectric Breakdown Strength Dielectric breakdown strength was measured using OTS100 AF/2, alternating current dielectric strength tester (Meggera OTS, UK) in accordance with ASTM D 149 2004. Specimen of 50 mm dia and 3 mm thickness were placed between two 10 mm diameter copper ball electrodes and the electrode system containing the measured sample was immersed in the pure silicone oil to prevent the surface flashover. The test voltage was applied across two ball-typed electrodes and was increased until the sample was punctured. Five breakdown tests were repeatedly performed on each specimen. All of the measurements were performed under the same humidity and temperature. 2.4.3. Volume Resistivity Volume resistivity in the samples was measured using Ultra Megaohm Meter (SM-8220, TOA Electronics Ltd., Japan) in accordance with ASTM D 257. Square samples of 100 mm × 100 mm × 8 mm were taken for measurement of the resistivity in the samples. 2.4.4. Thermal Conductivity The thermal conductivity (W/mK) was calculated by the product of the thermal diffusivity (mm2/s), specific heat (J/gK) and density (g/cm3), using Unitherm 2022 (Anter Corpo, USA) thermal conductivity tester according to Table 1. Composition of epoxy/AlN micro and nanocomposite. Specimen Composition
Epoxy (%)
Hardener (%)
AlN (%)
Epoxy + Hardener + 0% AlN
88
12
0
Epoxy + Hardener + 5% AlN
83
12
5
Epoxy + Hardener + 10% AlN
78
12
10
Epoxy + Hardener + 20% AlN
68
12
20
Epoxy + Hardener + 30% AlN
58
12
30
Epoxy + Hardener + 5% nAlN
83
12
5
Epoxy + Hardener + 20% nAlN
68
12
20
JMMCE
M. CHOUDHURY
746
ET AL.
Figure 1. The schematic reactions of AlN particles and silane.
ASTM E 1530. Circular samples of 50 mm diameter and 3 mm thickness, flat on both the sides were taken for measurement of thermal conductivity. The samples were coated with a thin graphite layer on both front and back sides to increase the emission/absorption behavior at variable temperature conditions at 25˚C, 50˚C and 75˚C respectively. 2.4.5. Thermo Gravimetric Analysis (TGA) The thermal stability in surface-treated and untreated AlN particles along with the composite and nanocomposite samples have been studied employing TGA analysis (TGA, Q50, TA Instruments, USA). All the samples were scanned from 50˚C to 600˚C at a rate of 10˚C/min under N2 atmosphere. Corresponding degradation temperatures and percentage char have been reported. 2.4.6. Dynamic Mechanical Analysis (DMA) DMA was carried out for composites and nanocomposites using a dynamic mechanical thermal analyzer (Q 800, M/s TA Instruments, USA). The samples were scanned in tension mode from 30˚C to 200˚C at a heating rate of 10˚C/min and fixed frequency of 1 Hz. Corresponding dynamic modulus, loss factor and Tg was determined. 2.4.7. Scanning Electron Microscopy (SEM) The dispersion characteristics of the epoxy/AlN composites and nanocomposites have been studied employing scanning electron microscope (EVMA—15 Carl Zeiss, UK). Prior to imaging a thin section of the fractured surface of the sample was mounted on the aluminium stub using a conductive silver paint and was coated with gold prior to fractographic examination.
3. Results and Discussion 3.1. Modification of AlN Particles The grafting percentage of the silane coupling agent was Copyright © 2012 SciRes.
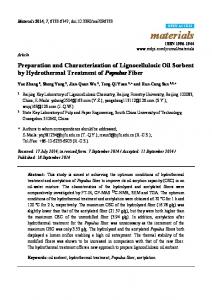
determined by TGA measurements. For exact result, the surface treated AlN nanoparticles were washed several times to ensure complete removal of free silane coupling agent or traces of any physically bonded silane molecules. As evident from Figure 2, the TGA thermogram of untreated and treated AlN microparticles, the weight loss in case of treated AlN particles were higher than that of the untreated particles over the entire experimental range at lower temperature region < 200˚C, the weight loss in both the Unsurface-treated and treated AlN particles is probably due to the removal of water molecules absorbed on surface of AlN. The significant weight loss in the surface-treated AlN particles in the temperature range of 75˚C - 650˚C, is probably related to the condensation of silanol groups and the decomposition of grafted silane molecules [21]. This further confirms that the silane groups are successfully bonded onto the surface of the AlN particle.
3.2. Density of Composites The interaction of the filler with the polymer matrix is a complex phenomenon that is usually influenced by factors that includes free volume; molecular weight; which in turn is influenced by its density. Figure 3 shows the epoxy/surface-treated AlN composite showing higher density as compared with epoxy/unsurface-treated AlN composite which may be attributed towards the presence of more volume fraction of voids and pores in epoxy/ unsurface-treated AlN composites. The crosslink density of the composite sample is sensitive towards its volume fraction of voids and pores. As the grafting silanes on the surface of AlN particles enhanced the interaction between the matrix and the filler (AlN); it further reduces the free spaces among the epoxy molecules and increases the congestion or difficulty of epoxy molecules to either rotate or move. This further contributes to an increase in the density of the composites. JMMCE
M. CHOUDHURY
ET AL.
747
Table 2. Density of epoxy/unsurface-treated and surfacetreated AlN nanocomposites. Density (g/cm3) Specimen Composition
Figure 2. TGA Thermogram of untreated & treated AlN particles.
Figure 3. Density of virgin epoxy and epoxy/surface treated and unsurface-treated AlN composites.
Further, the density in the epoxy/AlN nanocomposites is depicted in the Table 2.
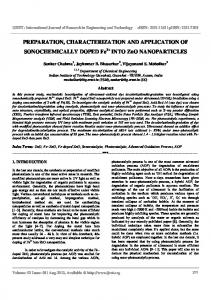
3.3. Thermal Conductivity The variation of thermal conductivity of epoxy/AlN composites and nanocomposites is represented in Figures 4 and 5 and Table 3. Virgin epoxy shows a thermal conductivity value of 0.142 W/mK at 25˚C which subsequently increases to 0.167 & 0.186 W/mK with the increase in temperature up to 50˚C & 75˚C respectively. The incorporation of micro as well as nano AlN to the tune of 20 to 30 wt%, results in an increase in the thermal Copyright © 2012 SciRes.
Epoxy/ Epoxy/ Unsurface-Treated Surface-Treated AlN AlN
Epoxy + Hardener + 5% nAlN
1.231
1.242
Epoxy + Hardener + 20% nAlN
1.362
1.382
conductivity in the virgin matrix. At low loading of unsurface-treated AlN micro and nanoparticles of 5 wt%, no significant increase in thermal conductivity of the matrix polymer was observed at 25˚C and 50˚C. However, the conductivity increased with the increase in the loading levels of AlN from 10 to 20 wt%, as there is a consistent increase in the conductivity values of the epoxy/AlN micro composites. Further, surface treated epoxy/AlN micro composite revealed higher conductivity values as compared with the untreated samples. This behavior is probably due to the fact that surface modification minimizes the defects in the lattice structure of AlN, thus contributing to reduction in interfacial phonon scattering and decreasing the interface heat resistance while enhancing the conductivity. The epoxy/AlN micro composite at 20% AlN loading exhibits an optimum conductivity values, hence this composition has been retained for nanocomposite samples. A comparison with minimal loading of 5 wt% in epoxy/AlN has also been made with micro composite. It is evident that at low loading levels of nAlN also, there was no appreciable increase in the conductivity of the matrix. However, at 30 wt% of nAlN (both surface treated & untreated), there was a significant increase in the conductivity of epoxy matrix when compared with micro composite. This is probably due to the presence of nanoscale platelets which creates an efficient pathway for conduction. The epoxy/surface-treated nAlN, revealed higher conductivity value, thus confirming efficient interfacial adhesion between the filler & the matrix due to reduction in agglomeration of AlN nanoparticles with silane treatment. At higher loading of 30 wt% of AlN in the microcomposite, there was a decrease in thermal conductivity, which is possibly due to agglomeration of AlN particles that results in the formation of micro cracks at the interface in the composite [21]. In all the cases, conductivity increases with the increase in temperature which shows that there is an increase in interfacial adhesion at higher temperature. 3.3.1. Relationship between Thermal Conductivity of Epoxy Composites and AlN Fractions It has been claimed that in case of nanofluids in which a small quantity of small particles (some nanometers in JMMCE
M. CHOUDHURY
748
ET AL.
(a)
(a)
(b)
(b)
(c)
(c)
Figure 4. Thermal conductivity of epoxy/unsurface-treated AlN and epoxy/surface-treated AlN microcomposites at different temperatures: (a) 25˚C; (b) 50˚C; and (c) 75˚C.
Figure 5. Thermal conductivity of epoxy/unsurface-treated AlN and epoxy/surface-treated AlN nanocomposites at different temperatures: (a) 25˚C; (b) 50˚C; and (c) 75˚C.
Copyright © 2012 SciRes.
JMMCE
M. CHOUDHURY
ET AL.
749
Table 3. Variation of thermal conductivity of epoxy/AlN composites and nanocomposites. Thermal Conductivity (W/mK) Specimen Composition
Unsurface-Treated AlN
Surface-Treated AlN
Temperature 25˚C
50˚C
75˚C
25˚C
50˚C
75˚C
Epoxy + Hardener + 0% micro AlN
0.142
0.167
0.186
0.142
0.167
0.186
Epoxy + Hardener + 5% micro AlN
0.142
0.172
0.221
0.189
0.202
0.233
Epoxy + Hardener + 10% micro AlN
0.179
0.201
0.221
0.179
0.209
0.229
Epoxy + Hardener + 20% micro AlN
0.192
0.207
0.229
0.192
0.211
0.231
Epoxy + Hardener + 30% micro AlN
0.158
0.197
0.281
0.202
0.229
0.253
Epoxy + Hardener + 5% nAlN
0.132
0.183
0.195
0.150
0.191
0.210
Epoxy + Hardener + 20% nAlN
0.201
0.237
0.267
0.225
0.257
0.280
size) present in a fluid matrix, gives very high thermal conductivity. As thermal conductivity, k, is the property of a material’s ability to conduct heat as it appears primarily in Fourier’s Law for heat conduction, the conductivity of AlN is much greater than that of epoxy. The addition of alluminium nitride filler to the epovy matrix thereby results in increase in thermal conductivity of the composite as in Figures 4 and 5. The thermal conductivity increases with increase in AlN fractions. 3.3.2. Use of Kanari Model for Prediction of Thermal Properties of Polymer Composites Kanari model is a revised Bruggeman’s equation and presents a relationship between the thermal conductivity of composites and the volume fractions of filler which is a function of the shape of filler: 1 1 x
1Vf
kc k f k m k m k f kc
(1)
where Vf is the volume fraction of filler; km is the thermal conductivity of matrix; kf is the thermal conductivity of AlN as filler; kc is the thermal conductivity of composite; km is the thermal conductivity of matrix and x is constant, determined by sphericity of the filler. For alluminium nitride, x is substituted as 2.5 in Equation (1). The resullting model is given in Figure 6. Figure 6 clearly depicts the non-compliance of the experimental data curve with Kanari model. It is clear that each curve shows a small change in slope such as the thermal conductivity increases gradually with an increase in volume fraction of inorganic filler.
3.4. Dielectric Break Down Strength Figures 7 and 8 depicts the dielectric break down strength of virgin epoxy and epoxy/AlN treated and unCopyright © 2012 SciRes.
Figure 6. Thermal conductivity of the composite as a function of volume fraction of AlN.
treated micro composite at variable AlN loading. It is evident that break down strength of virgin epoxy increases marginally with the increase in AlN loading form 0 to 20 (wt%). At filler concentration of