We report on a study of single-phase (superconducting) YBa2Cu;}07 and (nonconducting) Y2 BaCu05 and mixed phases of ... There are various infrared studies of YBa 2 C u 3 0 7 (Refs. 8 - .... aluminum oxide crucible covered with a tight lid. .... + ACT, where p 0 ...... Several questions remain: (1) Why does o\ (at room tem-.
Preparation, characterization, and far-infrared study of ceramic high-T superconductors c
T. Zetterer, W . Ose, J. Schutzmann, H. H. Otto, P. E. Obermayer, N . Tasler, H. Lengfellner, G. Lugert, J. Keller, and K. F. Renk Fakult'at fur Physik, Universitat
Regensburg, 8400 Regensburg,
Federal Republic of
Germany
Received August 25, 1988; accepted November 16, 1988 We report on a study of single-phase (superconducting) YBa Cu }07 and (nonconducting) Y B a C u 0 and mixed phases of these compounds in bulk and film samples and on an investigation of ceramic bulk material of the homologous series Tl2Ba2Ca Cu i02 +6We describe preparation and structural characterization by x-ray diffraction analyses and further characterization by electric, magnetic, tunnel junction, and Raman scattering studies, and we present results of far-infrared reflectivity measurements. In a theoretical analysis we relate the phonon structure of reflectivity spectra to geometric structure of a metallic network, with holes filled with nonconducting material. The influence of superconductivity on reflectivity is also investigated. 2
n
n+
discovery
La -xBa Cu0 2
x
mixed i n a ball mill.
of h i g h - T
superconductors
c
2
3
7
a n d o f t h e h o m o l o g o u s series B i S r C a C u „ + i 0 2
3-6)
of the
( R e f . 1) a n d Y B a C u 0 - ^ ( R e f . 2) f a m i l i e s
4
and Tl Ba Ca, Cu 2
2
l
n +
2
n
2 n
+6-
(Refs.
(
i 0 2 , + 6 - < (n = 0, 1, 2) ( R e f . 7) h a s l
stimulated m u c h activity i n the investigation of cuprates. W e report o n a far-infared reflectivity study of the ceramic h i g h - T m a t e r i a l s Y B a C u 0 c
(n = 0, 1, 2).
2
3
7
and T l B a C a n C u 2
2
I n a d d i t i o n , we i n v e s t i g a t e d
Y B a C u 0 5 a n d phase mixtures. 2
n +
i0
2 n +
6-f
(nonconducting)
T h e far-infrared study was
combined with a careful analysis by x-ray diffraction a n d with further characterization by a variety of other
tech-
5
powder i n A 1 0 2
at a t e m p e r a t u r e hours.
of 950-970° C for a period
of several
T h e samples u s u a l l y contained, i n a d d i t i o n to the
YBa Cu 072
T h e m a t e r i a l w a s h e a t e d e i t h e r as
c r u c i b l e s o r as p r e s s e d p e l l e t s i n a f u r n a c e
3
3
( 5
phase, t h e so-called green phase Y B a C u O o 2
a n d several other phases.
T o obtain single-phase
(super-
conducting) Y B a C u 3 0 7 - 5 , we reground the samples, homog2
e n i z e d t h e m w e l l , p r e s s e d t h e m i n t o p e l l e t s (8 t o n s / c m ) > 2
a n d fired t h e m again at 950°C.
F l o w i n g oxygen was needed
d u r i n g t h e c o o l i n g p e r i o d , a n d a longer stage 450°C
was necessary
for resorption
Y B a C u 0 7 - a with 5 ^ 0 . 2
3
(2 h ) n e a r
of oxygen
to
T h e r e are various i n f r a r e d studies of Y B a C u 0 7 (Refs. 8 2
19) a n d a f e w s t u d i e s o f Y B a C u 0 2
5
3
(Refs. 18, 20, a n d 21); a
s y s t e m a t i c f a r - i n f r a r e d s t u d y o f a mixed-phase
sample was
r e p o r t e d i n R e f . 18. I n t h e p r e s e n t s t u d y w e s h o w t h a t i n a phase m i x t u r e of conducting a n d nonconducting materials the p h o n o n resonances of the n o n c o n d u c t i n g m a t e r i a l have a strong influence
on the far-infrared reflectivity.
Corre-
spondingly, i n a single-phase polycrystalline material w i t h different orientation of crystallites that have
anisotropic
d y n a m i c a l c o n d u c t i v i t y , p h o n o n resonances m a y be seen i n large s t r e n g t h i n t h e f a r - i n f r a r e d reflection spectra; evidence is r e p o r t e d f o r t h e T l B a C a C u + i 0 n + 6 - h o m o l o g o u s s e 2
2
n
n
2
f
W e present a theoretical analysis that indicates that
the p h o n o n structure of the far-infrared reflectivity spect r u m of a sample depends strongly o n the geometric structure of the network of conducting material i n the sample. T h e analysis p e r m i t s extraction of characteristic parameters for t h e i n f r a r e d - a c t i v e p h o n o n modes.
Furthermore, infor-
mation on the dynamic conductivity of materials i n the norm a l a n d s u p e r c o n d u c t i n g states is o b t a i n e d .
form
T h i s r e s o r p t i o n o f o x y g e n leads to
the transition from the tetragonal structure of Y B a C u 0 6 . 5 2
niques.
ries.
2
n
1. I N T R O D U C T I O N The
;
3
(5 = 0.5) t o t h e o r t h o r h o m b i c s u p e r c o n d u c t i n g Y B a C u 0 7 - s 2
3
(5 ~ 0 ) . W e f o u n d t h a t a n a d d i t i o n a l annealing step resulted i n an enhancement of far-infrared reflectivity of our samples. A f ter t h e first h e a t t r e a t m e n t , t h e fine r e g r o u n d p o w d e r was a n n e a l e d a t 7 5 0 ° C f o r 10 h i n f l o w i n g o x y g e n a n d c o o l e d t o room temperature within 2 h .
O n e of the samples showed
e x t r a o r d i n a r i l y h i g h f a r - i n f r a r e d r e f l e c t i v i t y (see S e c t i o n 4 below), i n d i c a t i n g h i g h surface quality. s h o w e d a large M e i s s n e r effect.
T h i s s a m p l e also
W e do not know which
special c o n d i t i o n s were responsible for t h e difference
from
the other s a m p l e s , w h i c h were p r e p a r e d b y a l m o s t t h e same procedure b u t h a dlower far-infrared reflectivity. B.
Characterization of Y B a C u 0 2
3
7
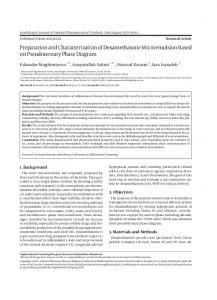
O u r samples were c h a r a c t e r i z e d b y x - r a y p o w d e r d i f f r a c t i o n t o d e t e r m i n e t h e l a t t i c e c o n s t a n t s as w e l l as t o f i n d o u t t h e content of foreign phases i n t h e samples. diffraction pattern of Y B a C u 0 2
3
7
T h e x-ray powder
i s s h o w n i n F i g . 1(a). F o r _
t h e o r t h o r h o m b i c u n i t c e l l ( s p a c e g r o u p Pmmm)
we f o u n d
t h e l a t t i c e c o n s t a n t s a = 3.8194(8) A, b = 3.8883(8) A, a n d c = 11.6677(2) A, w h i c h agree w i t h p u b l i s h e d d a t a .
2. S A M P L E P R E P A R A T I O N A N D CHARACTERIZATION
2 2 2 3
I n F i g . 1(b) w e s h o w a B r a g g - B r e n t a n o d i a g r a m o f t h e surface of our h i g h l y reflecting sample.
A comparison with
F i g . 1(a) i n d i c a t e s t h a t a t e x t u r e w i t h p r e f e r e n t i a l c - a x i s A.
Preparation of Y B a C u 0
We
synthesized Y B a C u 0 - *
2
2
3
3
7
orientation p e r p e n d i c u l a r to the sample surface
7
(5 >
0) f r o m
appropriate
a m o u n t s of Y 0 , B a C 0 , a n d C u O fine powders, usually 2
3
3
0740-3224/89/030420-16$2.00
occurred.
F o r a further characterization of the sample, electron microscope pictures were t a k e n .
ig 1989 Optical Society of America
T h e p i c t u r e s , p u b l i s h e d else-
CO
0 Fig, 1.
X-ray diffraction pattern for Y B a 2 C u 0 7 : 3
[Cu-KS]
(a) powder diagram, (b) Bragg-Brentano diagram.
for e V > A a n d / = 0 for e V < A , where P
d e n o t e s the
12
t u n n e l i n g p r o b a b i l i t y , i V ^ O ) is t h e d e n s i t y o f s t a t e s a t the F e r m i l e v e l o f t h e n o r m a l m e t a l , is AT (0) t h e d e n s i t y of states 2
at the F e r m i level of Y B a C u 0 2
3
(neglecting
7
superconduc-
tivity), a n d the last t e r m takes into account the supercond u c t i n g state. T h e d o t t e d curve of F i g . 3 shows the theoretical characteri s t i c f o r 2A/kT
= 4.6.
c
A better agreement w i t h the experi-
m e n t is o b t a i n e d b y c h o o s i n g t w o , i n s t e a d o f o n e , d i f f e r e n t e n e r g y - g a p v a l u e s ( w i t h 2A/kT
= 3.3, 7) a n d a d d i n g the
c
corresponding currents.
T h e r e s u l t i n g I-V
characteristic
( s o l i d c u r v e o f F i g . 3) d e s c r i b e s t h e e x p e r i m e n t a l d a t a w e l l . T w o d i f f e r e n t e n e r g y g a p s (or a d i s t r i b u t i o n o f g a p s ) m a y be caused by crystallites of different orientations.
A further
d i s c u s s i o n is g i v e n b e l o w i n c o n n e c t i o n w i t h f a r - i n f r a r e d s t u d i e s ( S e c t i o n 5).
D. Fig. 2. Resistance of YBa Cu 07 for our highly reflecting sample (open circles) and our sample with the highest T (filled circles). 2
3
c
Ac Josephson Effect in Y B a C u 0 Break Junctions 2
3
ers i n Y B a C u 0 , w e s t u d i e d t h e i n f l u e n c e o f m i c r o w a v e 2
3
7
radiation on Josephson junctions. where,
1 9
show t h a t large areas of the s a m p l e are covered w i t h
p l a t e l e t s ( t y p i c a l s i z e 2 ^im X 8 fim) w i t h t h e c r y s t a l l o g r a p h i c
7
T o obtain i n f o r m a t i o n on the superconducting charge carriF o r p r e p a r a t i o n of clean
Josephson junctions a break-junction technique plied.
2 8
was a p -
A Y B a C u 0 7 sample was b r o k e n mechanically in 2
3
c axis perpendicular to the surface, i n agreement w i t h the x-
l i q u i d h e l i u m (at 4.2 K ) , a n d m i c r o w a v e r a d i a t i o n ( p o w e r ^ 1
ray analysis.
m W ) at a frequency v -
9.52 G H z w a s i r r a d i a t e d i n t o the
r
T h e resistances, measured by the s t a n d a r d low-frequency
c r y o s t a t t h a t c o n t a i n e d t h e j u n c t i o n . S t e p s i n t h e I-V
char-
four-probe m e t h o d w i t h s i l v e r - p a i n t contacts, are s h o w n i n
acteristic are expected at voltages V
F i g . 2 for o u r Y B a C u 0
m o n i c of t h e f r e q u e n c y of t h e m i c r o w a v e r a d i a t i o n corre-
2
3
7
s a m p l e w i t h the highest value of T
c
( ^ 94 K ) a n d f o r t h e s a m p l e (T far-infrared reflectivity.
c
~ 86 K ) t h a t s h o w e d h i g h e s t
s p o n d s t o t h e J o s e p h s o n f r e q u e n c y vf
T h e resistances decrease linearly Vf
w i t h decreasing t e m p e r a t u r e , a n d the transitions to superc o n d u c t i v i t y a r e s h a r p (AT
& 2 K ) . T h e specific resistances
C
a t r o o m t e m p e r a t u r e w e r e ~ 3 0 0 n& c m .
a t w h i c h t h e nth h a r -
n
= qV /h n
(2)
= ±nv
r)
w h e r e q d e n o t e s t h e c h a r g e o f t h e s u p e r c o n d u c t i n g charge carriers.
T h e s h a p e o f t h e I-V
characteristic
depended
strongly on microwave intensity. Characteristic curves that
C.
Point-Contact Tunnel Spectroscopy on Y B a C u 0 2
3
s h o w t h e s t e p s w e l l a r e d r a w n i n F i g . 4.
7
T h e structure
Point-contact tunneling measurements initiated i n various
corresponds to steps at voltages ( w i t h V
laboratories have been published.
f o r q t h a t are t w i c e t h e e l e m e n t a r y c h a r g e .
F r o m these
measure-
m e n t s s u p e r c o n d u c t i n g energy gaps w i t h values of from a p p r o x i m a t e l y 3 to 6 were
deduced. " 2 4
2A/kT
c
n+l
V„
19.7 mV)
T h e h e i g h t of
t h e s i n g l e s t e p s m a y be r e l a t e d t o t h e m i c r o w a v e i n t e n s i t y b y B e s s e l functions of the first k i n d .
2 7
-
Half-integer multiples
T o obtain i n f o r m a t i o n on the existence of a superconducti n g e n e r g y g a p , we a l s o p e r f o r m e d a t u n n e l i n g e x p e r i m e n t . A p p l y i n g the f o u r - t e r m i n a l m e t h o d , we m e a s u r e d the c u r r e n t - v o l t a g e (I-V)
characteristic, using a point contact con-
sisting of a n e l e c t r o l y t i c a l l y etched t u n g s t e n t i p (diameter » 1 fim)
as o n e e l e c t r o d e a n d t h e s u r f a c e o f t h e Y B a C u 0 2
s a m p l e as t h e o t h e r e l e c t r o d e . upon the Y B a C u 0 2
3
7
7
s a m p l e b y use of a d i f f e r e n t i a l screw.
C o n t a c t resistivities f r o m several k i l o h m s to 1 M Q obtained.
3
T h e tungsten t i p was placed were
T o p r e v e n t d i s t o r t i o n or s l i p p i n g off of the t u n g -
sten t i p , the tungsten wire was bent into a n elastic knee. T h e sample w i t h the t i p was i m m e r s e d i n l i q u i d h e l i u m at a t e m p e r a t u r e o f 4.2 K . A n I-V F i g . 3.
c h a r a c t e r i s t i c w i t h e v i d e n c e o f a g a p is s h o w n i n A t s m a l l v o l t a g e s a v a n i s h i n g c u r r e n t is o b t a i n e d .
T h e c u r r e n t i n c r e a s e s s t r o n g l y f o r V > 10 m V a n d b e h a v e s l i n e a r l y f o r l a r g e v o l t a g e s ( V > 30 m V ) .
F r o m this measure-
m e n t a l o w e r l i m i t f o r t h e g a p o f A ^ 10 m e V (2A/kT
^
2.4)
F o r a f u r t h e r a n a l y s i s we c o m p a r e
the
c
m a y be d e d u c e d .
theoretically expected characteristic / = P^N^N^ReiKeV)
2
-
A 211/2) :
(1)
20
60
40 VOLTAGE
(mV!
Fig. 3. Current-voltage characteristic of a tungsten tip on YBa2Cu30v: experiment (filled circles); theory with one gap (dotted curve) and two gaps (solid curve). The dashed line represents the linear I-V characteristic, typical, i.e., for a normal metal without any energy gap.
spectively, were p r e p a r e d b y m i x i n g a p p r o p r i a t e a m o u n t s of T 1 0 , B a ( N 0 ) , C a O , a n d C u O . P r e s s e d p e l l e t s , u s u a l l y 13 2
3
3
2
m m i n d i a m e t e r a n d 10 m m t h i c k , w e r e p l a c e d , t o g e t h e r w i t h a gold boat containing a small a m o u n t of T 1 0 , into a n 2
3
a l u m i n u m oxide crucible covered w i t h a tight l i d .
Under
these c o n d i t i o n s there was a s a t u r a t e d T 1 0 v a p o r d u r i n g t h e 2
a n n e a l i n g p r o c e d u r e ; t h u s T l loss d u e t o t h e h i g h v o l a t i l i t y o f t h a l l i u m oxides was m i n i m i z e d or avoided.
T h e samples
were heated at a rate of 200°C/h u p to 800°C a n d h e l d at this t e m p e r a t u r e for 8 h , cooled d o w n to 600°C w i t h i n 2 h , a n d then taken out of the furnace.
3 2
T h e sintered m a t e r i a l was
r e g r o u n d a n d p r e s s e d a g a i n i n t o p e l l e t s (10 t o n s / c m )
2-3
2
m m thick. T h e second heat t r e a t m e n t was different for the three phases.
T h e s u p e r c o n d u c t i n g , t e t r a g o n a l 2201 (t-2201)
phase was obtained i f pellets w i t h the appropriate stoichio m e t r y were fired a t 850° C i n a i r for h a l f a n h o u r a n d t h e n quenched
to liquid-nitrogen temperature.
Annealing in
flowing oxygen at 800° C a n d cooling i n t h e furnace t o r o o m temperature lead to the orthorhombic (normally conducting) 2201 (O-2201) phase. T h e (superconducting)
2212 phase was o b t a i n e d b y a n -
nealing a sample of adequate stoichiometry at 820°C i n f l o w i n g o x y g e n for 30 m i n , f u r n a c e c o o l i n g to 6 0 0 ° C , a n d quenching to r o o m temperature after 1 h . E v e n i f the stoic h i o m e t r y of t h e o r i g i n a l m i x e d powders has been 2223, t h e 2212 p h a s e w a s f o r m e d u n d e r t h e s e c o n d i t i o n s , a n d a c a l c i u m - r i c h C a - T l - C u - 0 ( C a T l C u ) phase with previously u n k n o w n s t r u c t u r e , a n d several other phases, were also f o u n d . A detailed analysis of the C a T l C u phase is i n progress.
As a
result of far-infrared reflection measurements, i t was essent i a l t o h a v e t h e s a m e p h a s e a t t h e s u r f a c e as i n t h e b u l k material.
Therefore during the second annealing procedure
we p l a c e d t h e p e l l e t s i n t o a c l o s e d b a g ( f o r m e d b y a g o l d f o i l ) Fig. 4. Current-voltage characteristic of Y B a C u 0 7 Josephson break junction under microwave irradiation (with the lower curve shifted); numbers, nth harmonics of the microwave frequency (9.5 GHz) corresponding to Josephson frequencies.
t h a t also c o n t a i n e d some T 1 0 .
w e r e a l s o o b s e r v e d ( F i g . 4).
a n n e a l i n g a 2223 s a m p l e i n a i r a t 8 4 0 ° C for 5 m i n , f u r n a c e
2
3
2
3
T h e n we o b t a i n e d samples
w i t h a w e l l - c o n d u c t i n g surface a n d w i t h the same composit i o n as t h e b u l k m a t e r i a l .
T h u s contact problems with dc
c o n d u c t i v i t y m e a s u r e m e n t s were also avoided. T h e 2223 phase, w i t h t h e h i g h e s t T , was o b t a i n e d b y c
existence
of point-contact
T h i s suggests t h e a d d i t i o n a l Josephson
junctions
because
p o i n t contacts generally show steps at s u b h a r m o n i c s of the microwave frequency. samples show
T h u s we have demonstrated that our
characteristic superconducting
properties.
W e n o t e t h a t o u r r e s u l t s agree w i t h p u b l i s h e d r e s u l t s o b t a i n e d b y use of b r e a k j u n c t i o n s a n d also of p o i n t c o n t a c t s
E.
3 0
2 8
a n d film break j u n c t i o n s
andmicrobridgelike junctions.
Characterization of (Nonconducting) Y B a C u 0 2
2 9
3 1
cooling to 600°C, h o l d i n g i t 90 m i n , a n d t h e n q u e n c h i n g it to room temperature.
N o w only the surface region of the p e l -
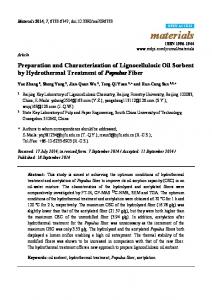
lets c o n t a i n e d C u O , C a T l C u , a n d a n u n i d e n t i f i e d phase. A f t e r the material of the surface region was removed, the xr a y p o w d e r d i f f r a c t i o n d i a g r a m [ F i g . 6(d)] o f t h e b u l k m a t e rial showed almost single-phase T l 2 B a 2 C a C u O i , w i t h a n 2
3
0
a d m i x t u r e of a s m a l l a m o u n t of t h e 2212 phase (arrows).
5
A n x - r a y p o w d e r d i f f r a c t i o n p a t t e r n i s s h o w n i n F i g . 5; o n l y for t h e m a i n peaks have we i n d i c a t e d t h e c o r r e s p o n d i n g indices.
Y,BaCu0
F r o m a n analysis of t h e p a t t e r n we f o u n d , for the
o r t h o r h o m b i c u n i t c e l l ( s p a c e g r o u p Pbnm),
the lattice con-
s t a n t s a = 7.132 A, b = 12.181 A, a n d c = 5.658 A f o r t h e insulating Y B a C u O s . 2
T h e v a l u e s a r e t h e s a m e as t h o s e i n
c
a n n e a l i n g process.
(J) Z
§
ixl
i
°
t h e 2221 p h a s e ( F i g . 8) b y t h e e x p r e s s i o n a(T) + ACT, w h e r e p
— 50 jificm, a
1 fxQcm K
-
= (p + 0
1
a T
^'
1
, a n d Aa is a n
a d d i t i o n a l c o n d u c t i v i t y t h a t d e s c r i b e s t h e d e v i a t i o n o f the
c
curve from a linear curve.
p(T)
iiiJL ®
0
W e find that the additional
c o n d u c t i v i t y c a n be d e s c r i b e d b y t w o - d i m e n s i o n a l s u p e r c o n ducting fluctuations, (~3
3 6
- T )~\
Aa = e (16hrj)- T (T 2
l
c
c
with v
A) b e i n g a c h a r a c t e r i s t i c t h i c k n e s s o f t h e t w o - d i m e n -
s i o n a l s y s t e m ; a c a l c u l a t e d c u r v e agrees w e l l ( w i t h i n 1% 2223
i
accuracy)
w i t h the experimental curve.
t h r e e - d i m e n s i o n a l f l u c t u a t i o n s , w i t h Aa -
CD
s3
(T — T ) ~ c
1 / 2
A d e f i n i t i o n by e [32fc£(0)]~ 7V 2
1
/2
, d o e s n o t d e l i v e r a r e a s o n a b l e d e s c r i p t i o n , be-
c a u s e t h e n w e f i n d a n u n r e a l i s t i c c o h e r e n c e l e n g t h £(0) & 0.4
A.
s i JtJjUL 20
10 0
AO
30
50
(DEGREE)
3 7
Fig. 6. X-ray powder diagrams for the homologous series T l B a Ca„Cu 0 (n = 0,1, 2). 2
n + I
U s i n g a S Q U I D m a g n e t o m e t e r , we c a r r i e d o u t static magnetic susceptibility measurements. B u l k samples (with t y p i c a l d i m e n s i o n s of 2 m m X 2 m m X 2 m m ) were cut from p e l l e t s , a n d m a g n e t i c s h i e l d i n g a n d t h e M e i s s n e r e f f e c t were measured i n a procedure i l l u s t r a t e d i n F i g . 9; f i r s t the samples were cooled i n zero m a g n e t i c f i e l d d o w n to ~ 5 K A f t e r a m a g n e t i c f i e l d (3 m T ) w a s a p p l i e d , a d i a m a g n e t i c
2
2 n + 6
W e d i d n o t s u c c e e d i n p r e p a r i n g a 2223 s a m p l e w i t h h i g h l y c o n d u c t i n g s u r f a c e s , i.e., w i t h o u t f o r e i g n p h a s e s i n t h e s u r -
m a g n e t i z a t i o n a p p e a r e d as a r e s u l t o f s u p e r c o n d u c t i n g s h i e l d i n g c u r r e n t s . T h e e x p e r i m e n t a l c u r v e s ( F i g . 9) s ho w s o m e i n t e r e s t i n g f e a t u r e s . W h e n t h e s a m p l e s a r e h e a t e d the s h i e l d i n g s i g n a l s h o w s a s t e p f o r t h e 2212 a n d 2 2 2 3 phases b u t n o t f o r t h e t - 2 2 0 1 p h a s e . T h i s s t e p c a n be e x p l a i n e d b y
face a r e a . G. Characterization of T l B a C a C u + i 0 + 6 W e p e r f o r m e d c o m p l e t e s t r u c t u r e a n a l y s e s f o r t h e t w o 2201 2
2
n
n
2 n
p h a s e s a n d t h e 2212 a n d 2 2 2 3 p h a s e s . T h e x-ray diffract i o n d i a g r a m s f o r t h e d i f f e r e n t p h a s e s ( F i g . 6) i n d i c a t e t h a t 3 3
Table 1.
the deletion of s h i e l d i n g currents t h r o u g h J o s e p h s o n j u n c t i o n s , as w a s p o i n t e d o u t i n R e f . 38. F o r t h e t - 2 2 0 1 p h a s e we o b t a i n e d the h i g h value of ~ 9 3 % M e i s s n e r signal i n c o m p a r i s o n w i t h t h e l o w - t e m p e r a t u r e s h i e l d i n g s i g n a l , w h e r e a s 17%
Crystallographic Data for T l B a C a C u i 0 2 + 6 Phases 2
2
D
II+
n
Phase O-2201 Space group a (A) b(A)
c(A) Cell volume (A*) Formula units per cell
Amaa or A2aa 5.4474 (5) 5.4948 (5) 23.1795 (17) 693.817 4
t-2201
2212
2223
14/mmm 3.8656 (3)
14/mmm 3.8565 (4)
14/mmm 3.8496 (4)
23.2247 (18) 347.043 2
29.326 (3) 426.154 2
35.638 (4) 528.134 2
m e n t is n o t y e t clear.
-
W e note t h a t t h e 2212 phase sample
[ F i g . 9(b)] a n d t h e 2223 s a m p l e [ F i g . 9(c)] w e r e i d e n t i c a l w i t h
8
samples used for far-infrared studies.
ZJ -Q
3
6
t-2201
LU O
0
V °
I"
0
2
n
n + 1
0 „ 2
+ 6
[n = 0 , 1 , 2)
T h e light was focused w i t h a c y l i n d r i c a l lens onto a spot of a p p r o x i m a t e l y 0.5 X 4 m m o n t h e s a m p l e . R a m a n - s c a t t e r e d
.4"
O
l
2
F o r e x c i t a t i o n o f R a m a n e m i s s i o n we used a n a r g o n - i o n laser ( p o w e r 1 0 0 m W ) o p e r a t i n g a t 488.0 o r 514.5 n m ; p l a s m a l i n e s w e r e s u p p r e s s e d w i t h a p r i s m m o n o c h r o m a t o r as t h e f i l t e r .
6
V2201
X
Raman Study of the T l B a C a C u
Series
^ A
O
CO o LU cn
H.
y
o°°
100
200
light was a n a l y z e d b y use o f a d o u b l e - g r a t i n g m o n o c h r o m a tor, a p h o t o m u l t i p l i e r , a n d standard pulse-counting techniques. T h e spectral bandpass was 5 c m , a n d the signal
300
- 1
T (K) fte. 7. Resistance of Tl2Ba2Cu06 in the orthorhomic (o) phase and H» the tetragonal (t) phase (T « 54 K ) . c
i n t e g r a t i o n t i m e p e r i n v e r s e c e n t i m e t e r w a s ~ 3 0 sec. F o r a first survey we performed experiments w i t h samples from b u l k - f r a c t u r e surfaces a n d f r o m u n t r e a t e d surfaces at r o o m t e m p e r a t u r e . F i g u r e 10 s h o w s R a m a n s p e c t r a f o r t h e f o u r phases. C o m m o n t o a l l phases are t w o resonances, near 490 a n d 600 c m " . 1
T h e 2212 phase shows another strong resonance near 530 c m ; t h i s p e a k i s m o s t l i k e l y a l s o p r e s e n t i n t h e 2223 p h a s e . A w e a k r e s o n a n c e a t 6 4 0 c m " f o r t h e 2223 p h a s e is p r o b a b l y due to nonreacted C u O . T h e r e are f u r t h e r weaker resonances i n t h e R a m a n spectra o f a l l phases a t smaller frequencies, w h i c h we d i d n o t s t u d y further. - 1
1
3 9
0
100 T
8.
Resistance
200 (K)
of Tl Ba2CaCu208 2
W e suggest t h a t t h e t w o p r o m i n e n t p e a k s c o m m o n t o a l l p h a s e s ( F i g . 10) c a n b e a t t r i b u t e d t o C u - 0 v i b r a t i o n s . T h e a d d i t i o n a l strong m o d e for t h e 2212 phase m a y be correlated with the calcium plane. Instead of oxygen octahedra i n the 2201 p h a s e , t h e o x y g e n a t o m s h a v e a p y r a m i d a l a r r a n g e m e n t i n t h e 2212 phase. T h e r e f o r e a d d i t i o n a l R a m a n - a c t i v e p h o -
(T
c
«
105.5
K ) and
®
T l B a 2 C a C u 3 0 i o ( T ^ 110.4 K ) . 2
2
c
Table 2. Characteristic Temperatures for T l B a C a C u i 0 2 n + 6 Compounds 2
Phase 2201 2212 2223
2
T (K) C
64 105.5 110.4
il
-0.5 -
1
72 110 115
T
cm
(K)
70 107 113
t-2201-
J
II+
T'conset (K)
• t
A T (K) C
4 2 3
® •
-0.5
2212 •7
o r t h e 2212 phase a n d 3 2 % for t h e 2223 phase were f o u n d . T h i s indicates t h a t t h e t-2201 phase sample was h i g h l y h o f
mogeneous a n d t h a t shielding currents flow nearly u n r e strained between different grains. However, the relatively large t r a n s i t i o n w i d t h o f t h e e l e c t r i c a l r e s i s t a n c e t o g e t h e r w i t h t h e (not p a r t i c u l a r l y steep) slope of t h e m a g n e t i z a t i o n curve points to t h e existence of different grains w i t h different T values. T h i s m a y be d u e t o s p a t i a l v a r i a t i o n of t h e oxygen or t h a l l i u m portions of the sample caused b y the final heat t r e a t m e n t i n air. S i m i l a r l y , t h e M e i s s n e r s i g n a l of t h e
(C)
2223
-05
c
2223 p h a s e [ F i g . 9(c)] a p p e a r s t o i n d i c a t e a m u l t i p h a s e n a ture o f the sample, too. I n a d d i t i o n t o a broad transition, coinciding w i t h the transition of the electrical resistance, a step near 65 K w a s observed, w i t h a n e n h a n c e m e n t o f t h e diamagnetic signal b y 20%. T h e reason for this enhance-
t
• 50
100 T (K)
150
Fig. 9. Dc susceptibility of the superconducting T l B a C a C u i 0 + 6 (n = 0,1, 2) phases at an applied field of 3 mT; Meissner signals and shielding signals after zero field cooling; data normalized to the lowtemperature shielding signals. 2
2
n
n+
2n
...
,
well-defined way.
O-2201
one
\.
-
closed
O p t i c a l access was t h r o u g h two windows;
the inner chamber
tightly against a vacuum
c h a m b e r , a n d one closed the v a c u u m c h a m b e r against air. T h e f a r - i n f r a r e d r a d i a t i o n h a d to cross the two twice.
frequencies a n d Z n S e a n d K B r at large frequencies.
t-2201
\
of t h e s a m p l e , at f i x e d t e m p e r a t u r e , against a p l a n e m i r r o r a n d m e a s u r e m e n t of the s p e c t r a l i n t e n s i t y w i t h the sample
\
as t h e r e f l e c t o r a n d w i t h t h e m i r r o r as t h e r e f l e c t o r ; f r o m the
2212
ratio of the reflected i n t e n s i t i e s , the r e f l e c t i v i t y of the sample was d e t e r m i n e d .
Vv .
20
0
v
o0 ) 1l
A s the reference m i r r o r we u s e d either
a g o l d - c o a t e d glass m i r r o r or a b u l k - m o l y b d e n u m m i r r o r . A c o m p a r i s o n showed t h a t the reflectivities of the two mirrors w e r e e q u a l w i t h i n a n e r r o r o f l e s s t h a n 1% ( m e a s u r e d
2223
t w e e n 20 a n d 6 0 0 c m
- 1
).
be-
F o r d e t e r m i n a t i o n of the sample
reflectivity a correction was m a d e b y c a l c u l a t i n g the mirror reflectivities f r o m dc c o n d u c t i v i t i e s of the m i r r o r materials;
.
.
.
200
400
600
RAMAN
Fig. 10. phases.
We
u s e d a m e c h a n i c a l a r r a n g e m e n t t h a t p e r m i t t e d a n exchange
\«20 0
windows
A s w i n d o w m a t e r i a l s we chose polyethylene at small
3H.'F
T
v
t h e c o r r e c t i o n w a s s m a l l e r t h a n 1% (at f r e q u e n c i e s u p t o 600
1
1
1000
800
cm
crn )
Raman signals for the T l B a C a C u i 0 2 + 6 (n = 0, 1, 2) 2
2
- 1
).
U s i n g a s a m p l e - m i r r o r e x c h a n g e a r r a n g e m e n t , we
were able to e l i m i n a t e the s t r u c t u r e seen i n the spectral
1
n
n +
n
intensities t h a t was due to interferences a n d peaks i n the polyethylene windows.
absorption
A d d i t i o n a l l y , we chose
a p o l y e t h y l e n e m o d i f i c a t i o n t h a t was r e l a t i v e l y w e a k l y a°" s o r b i n g i n t h e range of 400 to 700 c m " .
T h e polyethylene
1
n o n modes can occur. man spectra
A comparison with YBa2Cus07 R a -
shows that the strong resonances i n the t h a l l i -
4 0
u m compounds appear at noticeably larger frequencies; the largest, strongly
Raman-active
f o u n d near 500 c m " . 1
mode
for
YBa2Cu30
7
is
A s a result, the R a m a n spectra show
t h a t the p h o n o n d e n s i t y of states extends i n the t h a l l i u m c o m p o u n d s at least u p to a f r e q u e n c y of 600 c m
- 1
.
A further
d i s c u s s i o n o f t h e p h o n o n m o d e s is g i v e n i n S u b s e c t i o n 5 . B below.
windows h a d a thickness of ~ 1 m m . arrangement showed
Our sample-mirror
good r e p r o d u c i b i l i t y for reflectivity
values at various temperatures.
W e e s t i m a t e t h a t the abso-
lute r e f l e c t i v i t y values were accurate w i t h i n few
percent.
T h i s a c c u r a c y is s u f f i c i e n t f o r a f i r s t s u r v e y ; i t n e e d s , h o w e v e r , t o be i n c r e a s e d .
W e d i d not p o l i s h the s a m p l e surfaces i n
o r d e r to a v o i d effects c a u s e d b y p o l i s h i n g m a t e r i a l s .
B.
Methods of Analysis
F o r a first a n a l y s i s we describe t h e c e r a m i c m a t e r i a l w i t h a
3. T E C H N I Q U E O F F A R - I N F R A R E D REFLECTIVITY M E A S U R E M E N T A N D METHODS OF ANALYSIS
homogeneous m e d i u m theory, using the complex
a =