Jul 26, 2018 - outbreaks in the regions with a high rate of skin cancer due to extensive UV radiation. ... over the danger of influenza A virus subtypes H5N1 (avian flu) and more recently .... there are increases of ozone hole deterioration to cause extensive UV ... pheric ozone layer depleted by chlorofluoro carbons (CFCs), ...
J. Biomedical Science and Engineering, 2018, Vol. 11, (No. 7), pp: 182-206
http://www.scirp.org/journal/jbise
Prevention of Avian Influenza Virus by Ultraviolet Radiation and Prediction of Outbreak by Satellite Parameters Tai-Jin Kim University of Suwon, Hwaseong, South Korea Correspondence to: Tai-Jin Kim, Keywords: Prevention, Avian Influenza Virus, Ultraviolet, Outbreak, Satellite Received: May 24, 2018 Accepted: July 23, 2018 Published: July 26, 2018 Copyright © 2018 by author and Scientific Research Publishing Inc. This work is licensed under the Creative Commons Attribution International License (CC BY 4.0). http://creativecommons.org/licenses/by/4.0/ Open Access
ABSTRACT The present study showed that avian influenza virus (AIV) occurred in the regions with rice and wheat productions under low ultraviolet (UV) radiation while there were negligible AIV outbreaks in the regions with a high rate of skin cancer due to extensive UV radiation. It is therefore proposed that having artificial UV radiation with poultry farmhouses is a simple solution to suppress AIV outbreaks. AIV outbreaks can be predicted a few months in advance by remote sensing satellite parameters such as Cosmos (minimum sunspot number, 10.7 cm solar flux, high UV radiation), Poles (CO2, O3 hole deterioration, hydroxyl layer temperature, ice-melting, chlorophyll or algae, krill, penguin, guillemot), and Continents (migratory birds, desert dust, low UV radiation, waters, fish, rice and wheat, climate). Since there was an abrupt 2% rise of global CO2 emissions in 2017, while the minimum sunspot number is simultaneously reached at the end of 2018, there can be an extensive UV radiation for mutant AIV in the Poles to have the highest degree of damage by AIV in regions such as U.S., East Asia, China, South Korea, Japan, west Africa, and Europe from November of 2018 till April of 2019.
1. INTRODUCTION Avian influenza viruses (AIV) cause widespread morbidity and mortality in a broad range of hosts such as birds, swine, companion animals, marine animals, and humans. In the early 21st century, anxiety over the danger of influenza A virus subtypes H5N1 (avian flu) and more recently H1N1 (swine flu) has revived memories of New Zealand’s worst disease outbreak, the lethal influenza pandemic that struck between October and December 1918 (http://nzhistory.govt.nz/culture/influenza-pandemic-1918). One third of the world population died (as many as 20 to 50 million) while there was half a million deaths only in the https://doi.org/10.4236/jbise.2018.117015
182
J. Biomedical Science and Engineering
United States, as summarized by The American Association for Clinical Chemistry in 2016. Influenza A viruses are roughly spherical (80 - 120 nm) with glycoprotein spikes on the surface and genome consisting of eight RNA fragments that encode 10 proteins. The haemagglutinin (HA), neuraminidase (NA) and matrix (M2) proteins are embedded in the envelope lipid bilayer derived from the host cell. Since there are currently 18 HA and 11 NA subtypes, 198 combinations with 4 strains of A, B, C and D [1] are thus available to suggest that AIV is hard to block for their cell-cell spread in advance whatsoever vaccination is developed. AIV are classified into two groups based on their overall pathogenicity to domestic chickens: low pathogenic avian influenza (LPAI) causes mild disease in poultry such as mucosal infection and a decrease in eggs; highly pathogenic avian influenza (HPAI) causes severe mortality often with rapid spread resulting in 100% flock mortality within 48 hours of exposure [2]. LPAI viruses occur in all HA and NA subtypes, but HPAI viruses have been restricted to H5 and H7 subtypes. One of the molecular causes for transition from LPAI to HPAI is the addition of amino acids at the HA cleavage site, which allows the virus to attack many different types of cells, causing systematic and often lethal infection within the host’s body [3]. Since viruses should penetrate the host cells in order to cause infection, the prevention of viral entry, other than culling birds and poultry, is an attractive anti-viral strategy to minimize the chance of virus evolution and inactivate the viral viability at an early stage. There were HPAI H5N1 outbreaks in 1996 in Guangdong of China and nearby Hong Kong in 1997. There was the thinnest ozone layer in the Poles to provide the highest ultraviolet (UV) radiation in 1996. Such a high UV exposure during springtime (Sep.-Nov.) of Antarctica might mutate AIV in form of LPAI H5N1 and move migratory birds to the Continent to spread the mutated HPAI H5N1 in favorable environments. AIV can remain infectious in water for months and virus-contaminated surface water is considered to be a source of infection within wild waterfowl populations. The duration of AIV persistence was determined to be the longest in filtered surface water with low temperature ( Rocky Mountains > Far West > Northeast, which implies that AIV was frequent in areas associated with waters and cropland. As for states of AIV outbreaks are in the order of MN > IA > TX > IL > NE > KS > IN > MO > SD > OH > ND > KY > WI > CA > MI > GA > TN > VA, it is better to examine the present means of artificial UV radiation to measure and control AIV outbreaks in the areas of Plains (1012), especially in MN (250) and IA (196). Once effective, such prevention can be stepwise expanded to TX (162) of Southwest (232) and IL (160) of Great Lakes (501) to control AIV outbreaks in US states (2699). U.S. rice production is grown in three major states; Arkansas, California, and Louisiana. There are many lakes in Iowa, Minnesota, and Wisconsin that have had outbreaks of HPAI. Since the beginning of 2015, HPAI has resulted in the loss of more than thirty million layers and pullets https://doi.org/10.4236/jbise.2018.117015
194
J. Biomedical Science and Engineering
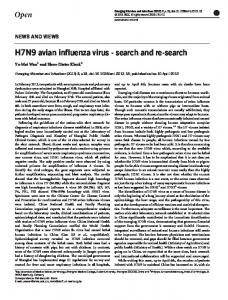
Figure 9. (a) Rice and (b) wheat producing areas of the world, 2010 (Food and Agriculture Organization of the United Nations) along with (c); the superimposed map with rice and wheat together while (d); the map of HPAI H5N1 outbreak [22] is compared for its similarity with that of (c). https://doi.org/10.4236/jbise.2018.117015
195
J. Biomedical Science and Engineering
Figure 10. Modeled number of AIV cases in wild birds by state, 2000-2008 [29]. and 1.5 million turkeys in Iowa from infection or depopulation due to exposure to the virus. Layer operations affected by HPAI across the U.S. are in Iowa, Minnesota, Nebraska, Wisconsin, and South Dakota, and represent a significant percentage of pre-outbreak inventories, particularly for Iowa (52%) and Minnesota (nearly 40%). Turkey operations in Arkansas, California, Iowa, Minnesota, Missouri, North Dakota, South Dakota, and Wisconsin have seen losses. The most significant losses have been in Iowa, South Dakota, and Minnesota who have lost 15%, 12% and 10% of their pre-outbreak inventories, respectively (http://www.poultrymed.com/Infectious-Disease-2015). The map of AIV number (Figure 10) was close to that of cropland with waters in the U.S. Since migratory birds come to cropland to feed on crops (rice, wheat, corn), they can spread LPAI in cropland after contact with wild domestic birds which eventually mutates as HPAI to kill the poultry in the farmhouse. Therefore, HPAI outbreaks (Figure 9(d)) are proportional to percentage cropland (Figure 9(c)).
3. PREDICTION OF AIV OUTBREAK BY SATELLITE PARAMETERS The timing and the location of AIV outbreak is predicted by satellite and ground station data such as desert dusts (Antarctic, Arctic and Continental deserts), climate (temperature, relative humidity, precipitation, wind), migratory birds (species, latency time, flyways), ozone hole size (UV radiation), average daily sunspot number (10.7 cm solar flux), water (river, lake, reservoir, mudflat, pond), fish (mudfish, catfish, lungfish, bullfrog), and crops (rice and wheat). Table 3 shows the outbreak of AIV with various strain, year, country as a function of year of minimal average daily sunspot area. The relationship between the year of AIV outbreak was strongly correlated (R2 = 0.9967) with the year of minimal average daily sunspot area, as shown in Figure 11. The location of AIV outbreak is determined by parameters such as crops, migratory birds, desert dust, climate, and low UV radiation. The increases of global atmospheric CO2 or temperature induce the increase of UV radiation due to the decrease of ozone holes in the Poles. Such a climate change provides the strong UV radiation to cause the mutant AIV in the Poles for the AIV outbreaks in the Continents. Since the global carbon dioxide emissions increase continuously in the Earth, the control parameter is then the minimal sunspot number or the 10.7 cm solar flux for the onset of mutant AIV in the Poles to be https://doi.org/10.4236/jbise.2018.117015
196
J. Biomedical Science and Engineering
transmitted via migratory birds for HPAI outbreaks in the poultry and humans. The minimum sunspot number (minimal average daily sunspot area) or the 10.7 cm solar flux is the indicator of AIV outbreaks in the Continents a few months ahead of migratory birds with mutant AIV in the Poles. Specifically, satellite data showing the maximal ozone depletion in the Arctic and the Antarctic induce the extensive UV radiation causing the onset of mutant AIV in the North and South Poles. Early warning of Continental AIV outbreaks at the poultry farmhouses and humans can be based on satellite data. The ice-melting in Antarctica induces the low salinity with less algal and krill in the Antarctic Peninsula, which is a preferred environment to infect penguins with AIV. Penguins are a group of aquatic and flightless bird. Since krill feeding algae is the major prey of penguin, lack of krill immunity to AIV via infected virus, bacteria, and algae can cause LPAIV in penguins to be transmitted by migratory birds for ultimate spreading LPAIV in Continents. Low pathogenic avian influenza (LPAI) viruses are naturally occurring in wild birds such as ducks, geese, swans, and gulls. These viruses generally do not cause illness in wild birds. However, when spread to poultry they can be highly pathogenic avian influenza (HPAI) and cause illness and death in commercial farms [23]. It is therefore important to predict the outbreak of AIV in Continents by satellite observation of ice-melting in Antarctica, especially in the Antarctic Peninsula. Table 4 implies the degree of damage by AIV outbreak in the Continents with satellite parameters of independent variables (CO2, minimum sunspot number), dependent variables (O3, UV, temperature, ice-melting, algae, krill). Table 3. Year of minimal average daily sunspot area with the year of outbreak of AIV during 1878 to 2016. Year of minimal average daily sunspot area1) 1878 1890 1902 1914 1924 1934 1945 1955 1966 1976 1984 1995 2006 2016
Outbreak of AIV2) (Strain, Year, Country) 1878, Italy HPAI, 1894 HPAI, 1901 HPAI H1N1, 1918, Spain LPAI H6N2, 1924-1925, USA
HPAI H2N2, 1957, Hong Kong/H5N3, 1961, South Africa/H5N1, 1959, Scotland HPAI H5N9, 1966, Ontario/H3N2, 1968, Hong Kong HPAI H7N7, 1976, Australia/ H1N1, 1979, Europe/Germany and England HPAI H5N2, 1983-1984, Pennsylvania/ H5N8, 1983, Ireland/H7N3, 1985, Australia HPAI H5N1, China, 1994, 1996, 1997/H5N2, 1994, Mexico HPAI H7N3, 2004, Canada/H5N2, 2004, Texas and South Africa/H7N7, 2005, Korea/H5N1, 2005, China/H5N3, 2007, Canada/H5N8, 2010, East Asia, Europe, North America/HPAI H5N1, 2005, 2006, Eurasia LPAI H11N2, Antarctica, 2013/H5N5, Antarctica, 2015
Reference (Year) [31] (1878) [32] (1926) [33] (1975) [34] (2008) [35] (2017)
[36] (1955) [37] (2000) [37] (2000) [38] (2011)
[38] (2011)
Note: 1) [12]. 2) [30]. https://doi.org/10.4236/jbise.2018.117015
197
J. Biomedical Science and Engineering
Table 4. Satellite parameters of independent and dependent variables for various degrees of damage by AIV outbreak in the Continents. Satellite Parameter (; increase, ; decrease)
AI Virus
Independent Degree of Damage
Degree of AIV CO2 Mutation
Minimum Sunspot Number
Dependent O3 UV
Temperature Ice-Melting Algae Krill
1) High (●)
●
●
●
●
●
●
●
●
●
2) Middle (⦾)
⦾
⦾
⦾
⦾
⦾
⦾
⦾
⦾
⦾
3) Low (○)
○
○
○
○
○
○
○
○
○
Figure 11. Relation between the year of AIV outbreak and the year of minimal average daily sunspot area (minimum sunspot number) during 1878 to 2016 with high linearity (R 2 = 0.9967). The highest degree of damage by AIV outbreak in the Continents can be caused by the highest degree of AIV mutation when CO2 , minimum sunspot number or 10.7 cm solar flux , O3 , UV , temperature , ice-melting , algae , and krill . Since all of these satellite parameters are correlated to each other, the degrees of AIV outbreak and mutation with real time remote sensings of these satellite parameters can be predicted a few months ahead due to duration of migratory birds flights with mutant AIV from Poles prior to AIV outbreak in the Continents for proper preparedness of AIV damage to poultry farmhouses and humans. Sunspots change through an average cycle of 11 years with 14 months standard deviation. Ultraviolet radiation increases dramatically during high sunspot activity. The converse is true during minimum sunspot activity (https://www.weather.gov/fsd/sunspots). Sunspot dynamics were reflected in human phyhttps://doi.org/10.4236/jbise.2018.117015
198
J. Biomedical Science and Engineering
siology and pathophysiology [39]. The 10.7 cm solar flux is the disc-integrated emission from the sun at the radio wavelength of 10.7 cm (2800 MHz) while 10.7 cm solar flux is highly correlated (r2 = 0.990) with the International Sunspot Number [12]. When 10.7 cm flux was minimal in Antarctica with high UV-B radiation in 1996, there were AIV outbreaks at Continents in 1996. 10.7 cm solar flux is a measure of the activity of the sun with values 186.45 in 1990, 82.66 in 1994, 74.20 in 1995, 71.06 in 1996, 75.75 in 1997, 117.03 in 1998, 157.87 in 1999, as shown in Figure 12. Since 10.7 cm solar flux showed the lowest value in 1996 in Figure 12 there were correspondingly AIV at Guangdong in China in 1996 and a spread of H5N1 worldwide in 1997. Low values of 10.7 cm solar flux in Figure 12 mean the low sunspot number with high UV radiation due to thin ozone hole size. Under high solar activity there is an extremely high UV radiation to sterilize totally all the viruses in the Poles. Only under high solar activity or low sunspot area, high UV radiation is available in Poles enough to cause the mutant virus or mutant AIV via penguins in Antarctica and guillemot (great auk, razorbill) in Arctica, which are in contact with migratory birds to spread mutant AIV throughout the Continents. The sunspot number showed the minimal value in 2009 and 2010 in Figure 4, which might have the maximal UV radiation to cause the mutant AIV strain from H5N1 such as H5N8 and H5N6. The Arctic ozone hole showed the lowest level for March 2011 (http://www.theozonehole.com/arcticozone.htm). Correspondingly, there were the outbreaks of AIV in Canada (H5N2, turkey, 2009, 2010; H1N1, turkey, 2009), in USA (H5N3, turkey, 2009; H5N2, chicken, 2010; H7N3, turkey, 2011; H7N9, chicken, turkey, goose, guinea fowl, 2010; H1N1, turkey, 2010), and in Mexico (H5N2, chicken, 2009, 2010, 2011). It can be concluded that the lowest level of the Arctic ozone hole in 2011 and minimal sunspot number in 2009 and 2010 might induce the outbreaks of AIV in the North America during 2009 to 2011. AIV was observed in Europe (Germany, UK, Austria, Croatia, Italy, Greece, Romania, Bulgaria, Ukraine, Russia), Asia (Israel, Gaza, Cyprus, Jordan, Iran, Iraq, Kuwait, Turkey, Saudi Arabia, Pakistan, Afghanistan, Kazakhstan, India, Thailand, Cambodia, Vietnam, Laos, Bangladesh, Indonesia, Malaysia, China, South Korea, Japan), and Africa (Nigeria, Ivory Coast, Burkina Faso, Togo, Ghana, Cameroon, Niger, Egypt, Sudan, Djibouti), where there are crops (rice and wheat), waters, desert dust, low UV radiation, and migratory birds. It may be possible to predict the timing and the location of the AIV outbreak via satellites and ground stations with parameters shown in Figure 13. There was an abrupt 2% rise of global CO2 emissions in 2017 [40] as well as the minimum sunspot number in 2018 (Figure 14). Outbreaks of AIV with the highest degree of damage are thus expected from November 2018 till April 2019 in North America, East Asia, China, South Korea, Japan, west Africa, and Europe.
Figure 12. Solar flux 10.7 cm Antarctica 1990-2000.
https://doi.org/10.4236/jbise.2018.117015
199
J. Biomedical Science and Engineering
Figure 13. Sequential flow diagram satellite remote sensing parameters for prediction of time and region in AIV outbreak.
Figure 14. Sunspot number prediction (2016/10) [41] for prediction of AIV outbreaks. https://doi.org/10.4236/jbise.2018.117015
200
J. Biomedical Science and Engineering
Recent AIV outbreaks in South Korea were summarized in Table 5 to show that AIV occurred when sunspot numbers were below 50, as indicated in arrows in Figure 14. It is suggested that the increase of CO2 induces a sequentially thin ozone hole, increases of air temperature in Antarctica, UV radiation, and finally mutant AIV, the latter being transmitted from Poles to Continents via migratory birds for HPAI AIV outbreaks in Continents in favorable environments. Crucially, the Second Industrial Revolution is generally dated between 1870 and 1914 (Wikipedia, 2018) while the first HPAI occurred in Italy in 1878 [32] and the 1918 pandemic Spanish flu from January 1918 to December 1920 resulted in the deaths of 50 to 100 million as one of the deadliest natural disasters in human history [34]. It is postulated that CO2 increase since the start of The Second Industrial Revolution might ultimately induce AIV outbreaks in the Continents. This is a remarkable discovery to find out the initiative relation between AIV outbreak and the climate change induced by CO2 increases. To avoid the AIV outbreaks in poultry farmhouse, the use of artificial UV radiation through multiple UV lamps are simply suggested making contact with clean indoor air and drinking water qualities via inactivation of AIV through viral DNA destruction by artificial UV light (254 nm). The 11-year cycle of solar activity with a standard deviation of about 14 months is characterized by the rise and fall in the numbers and surface area of sunspots. Increased solar activity includes increases in extreme ultraviolet and X-ray emissions from the Sun which produce dramatic effects in the Earth’s upper atmosphere. Sunspots (dark patches on the Sun where intense magnetic fields loop up through the surface from the deep interior) discovered in 1844. The 10.7 cm solar flux is the disk integrated emission from the Sun at the radio wavelength of 10.7 cm (2800 MHz). This measure of solar activity has advantages over sunspot numbers and areas in that it is completely objective and can be made under virtually all weather conditions [12]. Indicator of the level of solar activity is the flux of radio emission from the Sun at a wavelength of 10.7 cm (2.8 GHz frequency). This flux has been measured daily since 1947. It is an important indicator of solar activity because it tends to follow the changes in the solar UV radiation that influences the Earth’s upper atmosphere and ionosphere. 10.7 cm follows the sunspot number quite closely and similar prediction techniques can be used (http://solarscience.msfc.nasa.gov/predict.shtml). Decreased solar activity may decrease UV radiation enough to endure the persistence of AIV in the Poles while increased solar activity may produce extensive UV to sterilize and inactivate AIV itself. Therefore, it is expected there are negligible outbreaks of AIV during maximal peaks, as shown in 1990 and 1991, 2001, 2013 from Figure 4 and Table 3. According to Planck-Einstein relation [42], E = hf
(1)
E = hc λ
(2)
where h= Planck constant f = frequency = c/λ c = speed of light λ = wavelength of light Energy is expressed by heat (Q) as, = Q mC p ∆T
where m = mass CP = heat capacity ∆T = temperature difference Assuming the reference temperature is zero, then Q = mC pT
(3)
Combining (2) and (3), = E
hc )( mCP )(T λ ) (=
https://doi.org/10.4236/jbise.2018.117015
201
C (T λ )
(4) J. Biomedical Science and Engineering
where C (= = hc )( mCP ) constant . Increase of global CO2 emissions induce a thin ozone layer for extensive UV radiation. Equation 4 implies that energy (E) is increased as intensity of UV radiation with low wavelength (λ) (increases to have the increase of hydroxyl layer temperature (T), as shown in Figure 15. The ability to use the Hydroxyl layer to measure the temperature in the Antarctic mesosphere, makes the OH spectrometer an ideal instrument for monitoring middle-atmosphere temperatures for studies of climate change (Climate change in the mesosphere, www.antarctica.gov.au). Figure 15 is analogous to the ultraviolet distribution since temperature is increased as UV is extensive. The cyclic pattern is exactly opposite to that of the average sunspot areas. During the minimum of the sunspot area, temperature profile showed the maximum value due to extensive UV radiation, which enhances the mutation of AIV in the Poles. That is, the peak temperature period corresponds to the minimal sunspot area, the latter providing the maximal UV radiation. Satellite parameters for AIV outbreaks are summarized in Figure 16. The degree of the sunspot number can be a good indicator of AIV outbreak. There are three cases of AIV outbreak depending upon the sunspot number and the intensity of UV radiation in the Continents, as summarized in Table 6. Table 5. Recent outbreaks of AIV in South Korea. Year
2003/2004
2006/2007
2008
2010/2011 2014/2015 2016/2017
Season
Winter
Winter
Spring
Winter
Winter
Winter
Culling (million)
5.3
2.8
10.2
6.5
19.4
37.9
Strain Type
H5N1
H5N1
H5N1
H5N1
H5N8
H5N8, H5N6
Money paid to farmer (US million dollars)
87.4
33.9
181.7
80.7
238.1
257
Sunspot Number
45
5
0
5
40
10
Table 6. Prediction for the outbreak of AIV depending upon the sunspot number and the intensity of UV radiation. Case
*Intensity of
**Outbreak
Applicable Regions
lim AIV = 1
Low
Yes (1)
North America, East Asia, west Africa, Europe, South Korea, China, Japan
lim AIV = 0
Low
No (0)
North America, East Asia, west Africa, Europe, South Korea, China, Japan
No (0)
New Zealand, Australia, southern South America, southern Africa, Scandinavian countries, Denmark, northern Russia, and northern Canada
Sunspot Number
1
Sun → M in
2
Sun → M ax
3
lim AIV = 0
Sun → M in
High
Notes; 1: Sun = Sunspot number. Min = Minimal sunspot number. AIV = Outbreak of AIV. **1 = Significant outbreak of AIV. 2: Max = Maximal sunspot number. **0 = Negligible outbreak of AIV. 3: **0 = Negligible outbreak of AIV with skin cancers. *: Low or high UV radiation. https://doi.org/10.4236/jbise.2018.117015
202
J. Biomedical Science and Engineering
Figure 15. Daily average hydroxyl layer temperatures from 1990 to 2000 [43].
Figure 16. Schematic diagram of satellite parameters around the Earth associated with AIV outbreaks.
4. CONCLUSIONS The present study showed that AIV occurred in the regions with rice and wheat productions under low UV radiation while there were negligible AIV outbreaks in the regions with a high rate of skin cancer due to extensive UV radiation. It is therefore proposed that artificial UV radiation in poultry farmhouses https://doi.org/10.4236/jbise.2018.117015
203
J. Biomedical Science and Engineering
is a simple solution to suppress AIV outbreaks. Furthermore, AIV outbreaks can be predicted a few months in advance by remote sensing satellite parameters such as Cosmos (minimum sunspot number, 10.7 cm solar flux, UV radiation), Poles (CO2, O3 hole, hydroxyl layer temperature, ice-melting, chlorophyll or algae, krill, penguin, guillemot), and Continents (migratory birds, Aeolian dust, UV radiation, waters, fish, rice and wheat, climate). Since there was an abrupt 2% rise of global CO2 emissions in 2017, while the minimum sunspot number is reached at the end of 2018, there can be extensive UV radiation for mutant AIV in the Poles to have the highest degree of damage by AIV in regions such as U.S., East Asia, China, South Korea, Japan, West Africa, and Europe from November of 2018 till April of 2019. However, low damages by AIV are expected in regions such as Australia, New Zealand, Scandinavian countries, and South America due to extensive UV radiation induced by thin ozone layers from the Poles.
ACKNOWLEDGMENTS The author expresses sincere gratitude to G-LAND and the University of Suwon of South Korea for their financial support.
CONFLICTS OF INTEREST The authors declare no conflicts of interest regarding the publication of this paper.
REFERENCES 1.
Centers for Disease Control and Prevention (2017) Influenza Type A Viruses. National Center for Immunization and Respiratory Diseases (NCIRD).
2.
Al-Shekaili, T., Baylis, M. and Ganapathy, K. (2015) Molecular Detection of Infectious Bronchitis and Avian Metapneumoviruses in Oman Backyard Poultry. Research in Veterinary Science, 99, 46-52. https://doi.org/10.1016/j.rvsc.2014.12.018
3.
World Organization for Animal Health (2015).
4.
Keeler, S.P., Berghaus, R.D. and Stallknecht, D.E. (2012) Persistence of Low Pathogenic Avian Influenza Viruses in Filtered Surface Water from Waterfowl Habitats in Georgia, USA. Journal of Wildlife Diseases, 48, 999-1009. https://doi.org/10.7589/2011-11-314
5.
Sutton, et al. (2013) Inactivation of the Infectivity of Two Highly Pathogenic Avian Influenza Viruses and a Virulent Newcastle Disease Virus by Ultraviolet Radiation. Avian Pathology, 42, 566-568. https://doi.org/10.1080/03079457.2013.853867
6.
McDevitt, J.J., Rudnick, S.N. and Radonovich, L.J. (2012) Aerosol Susceptibility of Influenza Virus to UV-C Light. Applied and Environmental Microbiology, 78, 1666-1669. https://doi.org/10.1128/AEM.06960-11
7.
World Health Organization (2004) Age-Standardised Death Rates from Melanoma and Other Skin Cancers by Country (per 100,000 Inhabitants). Lokal_Profil (12 November 2009) Vector Map from BlankMap-World6.
8.
Skerratt, J.H., Davidson, A.D., Nichols, P.D. and McMeekin, T.A. (1998) Effect of UV-B on Lipid Content on Three Antarctic Marine Phytoplankton. Phytochemistry, 49, 999-1007. https://doi.org/10.1016/S0031-9422(97)01068-6
9.
Dulermo, R., Fochesato, S., Blanchard, L. and De Groot, A. (2009) Mutagenic Lesion by Pass and Two Functionally Different RecA Protein in Deinococcus desrti. Molecular Microbiology, 74, 194-208. https://doi.org/10.1111/j.1365-2958.2009.06861.x
10. Zhou, et al. (2013) Baiji Genomes Reveal Low Genetic Variability and New Insights into Secondary Aquatic Adaqtions. Nature Communications, 4, 2708. https://doi.org/10.1038/ncomms3708 11. Chen, J.Y., Zhou, L.Z., Zhou, B., Xu, R.X., Zhu, W.Z. and Xu, W.B. (2011) Seasonal Dynamics of Wintering
https://doi.org/10.4236/jbise.2018.117015
204
J. Biomedical Science and Engineering
Waterbords in Two Shallow Lakes along Yangtze River in Anhui Province. Zoological Research, 32, 540-548. 12. Hathaway, D.H. (2010) The Solar Cycle. Living Reviews in Solar Physics, 7, 1. https://doi.org/10.12942/lrsp-2010-1 13. Hurt, et al. (2016) Evidence for the Introduction, Reassortment and Persistence of Diverse Influenza A Viruses in Antarctica. Journal of Virology, 90, 9674-9682. https://doi.org/10.1128/JVI.01404-16 14. Griffin, A. (2017) Thousands of Tiny Baby Adelie Penguin Starve to Death as Changing Weather Forces Parents to Travel for Food. 15. Slezak, M. (2017) Penguin Disaster as Only Two Chicks Survive from Colony of 40,000. The Guardian. 16. Jimé nez-Espejo, et al. (2014) Saharan Aeolian Input and Effective Humidity Variations over Western Europe during the Holocene from a High Altitude Record. Chemical Geology, 374-375, 1-12. 17. Yamaguchi, N., Ichijo, T., Sakotani, A., Baba, T. and Nasu, M. (2012) Global Dispersion of Bacterial Cells on Asian Dust. Scientific Reports, 2, Article No. 525. https://doi.org/10.1038/srep00525 18. Muzaffar, S.B., Takekawa, J.Y., Prosser, D.J., Newman, S.H. and Xiao, X. (2010) Rice Production Systems and Avian Influenza: Interactions between Mixed-Farming Systems, Poultry and Wild Birds. Waterbirds, 33, 219-230. https://doi.org/10.1675/063.033.s116 19. Micheletti, M.I., et al. (2003) Sensitivity of Biologically Active UV Radiation to Stratospheric Ozone Changes: Effects of Action Spectrum Shape and Wavelength Ranges. Photochemical & Photobiological Sciences, 78, 456-461. 20. Richter, R. (2005) Mission to Chile Offers Relief to Skin Cancer Victims. Stanford News. 21. Morrisette, P.M. (1989) The Evolution of Policy Responses to Stratospheric Ozone Depletion. Natural Resources Journal, 29, 793-820. 22. Dhingra, M.S., et al. (2016) Global Mapping of Highly Pathogenic Avian Influenza H5N1 and H5Nx Clade 2. 3. 4. 4. Viruses with Sptial Cross-Validation. eLife, 5, e19571. 23. Troshichev, C. and Gabis, I. (2005) Effect of Solar UV Irradiation on Dynamics of Ozone Hole in Antarctic. Journal of Atmospheric and Solar Terrestrial Physics, 67, 93-104. https://doi.org/10.1016/j.jastp.2004.07.020 24. Alvarez-Madrigal and Perez-Peraza (2005) Analysis of the Evolution of the Antarctic Ozone Hole Size. Journal of Geophysical Research Atmosphere, 110, DO2107. 25. Bais, A.F., et al. (2015) Ozone Depletion and Climate Change: Impacts on UV Radiation. Photochemical & Photobiological Sciences, 14, 19-52. https://doi.org/10.1039/C4PP90032D 26. Ellis, et al. (2004) Investigation of Outbreaks of Highly Pathogenic H5N1 Avian Influenza in Waterfowl and Wild Birds in Hong Kong in Late 2002. Avian Pathology, 33, 492-505. https://doi.org/10.1080/03079450400003601 27. Martins, N.R.S. (2012) An Overview on Avian Influenza. Brazilian Journal of Poultry Science, 14, 71-158. https://doi.org/10.1590/S1516-635X2012000200001 28. Childs, N. (2016) Rice Outlook: December 2016. Rice Outlook No. (RCS-16L), 19 p. 29. Fuller, et al. (2010) Mapping the Risk of Avian Influenza in Wild Birds in the US. BMC Infectious Diseases, 10, 187. https://doi.org/10.1186/1471-2334-10-187 30. Lupiani, B. and Reddy, S.M. (2009) The History of Avian Influenza. Comparative Immunology, Microbiology and Infectious Disease, 32, 311-323. https://doi.org/10.1016/j.cimid.2008.01.004 31. Epizoozia, P.E. (1878) A Contagious Disease of Poultry Associated with High Mortality. Annali dell’Accademia di Agricoltura di Torino, 21, 87-126. 32. Stubbs, E.L. (1926) Fowl Pest. Journal of the American Veterinary Medical Association, 21, 561-569.
https://doi.org/10.4236/jbise.2018.117015
205
J. Biomedical Science and Engineering
33. Wilkinson, et al. (1975) 2.2 Spread of H5N1 HPAI in Asia and Beyond. Avian Influenza, Animal Production and Health Division. 34. Trilla, A., Trilla, G. and Daer, C. (2008) The 1918 “Spanish Flu” in Spain. Clinical Infectious Diseases, 47, 668-673. https://doi.org/10.1086/590567 35. Root, J.J., Shriner, S.A., Ellis, J.W., VanDalen, K.K. and Franklin, A.B. (2017) Transmission of H6N2 Wild Bird-Origin Influenza A Virus among Multiple Bird Species in a Stacked-Cage Setting. Archives of Virology, 162, 2617-2624. https://doi.org/10.1007/s00705-017-3397-y 36. Schafer, W. (1955) Vergleichende sero-immunologische Untersuchungen ü ber die Viren der Influenza und klassichen Geflü gelpest. Zeitschr Natur forschung, 10, 81-91.
37. Matrosovich, et al. (2000) Alterations of Receptor-Binding Properties of H1, H2 and H3 Avian Influenza Virus Hemagglutinins upon Introduction into Mammals. Journal of Virology, 74, 8502-8512. https://doi.org/10.1128/JVI.74.18.8502-8512.2000 38. Prosser, et al. (2011) Wild Bird Migration across the Qinghai-Tibetan Plateau: A Transmission Route for Highly Pathogenic H5N1. PLoS ONE, 6, e17622. https://doi.org/10.1371/journal.pone.0017622 39. Hrushesky, et al. (2011) Sunspot Dynamics Are Reflected in Human Physiology and Pathophysiology. Astrobiology, 11, 93-103. https://doi.org/10.1089/ast.2010.0574 40. Carbon Brief (2018) Analysis: Global CO2 Emissions Set to Rise 2% in 2017 after Three-Year “Plateau”. 41. Hathaway, D.H. (2015) The Solar Cycle. Living Reviews in Solar Physics, 12, 4. https://doi.org/10.1007/lrsp-2015-4 42. Richardson, M. (2004) College Physics. McGraw Hill, New York, 864-866. 43. Department of the Environment and Energy (2003) Climate Change in the Mesosphere. Australia’s Antarctic Program, Australian Government.
https://doi.org/10.4236/jbise.2018.117015
206
J. Biomedical Science and Engineering