ACHIEVING THE MILLENNIUM DEVELOPMENT GOALS: A MEASURE OF PROGRESS
Working Paper number 78
Degol Hailu Raquel Tsukada United Nations Development Programme (UNDP)
International
Centre for Inclusive Growth
February, 2011
Copyright© 2011 International Policy Centre for Inclusive Growth United Nations Development Programme
International Policy Centre for Inclusive Growth (IPC - IG) Poverty Practice, Bureau for Development Policy, UNDP Esplanada dos Ministérios, Bloco O, 7º andar 70052-900 Brasilia, DF - Brazil Telephone: +55 61 2105 5000 E-mail:
[email protected] URL: www.ipc-undp.org The International Policy Centre for Inclusive Growth is jointly supported by the Poverty Practice, Bureau for Development Policy, UNDP and the Government of Brazil.
Rights and Permissions All rights reserved. The text and data in this publication may be reproduced as long as the source is cited. Reproductions for commercial purposes are forbidden. The International Policy Centre for Inclusive Growth disseminates the findings of its work in progress to encourage the exchange of ideas about development issues. The papers are signed by the authors and should be cited accordingly. The findings, interpretations, and conclusions that they express are those of the authors and not necessarily those of the United Nations Development Programme or the Government of Brazil. Working Papers are available online at www.ipc-undp.org and subscriptions can be requested by email to
[email protected] Print ISSN: 1812-108X
ACHIEVING THE MILLENNIUM DEVELOPMENT GOALS: A MEASURE OF PROGRESS
Degol Hailu* and Raquel Tsukada* ABSTRACT This paper introduces a methodology that measures the effort made by countries in achieving the Millennium Development Goals (MDGs). The methodology compares the rate of progress on MDG indicators in the period before and after the adoption of the MDGs. We correct for two biases ignored in previous methodologies: non-linearity in the rate of change, and effort appreciation. By correcting for the first, we recognise that the rate of progress in MDG indicators is not linear across time. As for the second bias, we note that natural constraints hinder countries from achieving the targets as they approach their upper or lower bound limits. These two corrections allow us to identify countries that are making respectable progress on MDG acceleration, despite their likely “failure” in achieving the Goals by 2015.
1 INTRODUCTION Various MDG monitoring reports evaluate progress in terms of changes in the level of indicators before and after the adoption of the MDGs. The reports monitor how “on track” or “off track” countries are on the road to achieving the goals and targets. This paper proposes a methodology for measuring MDG achievements based on process, focusing on the countries’ rate of progress. The innovation in measuring the rate of progress is that the commitment of policymakers is measured, rather than changes in the level of indicators. These commitments may have been obscured or misinterpreted by flaws in previous measurements. It is often argued that the way in which the MDGs were constructed was unfair to several least developed countries (LDCs). Targets based on global trends tend to place at a disadvantage those countries whose indictors were at very low levels at the outset. For example, ensuring that children complete a full course of primary schooling might be unrealistic. This target might not to be met in countries where the enrolment rate was initially very low, in contrast to others that had high initial rates. This is why it is necessary to evaluate the progress of countries not only in terms of the level of indicators, but also in terms of the effort they make to accelerate progress. The rate-of-progress method evaluates countries using a “level-free” unit of measurement. Moreover, our methodology solves two measurement biases ignored in previous calculations: non-linearity and effort appreciation. We recognise that the rate of progress * United Nations Development Programme (UNDP). Comments to
[email protected] and
[email protected]. We thank Admasu Shiferaw and Shivani Nayyar for their valuable comments.
2
International Policy Centre for Inclusive Growth
in MDG indicators is not linear across time, as succinctly argued by Osorio (2008a and 2008b). In the case of the second bias, we introduce the correction proposed by Kakwani (1993) to take account of the fact that MDG targets are harder to achieve when a country’s baseline indicator is already approaching its target value. We call our methodology the “unbiased rate of progress method (URPM)”. After correcting for the above biases, this paper finds that the top-performing countries in MDG acceleration are in Sub-Saharan Africa (SSA). As regards the MDGs, most progress was made towards Goals 1, 2, 4, 6 and 8. The least progress was made towards Goals 3, 5 and 7. Goal 5, improving maternal health, and Goal 7, ensuring environmental sustainability, deserve special attention and call for more effective interventions. The paper is organised as follows: Section 2 discusses the literature on measurements of MDG progress. Section 3 introduces the URPM. Section 4 presents the data and discusses issues related to the aggregation of indicators into targets and then goals. Section 5 presents the results. Section 6 concludes.
2 THE LITERATURE MDG progress is usually reported by showing the levels of indicators at two or more points in time, and by showing trajectories towards the 2015 targets (see UN, 2010; UNDP, 2010; and various country- and region-specific MDG progress reports). Data for the various indicators are officially provided by national governments (some by international agencies), and compiled into a single database by the United Nations Statistics Division. Adjustments are often made in order to secure international comparability, and data gaps are often filled by specialised surveys (such as the Demographic Health Surveys and Multiple Indicator Cluster Surveys). Progress charts are often produced indicating the degree of compliance with the targets, categorised into high, moderate, low, or very low. MDG reports also list “track status”: already met or close to meeting (“on track”); sufficient to reach the target if trend persists; insufficient to reach the target if trend persists; no progress or deterioration (“off track”); and missing or insufficient data. MDG monitoring reports, however, are not free from criticism. The first criticism was raised by Vandemoortele (2007) and Tabatabai (2007), who argued that the goals were set as global targets and therefore that country comparisons are erroneous. Easterly (2007) added that several issues play an important role in the determination of any target. These include the benchmark year; linear versus non-linear relationships with time or per capita income; absolute changes versus percentage changes; change targets versus level targets; and positive versus negative indicators.1 Thus, where the goals were uniform on the basis of some global average, some countries may be severely penalised by the adoption of high levels (numbers) as the measure of achievement. Clemens et al. (2004: 28) warned that in “setting unrealistic goals and claiming that they can in fact be universally met, the MDGs may run the risk of creating a climate of inaccurate pessimism about both development and aid”. In fact, as the Global Monitoring Report notes, the goal of reducing poverty “was more ambitious for Africa than for other regions, because the 1990 incomes of a large part of the African population were far below the poverty line” (World Bank, 2010: 2).
Working Paper
3
It may be legitimate to turn from the analysis of global and regional achievements, or global performance, to more localised measurements of MDG performance. To reveal the true feature of progress, however, it is essential to use the right tools. Fukuda-Parr and Greenstein (2010) introduced a rate-of-change methodology for assessing MDG progress. For several indicators, they calculated the rate of change between two points in time: the period before (1990–2003 or closest data) and after the MDGs (2003–the most recent period). Using the arithmetic mean to calculate the rate of progress, the authors classified the indicators as experiencing “acceleration” or “non-acceleration” when the MDGs are adopted. Their methodology reveals that, for a large set of indicators, countries classified as LDCs and as Sub-Saharan African have experienced accelerated performance. Focusing on the achievement of targets by 2015, Leo and Barmeier (2010) analysed MDG progress in eight of the indicators for 76 countries, also using a linear benchmark trajectory. They investigate whether progress was above or below the linear growth trend necessary for each country to reach the MDG targets by 2015. Fukuda-Parr and Greenstein (2010), as well as Leo and Barmeier (2010), however, recognise that their linear method is fairly simple. Moreover, they do not take into account the effort countries make while attempting to achieve the targets by 2015. They focus solely on changes in levels of indicators.
3 THE UNBIASED RATE OF PROGRESS METHOD (URPM) In contrast to the above approach, we propose the use of changes in the rate of progress at the country level as a means of assessing MDG performance. We also seek to contribute to the literature by carefully analysing 40 indicators for 98 developing countries.
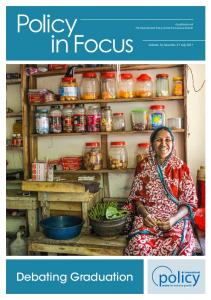
3.1 NON-LINEARITY Osorio exposes several flaws in linear projections, which overestimate the expected performance of some MDG indicators across time. He shows empirically (Osorio, 2008a: 12) that the performance indicator decreases “as the departure level [of the indicator] becomes closer to its logical upper bound” (for a positive indicator where “the more the better”). Thus, for instance, it is reasonable to assume that the performance of indicators follows an exponential trajectory—that is, a concave growth curve. On the basis of two initial actual enrolment levels, Osorio plots the linear and logarithmic trends. He shows that the logarithmic trend demonstrates that the higher the level, the harder it is to make further improvements. As Figure 1 shows, Osorio’s projections indicate that none of the three countries would reach a net school-attendance ratio of 100 per cent by 2015, as the linear projection would have us believe. The logarithmic trend predicts almost perfectly the changes in the indicator in Panama and Nicaragua. The logarithmic trend projections in El Salvador show that the forecasted values are below the observed values. The 2008 State of the World’s Children report by UNICEF also adopted a non-linear trend analysis to measure changes in under-five mortality across countries. By calculating the countries’ rate of progress as an average annual rate of reduction, the method recognises that “as lower levels of under-five mortality are reached … the same absolute reduction obviously represents a greater percentage reduction” (UNICEF, 2008: 153).
4
International Policy Centre for Inclusive Growth
FIGURE 1
Net Attendance Ratio in Primary Education: An Illustration 100 95 90 85 80 75 70
El Salvador
65
Nicaragua Panama
60 1985
1990
1995
2000
2005
2010
2015
2020
Source: Osorio (2008b).
3.2 EFFORT APPRECIATION Our methodology adjusts for the effort required at different stages of the growth curve. Natural constraints hinder countries from fully meeting the MDG targets as they approach a higher or lower level of an indicator. Investments in primary education, for instance, may yield very high returns when the initial rate of enrolment was low, but it becomes ever harder to reach all out-of-school children as enrolment rates approach universal coverage. The constraints preventing the last deciles of children from attending school may be much more challenging than those facing the deciles before them. Prennushi et al. (2002) note that “as a general rule, performances become more difficult as levels improve [and] it is generally more difficult to reduce income poverty from 10 percent to 0 than from 40 percent to 30 percent, because the target group generally becomes more difficult to reach”. In the same way, expanding access to, say, water in an area that already has 90 per cent coverage is probably more costly than expanding access from a 50 per cent coverage rate. This could simply be because of geographical barriers that impose a very high cost on supplying water to the bottom deciles.2 Accounting for the effort that countries have to make in order to improve a percentage change would correct for this bias. We use the correction proposed by Kakwani (1993), which allows us to transform an MDG indicator x into a unit-free indicator, as a function of the value of the original indicator, and the upper and the lower bounds possible: 1
1
, ,
1
,
1
,
0
1 1
5
Working Paper
where x is the indicator value, U is the upper possible bound, L is the lower bound and is a measure of effort appreciation. is arbitrarily chosen and its intuition is based on Atkinson’s (1970) measures of inequality, as will be explained below.
3.3 THE MODEL Our URPM measures the rate of change in progress on MDG indicators in two periods: P90s or before the MDGs (early 1990s to 2001), and PMDGs or after the MDGs (2001–2008, latest data available). Our expectation is an increase in the rate of progress in PMDGs, meaning that countries have made true efforts to achieve the MDGs and thus accelerated progress relative to the previous decade. We use three available data points to calculate the rate of change in a given indicator for two periods, before and after. Then we compare the trends in the pre- and post-MDGs periods. The indicators are classified into two groups: positive, or those where progress means an increase in the indicator values (such as the ratio of girls to boys in primary school); and negative, or those where progress is achieved through a decrease in the indicator level (such as the proportion of the population living in slums, or tuberculosis cases per 100,000 people). For ease of computation we transform negative indicators into positive indicators. For instance, if the objective is to lower the mortality rate of under-five children, the transformed indicator is the survival rate of under-five children, and our objective is to increase that rate. The new indicator is constructed by deducting the original indicator from its upper bound, and the new upper and lower bounds are inverted from the original indicator. We measure the average annual progress on an indicator in a time period by the rate of progress calculated from the unit-free indicators in two points in time, as in equation 2:
2
1, 2,
2,
,
,
1, 2
1
,
Where t denotes time, the rate of progress (“P” in equation 2) is a positive number.
Hence, the rates of progress for the periods before and after the adoption of the MDGs yields:
2.
2.
, ,
, ,
90
, ,
, ,
where the subscripts refer to the data point time: s for starting date, m for mid-point date, and f for the final, most up-to-date period. We compare the rate of progress after the adoption of the MDGs with the rate of progress during the earlier decade, and allow for a 5 per cent margin for statistical error. This 5 per cent
6
International Policy Centre for Inclusive Growth
margin was chosen arbitrarily, and could be set higher for more conservative results.3 Thus, a country is considered as having “accelerated” the rate of progress on a determined indicator after the MDGs if its rate of progress for that indicator is
3. a
1.05
1
0.05 .
Its progress is considered as having “slowed down” if
3. b
0.95
0 .
Finally, the country is considered as having “maintained” the rate of progress if
3. c
0.95
1.05
.
Recall that progress in the unit-free indicators depends on the degree of effort appreciation, . If is close to zero, a percentage increase in the indicator requires the same amount of effort along all the distribution—that is, a change from 10 per cent to 15 per cent requires the same effort as a change from 90 per cent to 95 per cent. The performance indicator in this case has a constant value independent of the relative location in the curve (see the dotted line in Figure 2). As we argued above, this is not realistic. Thus, greater than zero accounts for an increasing effort appreciation. As becomes greater, we recognise that a 1 per cent change in an MDG indicator closer to the upper bound is much harder to achieve than a percentage change when the initial value was closer to the lower bound.4 FIGURE 2
Rate of Progress Index under Selected Degrees of Effort Appreciation 0.030
ε=1*10^‐7 ε=0.1 ε=0.5 ε=1
0.027 0.024
Rate of Progress Index: "P"
0.021 0.018 0.015 0.012 0.009 0.006 0.003
Indicator's starting level Source: Hailu, Osorio and Tsukada (2009).
100
95
90
85
80
75
70
65
60
55
50
45
40
35
30
25
20
15
10
5
0
0.000
Working Paper
7
An improvement in the indicator at the upper bound of the distribution implies a large effort appreciation ( 1, see thickest line in Figure 2), as compared to a lower effort appreciation (for example, 0.5, thinner line). For instance, consider a country with a school enrolment rate at 40 per cent in 1992, 50 per cent in 2001 and 60 per cent in 2010, represented by x1, x2 and x3 indicators, respectively. At a first glance, the progress in this indicator seems constant over the periods before and after the MDGs commitment: a 10 per cent increase in the enrolment rate over the periods in question. In order to calculate the rate of progress accounting for effort appreciation, we have first transformed the indicators using equation 1 above. Assuming 1, upper bound 100 per cent (universal school enrolment of children of school age) and lower bound 0 per cent (no child enrolled), the transformed indicators are: 0.111, 0.151, 0.199. The rate-of-progress index (rate of progress of the indicator adjusted for effort appreciation) is larger in the second period, revealing that there was indeed accelerated progress on school enrolment after the MDG commitment: 0.006057 0.004399 . As a general result from our methods, LDCs, since they are starting from a low level in a given indicator, are expected to accelerate progress faster than higher-income countries, which are relatively closer to their upper bound limit. Our model, therefore, creates a level playing field for all countries by giving greater weight to improvements in a country that started from an already higher level of a positive indicator. This is important if we are to account for a difference in the degree of effort needed to achieve the same percentage change at different levels of the distribution. Consequently, the model recognises “a further increase must be regarded as a greater achievement than an equal increase at lower levels” (Kakwani, 1993).5
4 THE DATA In this paper we use data on MDGs from the United Nations Statistics Division.6 This is the official MDG monitoring database and contains a panel of indicators for all countries. We limit our analysis to 143 developing countries and 40 indicators, mainly because we have an unbalanced panel with several missing values across time. Data are not available for all countries for the same pairs of years, and specifically years 1990, 2001 and 2008, the ideal time-benchmarks for our analysis. To overcome this problem we use data collected in threeyear reference periods: (i) 1990–1992 represents the starting values; (ii) 2000–2002 represents the period around MDG adoption; and (iii) 2006–2008 represents the most up-to-date period. If data for more than one year within each period are available, we pick the year using the following rule: (i) the earliest year in the period; (ii) the middle (2001), or the earliest year to represent the cut-off period; (iii) the latest year for the most up-to-date period. Annex B presents the list of indicators that fulfilled the data requirement and that were therefore used in the calculations throughout this paper.
4.1 THE SAMPLE Table 1 shows the distribution of pair-wise years of observations. Our sample has 861 observations. Ninety-five observations used the pairs 1992–2002 and 2002–2006; some 71 observations used the pair 1991–2001 and 2001–2007; and just two observations in the entire sample calculated and using the pairs 1990–2002 and 2002–2008.
8
International Policy Centre for Inclusive Growth
TABLE 1
Pair-Wise Data Used to Compute the Rate of Progress 2006
2007
2008
2000
2001
2002
2000
2001
2002
2000
2001
2002
1990
154
116
1
4
340
7
205
861
4
1991
12
21
-
7
71
4
7
189
5
1992
15
5
95
4
8
5
8
6
2
Source: Authors’ calculations.
Table 2 presents summary statistics of our overall dataset, arranged by MDG goals. Column A lists the total number of observations among all indicators for which we have complete information for each Goal. Complete information means that data are available in at least three points in time, allowing an assessment of the indicator’s progress before and after the MDGs. If we had complete data for Goal 1, for instance, we could expect to have 143 x 9 observations, denoting one observation per country (143 countries) for each indicator (nine indicators for Goal 1). Column B reports the number of countries for which there are complete data for each Goal in our sample. Column C reports the number of indicators by Goals for which complete data are available. Note, however, that column A is not always equal to “B x C” because we have an unbalanced panel, wherein not all countries have complete information for each indicator. Only for Goals 3 and 4 is there satisfactory data coverage for all indicators: in our sample we have information on three of three official indicators for each of these goals. For Goal 4 we have information on at least one indicator for 98 countries, covering three of the three official indicators. Goal 3, however, has a slightly lower coverage rate in terms of countries (94 of the 143) and it covers all indicators (and subdivisions by school educational levels). Goal 2 covers only 77 of the 143 developing countries in the sample. Goal 5 is the poorest in terms of country coverage: complete data are available on just 21 countries. Goal 7 is poor in terms of indicator coverage: complete data are available for only half of the official indicators used to measure that goal. TABLE 2
Descriptive Statistics of the Sample of Complete Data, by Goals (A)
(B)
(C)
(D)
Total observations
Countries represented in the sample
Indicators represented in the sample
No. of official indicators
Goal 1
315
98
9
9
Goal 2
127
77
3
3
Goal 3
261
94
5
3
Goal 4
290
98
3
3
Goal 5
55
21
4
6
Goal 6
268
98
6
10
Goal 7
335
97
4
10
Goal 8
505
98
6
16
Note: Data sample created by the authors using the periods 1990–1992, 2000–2002, 2006-2008 as reference periods. An observation refers to one indicator for one country. Column D refers to the total number of official MDG indicators. Some indicators, however, as in Goal 3, may be split into sub-indicators by gender or other class (such as ratios of girls to boys in primary, secondary and tertiary education). See Annex A for the comprehensive list of MDG indicators.
Working Paper
9
As regards the quality of the data, caution is in order because the official data are not free from inconsistencies. The lack of data reliability for some countries and the time-sparse data collection remain a challenge for any accurate examination of the rate of progress in achieving the MDGs. In addition, the definition of variables across countries may vary for two reasons. First, the various offices responsible for collecting data in different countries may use slightly different definitions. Second, the same goal or target may denote diverse perceptions of welfare. For instance, although having access to safe drinking water within 500 meters of the homestead denotes “having access to water” for a household in the rural Sahel, it does not seem appropriate for a household living in a crowded slum in Kibera, even though the official classification for safe access to drinking water requires a water source to be no further than one kilometre from the homestead. However, we refrain from subjective value judgements in this study.
4.2 AGGREGATION Aggregation is a convenient way of transforming a multidimensional picture into a single value. In the context of the MDGs, aggregation appears in two dimensions: vertical and horizontal. Vertical aggregation in the MDGs follows a two-step process. In the first stage, indicators of a specific country are aggregated (averaged) into a single MDG target. In the second stage, the targets are aggregated (averaged) to obtain the average rate of progress for each goal.7 Thus the aggregation runs from indicators to target, then from targets to goals. Horizontal aggregation refers to combining information on a single goal (or target, or indicator) across various countries, with the aim of representing a single value for regions (or another classification, such as the LDCs, SSA, or small islands states). Most MDG monitoring reports apply horizontal aggregation (UN, 2010; Fukuda-Parr and Greenstein, 2010). Aggregation is useful but it has a series of flaws. First, goals with a greater number of targets (and indicators) may feature wider variability in the aggregated value, thus yielding less accurate results than those goals with fewer targets. This is because the aggregate measures often mask sensitive features of specific indicators and/or countries, such as outliers. Moreover, if the data are not perfectly comparable across indicators (in scale), the value generated is misleading—for instance, aggregating indicators that are measured in levels and others measured in percentage change. Second, some indicators are expected to be consistently of high-type rates of progress (such as access to cell phones), while others may be of the expected modest-rate of progress (proportion of forest area protected, for example). Aggregation would be straightforward if we had a balanced panel, wherein we had complete information on all indicators for all countries. Simple average could be used to aggregate indicators vertically into a target, and then aggregate the targets into a goal. With an unbalanced panel, aggregation may distort the results. To overcome this problem, in this paper we propose aggregating rates of progress, which are, per se, unit-free measures and thus do not suffer from such flaws. To illustrate the problem faced by unbalanced panels, suppose we have countries B, C and D, and we want to aggregate their rate of progress on Goal Delta. Goal Delta has two targets that are decomposed into five indicators. Assume two positive indicators (x11, x12) for the first target (T1), and three positive indicators (x21, x22, x23) for target 2 (T2) (Figure 3).
10
International Policy Centre for Inclusive Growth
FIGURE 3
Vertical and Horizontal Aggregation
Targets
T1
Indicators
Vertical aggregation
Goal Delta
Goal
T2
X11
X12
X21
X22
X23
Horizontal aggregation
Horizontal aggregation
If there is complete information on all the five indicators, we can build, without loss of generality, an aggregate value of the rate of progress for Goal Delta in each country as:
4.
1
∑
1∑
1
,
where P(x) is the rate of progress of the indicator, i indexes the indicator and t indexes the target. I stands for the total number of indicators per target and T the total number of targets. In the example above, equation (4.a) translates into the following vertical aggregation:
4.
1 2
11
12
2
21
22
3
The problem arises most particularly in horizontally aggregating countries for which complete information is unavailable, and the available data refer to different sets of indicators. The bias in aggregation will follow the direction of the type of indicator that appears most frequently. For example, suppose that x11 is the high type and x12 is the low rate of progress type. If, for some countries, only one or the other indicator is available to measure target one, the results will point to distinct rates of progress on this target (and reflect into the goal) for the two countries, though we know that the source of the difference is in the nature of the indicator, not exactly in the average rate of progress. This problem has implications for the overall result and for cross-country comparisons: in an unbalanced panel we are actually comparing different sets of indicators. To overcome the problem in vertical aggregation, we use the Kakwani improvement index as the “corrected” improvement in the rate of progress, instead of using the achievement level of indicators or the simple rate of change. This solves the scale bias and minimises the problem of high- or low-type progress. Thus, even in an unbalanced panel, distortions would be minimised once we vertically aggregate the performance in a unit-free measure. On the horizontal aggregation, weighted averages would control for different weights of each country on the global achievement of each goal.
Working Paper
11
5 THE RESULTS First, in a significant number of Sub-Saharan African countries, the rate of MDG progress has improved significantly. This shows that, even if we assume these countries are not on track to reaching the MDGs by 2015, they are making more progress than any of the other countries. Tables 3 and 4 rank countries on the basis of the overall share of indicators on which progress has accelerated. In this extensive list, we find that of the top 10 good performers (those in which MDG progress accelerated the most) eight of them are in Sub-Saharan Africa. Still, 13 of the 20 top performers, the majority, are in Sub-Saharan Africa. Burkina Faso ranks at the top for accelerating progress on 91.3 per cent of indicators. Angola and Central African Republic follow: there is acceleration on 90 per cent of indicators.8 Only two countries from Sub-Saharan Africa (Sudan and Mauritania) are among the bottom 20 countries where the rate of MDG progress was slow. Second, progress on the MDGs is accelerating faster in LDCs than in non-LDCs. The results also show that eight of the 10 leading best performers where the rate of MDG progress is higher are LDCs. And 13 of the top 20 best performers are also LDCs. While most of the LDCs are in Sub-Saharan Africa, Nepal and Myanmar have also improved the rate of progress in MDG acceleration. Again, in only two countries (Sudan and Mauritania) among from LDCs from the bottom 20 countries was the rate of MDG progress slow. Third, the most progress was made on Goals 1, 2, 4, 6 and 8. In more than 78 per cent of the countries in our sample, there was an acceleration in the reduction in the proportion of people living on less than US$1.25 (PPP) per day. In the case of the indicator “growth rate of GDP per person employed”, 88.7 per cent of countries for which data are available have increased the rate of progress.9 Moreover, there has been significant progress on the indicator “employmentto-population” in 60 per cent of the countries. These improvements have led to substantial progress on Goal 1 (Tables 5 and Table 6).10 On Goal 2, considerable progress has been made on school enrolment: primary completion rates have accelerated in 70 per cent of the countries. On Goal 4, more than 65 per cent of countries have accelerated progress on the reduction of under-five mortality and infant mortality, while increasing the proportion of one year-old children immunised against measles. In more than 78 per cent of the countries, progress has accelerated on combating HIV/AIDS, malaria and other diseases, thereby hastening progress on Goal 6. About 93.5 per cent of the countries in the sample have accelerated progress on the target of reversing the spread of HIV/AIDS as measured by the indicator “HIV prevalence among young people”. On Goal 8, there have been significant improvements in four of the six indicators. Official development assistance (ODA) disbursements to basic social services and small island states accelerated. Debt relief under the Heavily Indebted Poor Countries (HIPC) initiative and the Multilateral Debt Relief Initiative (MDRI) also accelerated. As regards ODA received by landlocked countries, however, progress accelerated for only 56 per cent of them. For the indicators “cellular subscribers per 100 population” and “internet users per 100 population”, progress accelerated in large proportions of countries after adoption of the MDGs. Because of the boom in telecommunications during the 2000s, it is expected that access to cell phones and the internet will have increased significantly in several countries. Fourth, the least progress has been made towards Goals 3, 5 and 7. As regards Goal 3, on the indicator “ratio of female-to-male enrolment in primary school”, in 47 of those 82 countries
12
International Policy Centre for Inclusive Growth
there was a slowdown in MDG progress after the commitment to the MDGs. On the indicator “share of women in wage employment in the non-agricultural sector”, 16 of the 24 countries for which complete data are available have experienced a slowdown in the rate of progress after commitment to the MDGs. Goal 5 deserves attention and calls for more effective interventions: in 16 of the 21 countries for which complete data are available there was a major deceleration in the rate of progress after adoption of the MDGs. The sobering result is that 76 per cent of the countries for which there are better data on Goal 5 have experienced a slowdown in their effort to reduce maternal mortality. This is because of a weakening in the rate of progress towards births attended by skilled personnel: progress on this indicator has decelerated in about 77 per cent of the countries. Deceleration, however, does not necessarily imply that the level of indicator has decreased, but rather that the rate at which it is growing after commitment to the MDGs is slower than the rate of growth before that. On Goal 7, “ensure environmental sustainability”, the rate of progress slowed down in 40 of 97 countries. Fifty-one of 95 countries experienced a slowdown in progress on the indicator of “decreasing CO2 emissions (metric tons per capita)” in the period after commitment to the MDGs, relative to the previous decade. TABLE 3
Improvement in the Rate of Progress, by Country (ε=1) Country
Rank
Improved Indicators
Burkina Faso Angola Central African Rep. Morocco Nepal Senegal Ethiopia Togo Nigeria Mali Guatemala Panama Zimbabwe Niger Burundi Madagascar Myanmar El Salvador Gambia, The Venezuela Benin Swaziland Paraguay Vietnam Zambia Cameroon Rwanda Nicaragua Libya Afghanistan Indonesia Brazil
1 2 3 4 5 6 7 8 9 10 11 12 13 14 15 16 17 18 19 20 21 22 23 24 25 26 27 28 29 30 31 32
21 18 18 25 23 21 20 20 19 20 19 21 16 22 18 17 15 17 14 16 16 16 21 13 20 19 19 16 9 9 18 18
(%) 91.3 90.0 90.0 89.3 88.5 87.5 87.0 87.0 86.4 83.3 82.6 80.8 80.0 78.6 78.3 77.3 75.0 73.9 73.7 72.7 72.7 72.7 72.4 72.2 71.4 70.4 70.4 69.6 69.2 69.2 69.2 69.2
Maintained Indicators 0 0 0 1 1 0 0 0 0 0 0 1 0 0 1 0 1 0 0 1 0 0 2 0 0 1 1 2 3 1 1 0
($) 0.0 0.0 0.0 3.6 3.8 0.0 0.0 0.0 0.0 0.0 0.0 3.8 0.0 0.0 4.3 0.0 5.0 0.0 0.0 4.5 0.0 0.0 6.9 0.0 0.0 3.7 3.7 8.7 23.1 7.7 3.8 0.0
Decreased Indicators 2 2 2 2 2 3 3 3 3 4 4 4 4 6 4 5 4 6 5 5 6 6 6 5 8 7 7 5 1 3 7 8
Indicators by country
(%) 8.7 10.0 10.0 7.1 7.7 12.5 13.0 13.0 13.6 16.7 17.4 15.4 20.0 21.4 17.4 22.7 20.0 26.1 26.3 22.7 27.3 27.3 20.7 27.8 28.6 25.9 25.9 21.7 7.7 23.1 26.9 30.8
23 20 20 28 26 24 23 23 22 24 23 26 20 28 23 22 20 23 19 22 22 22 29 18 28 27 27 23 13 13 26 26
→
13
Working Paper
Congo, Dem. Rep. Chad Kenya Cote d'Ivoire Guinea Egypt, Arab Rep. India Colombia Botswana Mozambique Tanzania Uganda West Bank & Gaza Argentina Ecuador Bangladesh Thailand China Lesotho Sierra Leone Liberia Honduras Turkey Yemen, Rep. Congo, Rep. Mexico Malawi Peru Gabon Syrian Arab Repub. Pakistan Bhutan Mongolia Cambodia Somalia Iran, Islamic Rep. Malaysia Namibia South Africa Djibouti Philippines Eritrea Sri Lanka Ghana Equatorial Guinea Lao PDR Cyprus Tunisia Korea, Dem. Rep. Qatar Algeria Sudan Uruguay Lebanon Chile Bolivia Mauritania Iraq United Arab Emirates Costa Rica Saudi Arabia Jordan Brunei Darussalam Bahrain Oman Kuwait
33 34 35 36 36 38 38 40 41 41 41 44 45 46 47 48 48 50 51 52 53 54 54 56 57 58 59 60 61 62 63 64 65 66 67 68 69 69 71 72 73 74 75 76 77 78 79 80 81 82 83 84 85 86 87 88 89 90 91 92 93 94 95 96 96 98
11 13 15 15 15 17 17 21 16 16 16 16 6 17 17 15 15 15 13 11 9 16 16 12 12 20 18 20 9 12 15 9 13 13 7 11 15 15 12 12 16 8 13 13 9 11 12 13 7 8 12 13 13 8 13 13 12 7 9 12 6 8 5 5 5 3
68.8 68.4 68.2 68.2 68.2 68.0 68.0 67.7 66.7 66.7 66.7 66.7 66.7 65.4 65.4 65.2 65.2 65.2 65.0 64.7 64.3 64.0 64.0 63.2 63.2 62.5 62.1 60.6 60.0 60.0 60.0 60.0 59.1 59.1 58.3 57.9 57.7 57.7 57.1 57.1 57.1 57.1 56.5 56.5 56.3 55.0 54.5 54.2 53.8 53.3 52.2 52.0 50.0 50.0 50.0 50.0 48.0 46.7 42.9 42.9 37.5 32.0 31.3 27.8 27.8 18.8
2 0 1 0 0 1 1 2 1 1 1 0 0 1 0 1 1 0 2 1 0 1 1 2 0 2 3 0 1 1 1 0 4 0 3 3 1 1 3 2 2 0 3 0 2 0 5 1 5 4 1 1 5 3 1 0 1 2 6 2 3 4 3 1 1 0
12.5 0.0 4.5 0.0 0.0 4.0 4.0 6.5 4.2 4.2 4.2 0.0 0.0 3.8 0.0 4.3 4.3 0.0 10.0 5.9 0.0 4.0 4.0 10.5 0.0 6.3 10.3 0.0 6.7 5.0 4.0 0.0 18.2 0.0 25.0 15.8 3.8 3.8 14.3 9.5 7.1 0.0 13.0 0.0 12.5 0.0 22.7 4.2 38.5 26.7 4.3 4.0 19.2 18.8 3.8 0.0 4.0 13.3 28.6 7.1 18.8 16.0 18.8 5.6 5.6 0.0
3 6 6 7 7 7 7 8 7 7 7 8 3 8 9 7 7 8 5 5 5 8 8 5 7 10 8 13 5 7 9 6 5 9 2 5 10 10 6 7 10 6 7 10 5 9 5 10 1 3 10 11 8 5 12 13 12 6 6 14 7 13 8 12 12 13
18.8 31.6 27.3 31.8 31.8 28.0 28.0 25.8 29.2 29.2 29.2 33.3 33.3 30.8 34.6 30.4 30.4 34.8 25.0 29.4 35.7 32.0 32.0 26.3 36.8 31.3 27.6 39.4 33.3 35.0 36.0 40.0 22.7 40.9 16.7 26.3 38.5 38.5 28.6 33.3 35.7 42.9 30.4 43.5 31.3 45.0 22.7 41.7 7.7 20.0 43.5 44.0 30.8 31.3 46.2 50.0 48.0 40.0 28.6 50.0 43.8 52.0 50.0 66.7 66.7 81.3
16 19 22 22 22 25 25 31 24 24 24 24 9 26 26 23 23 23 20 17 14 25 25 19 19 32 29 33 15 20 25 15 22 22 12 19 26 26 21 21 28 14 23 23 16 20 22 24 13 15 23 25 26 16 26 26 25 15 21 28 16 25 16 18 18 16
Source: Authors’ calculations based on the sample of developing countries. Note: Share on “accelerated”, “maintained”, and “decelerated” refer to the total observations with complete data.
14
International Policy Centre for Inclusive Growth
TABLE 4
Rank of Countries by MDG Performance across Regions Sub-Saharan Africa
Rank 1 2 3 4 5 6 7 8 9 10 11 12 13 14 15 16 17 18 19 20 21 22 23 24 25 26 27 28 29 30 31 32 33 34 35 36 37 38 39 40
Latin America/ Caribbean
Southern Asia
Middle East/North Africa
East Asia/ Pacific
Least Developed countries
Burkina Faso Angola
Guatemala Panama
Nepal Afghanistan
Morocco Libya
Myanmar Vietnam
Burkina Faso Angola
Central African Rep. Senegal Ethiopia Togo Nigeria Mali Zimbabwe Niger Burundi Madagascar Gambia, The Benin Swaziland Zambia Cameroon Rwanda Congo, Dem. Rep. Chad Kenya Cote d'Ivoire Guinea Botswana Mozambique Tanzania Uganda Lesotho Sierra Leone Liberia Congo, Rep. Malawi Gabon Somalia Namibia South Africa Eritrea Ghana Equatorial Guinea Mauritania
El Salvador Venezuela Paraguay Nicaragua Brazil Colombia Argentina Ecuador Honduras Mexico Peru Uruguay Chile Bolivia Costa Rica
India Bangladesh Pakistan Bhutan Sri Lanka
Egypt, Arab Rep. West Bank & Gaza Yemen, Rep. Syrian Arab Rep. Iran, Islamic Rep. Djibouti Tunisia Qatar Algeria Sudan Lebanon Iraq United Arab Emirates Saudi Arabia Jordan Bahrain Oman Kuwait
Indonesia Thailand China Mongolia Cambodia Malaysia Philippines Laos PDR Korea, Dem.R. Brunei Daru.
Central African Rep. Nepal Senegal Ethiopia Togo Mali Niger Burundi Madagascar Myanmar Gambia, The Benin Zambia Rwanda Afghanistan Congo, Dem. Rep. Chad Guinea Mozambique Tanzania Uganda Bangladesh Lesotho Sierra Leone Liberia Yemen, Rep. Malawi Bhutan Cambodia Somalia Djibouti Eritrea Equatorial Guinea Lao PDR Sudan Mauritania
Source: Authors’ calculations. TABLE 5
Improvement in the Rate of Progress, by Goal (ε=1) Goal 1 2 3 4 5 6 7 8
Accelerated Countries 72 41 49 63 5 77 52 68
(%) 76.6 61.2 52.7 64.3 23.8 78.6 53.6 69.4
Maintained Countries 6 9 2 6 5 1
Decelerated (%) 6.4 0.0 9.7 2.0 0.0 6.1 5.2 1.0
Countries 16 26 35 33 16 15 40 29
Source: Authors’ calculations based on the sample of developing countries.
(%) 17.0 38.8 37.6 33.7 76.2 15.3 41.2 29.6
Total countries 94 67 93 98 21 98 97 98
15
Working Paper
TABLE 6
Improvement in the Rate of Progress, by Indicator (ε=1) Goal 1
2
3
4
5
6
7
8
Indicator
Accelerated progress
Maintained progress
Countries
Countries
(%)
(%)
Decreased progress Countries
Countries by indicator
(%)
1.1
10
76.9
1
7.7
2
15.4
13
1.2
9
69.2
1
7.7
3
23.1
13
1.3
13
100
-
0
-
0
13
1.4
55
88.7
-
0
7
11.3
62
1.5
58
59.8
-
0
39
40.2
97
1.6
8
80
-
0
2
20
10
1.7
4
36.4
-
0
7
63.6
11
1.8
5
83.3
-
0
1
16.7
6
1.9
40
44.4
21
23.3
29
32.2
90
2.1
31
59.6
-
0
21
40.4
52
2.2
36
69.2
5
9.6
11
21.2
52
2.3
13
56.5
-
0
10
43.5
23
3.1a
35
42.7
-
0
47
57.3
82
3.1b
20
33.9
18
30.5
21
35.6
59
3.1c
14
50
9
32.1
5
17.9
28
3.2
8
33.3
-
0
16
66.7
24
3.3
52
76.5
-
0
16
23.5
68
4.1
65
66.3
3
3.1
30
30.6
98
4.2
65
66.3
3
3.1
30
30.6
98
4.3
60
63.8
-
0
34
36.2
94
5.2
4
22.2
-
0
14
77.8
18
5.3
11
61.1
-
0
7
38.9
18
5.5
10
66.7
-
0
5
33.3
15
5.6
1
25
-
0
3
75
4
6.1
1
100
-
0
-
0
1
6.1
58
93.5
1
1.6
3
4.8
62
6.4
-
0
2
100
-
0
2
6.9a
68
70.1
17
17.5
12
12.4
97
6.9b
-
0
8
100
-
0
8
6.9c
56
57.1
-
0
42
42.9
98
7.1
66
70.2
8
8.5
20
21.3
94
7.2
44
46.3
-
0
51
53.7
95
7.8
52
70.3
7
9.5
15
20.3
74
7.9
44
61.1
6
8.3
22
30.6
72
8.4
45
55.6
6
7.4
30
37
81
8.12a
45
71.4
-
0
18
28.6
63
8.12b
49
70
-
0
21
30
70
8.14
46
47.4
-
0
51
52.6
97
8.15
96
99
1
1
-
0
97
8.16
94
96.9
1
1
2
2.1
97
Source: Authors’ calculations based on the sample of developing countries. Note: Share on “accelerated”, “maintained”, and ‘decreased” refer to the total observations with complete data.
16
International Policy Centre for Inclusive Growth
6 CONCLUDING REMARKS Countries may be severely penalised by the established methods for measuring MDG achievements, mainly because the MDG targets were set globally but the constraints the countries face differ enormously. In this paper, we move away from comparing indicator levels across time and judging countries in terms of strict 2015 targets. The methodology we have proposed, based on the rate of progress and considering non-linearity and effort appreciation, gives a fresh perspective into looking at the commitment to the MDGs and the effort to accelerate progress. We have shown that it is essential to account for different departure levels (“countries that start at a low level but are trying hard”) and approaching upper bound levels (“countries at a high level that are facing challenges”). We acknowledge the need for some caveats in our results because of missing data, and we stress the importance of improving statistical systems. Our methodology can be used to add more countries and indicators as data become available. Given these caveats, our findings demonstrate that: (i) the assumption that “Africa is lagging behind” on the MDGs is not well founded. SSA countries are the best performers in terms of MDG acceleration; (ii) LDCs also accelerated the rate of progress on the MDGs, even after we correct for effort appreciation (which puts middle-income countries on an equal footing with the LDCs); (iii) as regards the Goals, significant progress has been made towards Goals 1, 2, 4, 6 and 8. These improvements are mainly linked to improvements in the growth rate of GDP per person employed; primary completion rates; reduction in child mortality; reduction in HIV prevalence; and increase in ODA and debt relief; and (iv) many episodes of slowdown in MDG progress are in Goals 3, 5 and 7. Improving female employment, maternal health, and ensuring environmental sustainability deserve special attention.
17
Working Paper
ANNEX A THE MILLENNIUM DEVELOPMENT GOALS, TARGETS AND INDICATORS Goals and targets (from the Millennium Declaration)
Indicators for monitoring progress
Goal 1: Eradicate extreme poverty and hunger Target 1.A: Halve, between 1990 and 2015, the proportion of 1.1 Proportion of population below $1.25 (PPP) per day people whose income is less than one dollar a day 1.2 Poverty gap ratio at $1.25 a day (PPP) 1.3 Share of poorest quintile in national consumption Target 1.B: Achieve full and productive employment and decent work for all, including women and young people
1.4 Growth rate of GDP per person employed (constant 1990 PPP $) 1.5 Employment-to-population ratio (15+ years old) 1.6 Proportion of employed people living below $1 (PPP) per day (Vulnerable employment, per cent of total employment) 1.7 Proportion of own-account and contributing family workers in total employment (per cent of total employed) Target 1.C: Halve, between 1990 and 2015, the proportion of 1.8 Prevalence of underweight children under-five years people who suffer from hunger of age (malnutrition prevalence) 1.9 Proportion of population below minimum level of dietary energy consumption (prevalence of undernourishment) Goal 2: Achieve universal primary education Target 2.A: Ensure that, by 2015, children everywhere, boys 2.1 Net enrolment ratio in primary education (school and girls alike, will be able to complete a full course of enrolment) primary schooling 2.2 Proportion of pupils starting grade 1 who reach last grade of primary (primary completion rate, total, per cent of relevant age group) 2.3 Literacy rate of 15-24 year-olds, women and men (youth total) Goal 3: Promote gender equality and empower women Target 3.A: Eliminate gender disparity in primary and 3.1 Ratios of girls to boys in: secondary education, preferably by 2005, and in all levels of 3.1a. primary education education no later than 2015 3.1b. secondary education 3.1c. tertiary education 3.2 Share of women in wage employment in the nonagricultural sector 3.3 Proportion of seats held by women in national parliament Goal 4: Reduce child mortality Target 4.A: Reduce by two-thirds, between 1990 and 2015, 4.1 Under-five mortality rate (per 1,000) the under-five mortality rate 4.2 Infant mortality rate (per 1,000 live births) 4.3 Proportion of 1 year-old children immunised against measles Goal 5: Improve maternal health Target 5.A: Reduce by three-quarters, between 1990 and 5.1 Maternal mortality ratio (per 100,000 live births) 2015, the maternal mortality ratio 5.2 Proportion of births attended by skilled health personnel Target 5.B: Achieve, by 2015, universal access to reproductive 5.3 Contraceptive prevalence rate (per cent of women health ages 15-49) 5.4 Adolescent fertility rate (births per 1,000 women ages 15-19) 5.5 Antenatal care coverage (at least one visit and at least four visits) 5.6 Unmet need for family planning (per cent of married women ages 15-49)
18
International Policy Centre for Inclusive Growth
Goal 6: Combat HIV/AIDS, malaria and other diseases Target 6.A: Have halted by 2015 and begun to reverse the spread of HIV/AIDS
6.1 HIV prevalence among population (per cent of population ages 15-49)* 6.2 Condom use at last high-risk sex 6.2a. female, per cent adults(15-49) 6.2b. male, per cent adults(15-49) 6.3 Proportion of population aged 15-24 years with comprehensive correct knowledge of HIV/AIDS: 6.3a. female 6.3b. male 6.4 Ratio of school attendance of orphans to school attendance of non-orphans aged 10-14 years Target 6.B: Achieve, by 2010, universal access to treatment for 6.5 Proportion of population with advanced HIV infection HIV/AIDS for all those who need it with access to antiretroviral drugs Target 6.C: Have halted by 2015 and begun to reverse the incidence of malaria and other major diseases
Goal 7: Ensure environmental sustainability Target 7.A: Integrate the principles of sustainable development into country policies and programmes and reverse the loss of environmental resources
6.6 Incidence rate associated with malaria 6.7 Proportion of children under 5 sleeping under insecticide-treated bednets 6.8 Proportion of children under 5 with fever who are treated with appropriate anti-malarial drugs 6.9 Rates associated with tuberculosis: 6.9a. Incidence 6.9b. Prevalence 6.9c. Death 6.10 Proportion of tuberculosis cases detected and cured under directly observed treatment short course (per cent registered cases)
7.1 7.2 7.3 7.4
Proportion of land area covered by forest CO2 emissions (metric tons per capita) [N.A.] Consumption of ozone-depleting substances [N.A.] Proportion of fish stocks within safe biological limits Target 7.B: Reduce biodiversity loss, achieving, by 2010, a 7.5 Proportion of total water resources used (Annual significant reduction in the rate of loss freshwater withdrawals, per cent of internal resources) 7.6 Proportion of areas protected: 7.6.a. Terrestrial 7.6.b. Marine 7.7 [N.A.] Proportion of species threatened with extinction Target 7.C: Halve, by 2015, the proportion of people without 7.8 Proportion of population using an improved drinking sustainable access to safe drinking water and basic sanitation water source 7.9 Proportion of population using an improved sanitation facility Target 7.D: By 2020, to have achieved a significant 7.10 Proportion of urban population living in slums performance in the lives of at least 100 million slum dwellers Goal 8: Develop a global partnership for development Target 8.A: Develop further an open, rule-based, predictable, Some of the indicators listed below are monitored separately for non-discriminatory trading and financial system the least developed countries (LDCs), Africa, landlocked developing countries and small island developing States. Includes a commitment to good governance, development Official development assistance (ODA) and poverty reduction – both nationally and internationally 8.1 [do not apply] Net ODA, total and to the least developed countries, as percentage of OECD/DAC donors’ gross Target 8.B: Address the special needs of the least developed national income countries 8.2 Proportion of total bilateral, sector-allocable ODA of OECD/DAC donors to basic social services (basic Includes: tariff and quota free access for the least developed education, primary health care, nutrition, safe water and countries' exports; enhanced programme of debt relief for sanitation) heavily indebted poor countries (HIPC) and cancellation of 8.3 [do not apply] Proportion of bilateral official development official bilateral debt; and more generous ODA for countries assistance of OECD/DAC donors that is untied committed to poverty reduction
Working Paper
19
Target 8.C: Address the special needs of landlocked developing countries and small island developing States (through the Programme of Action for the Sustainable Development of Small Island Developing States and the outcome of the twenty-second special session of the General Assembly)
8.4 ODA received in landlocked developing countries as a proportion of their gross national incomes 8.5 ODA received in small island developing States as a proportion of their gross national incomes Market access 8.6 [do not apply] Proportion of total developed country imports (by value and excluding arms) from developing countries and least developed countries, admitted free of duty Target 8.D: Deal comprehensively with the debt problems of 8.7 [do not apply] Average tariffs imposed by developed developing countries through national and international countries on agricultural products and textiles and measures in order to make debt sustainable in the long term clothing from developing countries 8.8 [do not apply] Agricultural support estimate for OECD countries as a percentage of their gross domestic product 8.9 [N.A.] Proportion of ODA provided to help build trade capacity Debt sustainability 8.10 [N.A.] Total number of countries that have reached their HIPC decision points and number that have reached their HIPC completion points (cumulative) 8.11 Debt relief committed under HIPC and MDRI Initiatives 8.12 Debt service as a percentage of exports of goods and services: 8.12.a. Total debt service (per cent of exports of goods, services and income) 8.12.b. Debt service (PPG and IMF only, per cent of exports, excluding workers' remittances) Target 8.E: In cooperation with pharmaceutical companies, provide access to affordable essential drugs in developing countries Target 8.F: In cooperation with the private sector, make available the benefits of new technologies, especially information and communications
8.13 [N.A.] Proportion of population with access to affordable essential drugs on a sustainable basis 8.14 Telephone lines per 100 population 8.15 Cellular subscribers per 100 population 8.16 Internet users per 100 population
Note: indicators are available at . Brackets indicate the exact data series, available at the MDGs monitoring dataset. The coding “N.A.” refers to data not available for this study, and “do not apply” is not applicable to the developing countries sample. (*) Although the official indicator refers to age group 15–24, we used age group 15–49 because of data constraints.
20
International Policy Centre for Inclusive Growth
ANNEX B The countries/states included in our sample of complete data: Afghanistan, Algeria, Angola, Argentina, Bahrain, Bangladesh, Benin, Bhutan, Bolivia, Botswana, Brazil, Brunei Darussalam, Burkina Faso, Burundi, Cambodia, Cameroon, Central African Republic, Chad, Chile, China, Colombia, Congo (Democratic Republic of), Congo (Republic of), Costa Rica, Cote d'Ivoire, Cyprus, Djibouti, Ecuador, Egypt, El Salvador, Equatorial Guinea, Eritrea, Ethiopia, Gabon, Gambia, Ghana, Guatemala, Guinea, Honduras, India, Indonesia, Iran, Iraq, Jordan, Kenya, Korea (Democratic Republic of), Kuwait, Lao PDR, Lebanon, Lesotho, Liberia, Libya, Madagascar, Malawi, Malaysia, Mali, Mauritania, Mexico, Mongolia, Morocco, Mozambique, Myanmar, Namibia, Nepal, Nicaragua, Niger, Nigeria, Oman, Pakistan, Panama, Paraguay, Peru, Philippines, Qatar, Rwanda, Saudi Arabia, Senegal, Sierra Leone, Somalia, South Africa, Sri Lanka, Sudan, Swaziland, Syrian Arab Republic, Tanzania, Thailand, Togo, Tunisia, Turkey, Uganda, United Arab Emirates, Uruguay, Venezuela, Vietnam, West Bank and Gaza, Yemen, Zambia, Zimbabwe.
TABLE B.1.
List of Codes and Frequency of Indicators, Countries with Complete Data Goal
Indicator
Frequency (# obs, countries)
Goal
Indicator
Frequency (# obs, countries)
1 1 1 1 1 1 1 1 1 2 2 2 3 3 3 3 3 4 4 4
1.1 1.2 1.3 1.4 1.5 1.6 1.7 1.8 1.9 2.1 2.2 2.3 3.3a 3.3b 3.3c 3.2 3.3 4.1 4.2 4.3
13 13 13 62 97 10 11 6 90 52 52 23 82 59 28 24 68 98 98 94
6 6 5 5 5 6 5 6 6 7 7 6 7 8 8 8 7 8 8 8
6.4 6.1 5.6 5.5 5.2 6.9c 5.3 6.9a 6.9b 7.1 7.2 6.1 7.8 8.12b 8.16 8.15 7.9 8.12a 8.14 8.4
2 62 4 15 18 98 18 97 8 94 95 1 74 70 97 97 72 63 97 81
*
Source: Authors’ calculations. Note: (*) see Annex A for description of the indicators.
*
ANNEX C TABLE C.1 REPRODUCES TABLE 3 AND PRESENTS THE RANKING OF COUNTRIES HAD WE NOT ADOPTED THE EFFORT APPRECIATION, I.E. USING EPSILON=0. TABLE C.1
List of Codes and Frequency of Indicators, Countries with Complete Data. Comparison of Different Values of Effort Appreciation Rank Country Burkina Faso Angola Central African Republic Morocco Nepal Senegal Ethiopia Togo Nigeria Mali Guatemala Panama Zimbabwe Niger Burundi Madagascar Myanmar El Salvador Gambia, The Venezuela Benin Swaziland Paraguay Vietnam Zambia Cameroon Rwanda Nicaragua Libya Afghanistan
R(E=1) 1 2
Improved Num. indic. 21 18
Maintained Share 91.3% 90.0%
3 4 5 6 7 8 9 10 11 12 13 14 15 16 17 18 19 20 21 22 23 24 25 26 27 28 29 30
18 25 23 21 20 20 19 20 19 21 16 22 18 17 15 17 14 16 16 16 21 13 20 19 19 16 9 9
90.0% 89.3% 88.5% 87.5% 87.0% 87.0% 86.4% 83.3% 82.6% 80.8% 80.0% 78.6% 78.3% 77.3% 75.0% 73.9% 73.7% 72.7% 72.7% 72.7% 72.4% 72.2% 71.4% 70.4% 70.4% 69.6% 69.2% 69.2%
Num. indic.
1 1
1
1 1
1
2
1 1 2 3 1
Decreased
Rank
Improved
Maintained
Share 0.0% 0.0%
Num. indic. 2 2
Share 8.7% 10.0%
R(E=0) 2 4
Num. indic. 20 17
Share 87.0% 85.0%
0.0% 3.6% 3.8% 0.0% 0.0% 0.0% 0.0% 0.0% 0.0% 3.8% 0.0% 0.0% 4.3% 0.0% 5.0% 0.0% 0.0% 4.5% 0.0% 0.0% 6.9% 0.0% 0.0% 3.7% 3.7% 8.7% 23.1% 7.7%
2 2 2 3 3 3 3 4 4 4 4 6 4 5 4 6 5 5 6 6 6 5 8 7 7 5 1 3
10.0% 7.1% 7.7% 12.5% 13.0% 13.0% 13.6% 16.7% 17.4% 15.4% 20.0% 21.4% 17.4% 22.7% 20.0% 26.1% 26.3% 22.7% 27.3% 27.3% 20.7% 27.8% 28.6% 25.9% 25.9% 21.7% 7.7% 23.1%
1 16 12 5 6 7 3 18 19 13 8 9 10 14 30 68 11 32 33 15 46 39 17 26 35 55 82 38
18 20 19 20 18 18 19 17 16 19 15 21 17 16 13 12 14 14 14 16 17 11 20 18 17 13 6 8
90.0% 71.4% 73.1% 83.3% 78.3% 78.3% 86.4% 70.8% 69.6% 73.1% 75.0% 75.0% 73.9% 72.7% 65.0% 52.2% 73.7% 63.6% 63.6% 72.7% 58.6% 61.1% 71.4% 66.7% 63.0% 56.5% 46.2% 61.5%
Num. indic.
1 1
1
1 1
1
2
1 1 3 1
Total indicators
Decreased
Rank difference
Share 0.0% 0.0%
Num. indic. 3 3
Share 13.0% 15.0%
23 20
R(E=1)‐R(E=0) ‐1 ‐2
0.0% 3.6% 3.8% 0.0% 0.0% 0.0% 0.0% 0.0% 0.0% 3.8% 0.0% 0.0% 4.3% 0.0% 5.0% 0.0% 0.0% 4.5% 0.0% 0.0% 6.9% 0.0% 0.0% 0.0% 3.7% 4.3% 23.1% 7.7%
2 7 6 4 5 5 3 7 7 6 5 7 5 6 6 11 5 7 8 6 10 7 8 9 9 9 4 4
10.0% 25.0% 23.1% 16.7% 21.7% 21.7% 13.6% 29.2% 30.4% 23.1% 25.0% 25.0% 21.7% 27.3% 30.0% 47.8% 26.3% 31.8% 36.4% 27.3% 34.5% 38.9% 28.6% 33.3% 33.3% 39.1% 30.8% 30.8%
20 28 26 24 23 23 22 24 23 26 20 28 23 22 20 23 19 22 22 22 29 18 28 27 27 23 13 13
2 ‐12 ‐7 1 1 1 6 ‐8 ‐8 ‐1 5 5 5 2 ‐13 ‐50 8 ‐12 ‐12 7 ‐23 ‐15 8 0 ‐8 ‐27 ‐53 ‐8
Rank R(E=1)
Share
Num. indic.
Share
Num. indic.
Share
R(E=0)
Num. indic.
Share
Num. indic.
Share
Num. indic.
Share
R(E=1)‐R(E=0)
31
18
69.2%
1
3.8%
7
26.9%
28
17
65.4%
1
3.8%
8
30.8%
26
3
Brazil Congo, Dem. Rep. Chad Kenya Cote d'Ivoire Guinea Egypt, Arab Rep. India Colombia Botswana Mozambique Tanzania Uganda West Bank and Gaza Argentina Ecuador Bangladesh Thailand China Lesotho Sierra Leone Liberia Honduras Turkey Yemen, Rep. Congo, Rep. Mexico Malawi Peru Gabon Syrian Arab Republic Pakistan Bhutan Mongolia Cambodia
32 33 34 35 36 37 38 39 40 41 42 43 44 45 46 47 48 49 50 51 52 53 54 55 56 57 58 59 60 61 62 63 64 65 66
18 11 13 15 15 15 17 17 21 16 16 16 16 6 17 17 15 15 15 13 11 9 16 16 12 12 20 18 20 9 12 15 9 13 13
69.2% 68.8% 68.4% 68.2% 68.2% 68.2% 68.0% 68.0% 67.7% 66.7% 66.7% 66.7% 66.7% 66.7% 65.4% 65.4% 65.2% 65.2% 65.2% 65.0% 64.7% 64.3% 64.0% 64.0% 63.2% 63.2% 62.5% 62.1% 60.6% 60.0% 60.0% 60.0% 60.0% 59.1% 59.1%
0.0% 12.5% 0.0% 4.5% 0.0% 0.0% 4.0% 4.0% 6.5% 4.2% 4.2% 4.2% 0.0% 0.0% 3.8% 0.0% 4.3% 4.3% 0.0% 10.0% 5.9% 0.0% 4.0% 4.0% 10.5% 0.0% 6.3% 10.3% 0.0% 6.7% 5.0% 4.0% 0.0% 18.2% 0.0%
8 3 6 6 7 7 7 7 8 7 7 7 8 3 8 9 7 7 8 5 5 5 8 8 5 7 10 8 13 5 7 9 6 5 9
30.8% 18.8% 31.6% 27.3% 31.8% 31.8% 28.0% 28.0% 25.8% 29.2% 29.2% 29.2% 33.3% 33.3% 30.8% 34.6% 30.4% 30.4% 34.8% 25.0% 29.4% 35.7% 32.0% 32.0% 26.3% 36.8% 31.3% 27.6% 39.4% 33.3% 35.0% 36.0% 40.0% 22.7% 40.9%
64 20 22 23 24 34 43 57 31 36 37 25 27 58 63 51 40 56 41 29 45 54 72 70 21 49 66 47 79 42 59 44 65 60 61
14 11 13 15 15 14 15 14 20 15 15 16 16 5 14 15 14 13 14 13 10 8 13 13 13 11 17 17 16 9 11 15 8 12 12
53.8% 68.8% 68.4% 68.2% 68.2% 63.6% 60.0% 56.0% 64.5% 62.5% 62.5% 66.7% 66.7% 55.6% 53.8% 57.7% 60.9% 56.5% 60.9% 65.0% 58.8% 57.1% 52.0% 52.0% 68.4% 57.9% 53.1% 58.6% 48.5% 60.0% 55.0% 60.0% 53.3% 54.5% 54.5%
0.0% 12.5% 0.0% 4.5% 0.0% 0.0% 4.0% 4.0% 3.2% 4.2% 4.2% 4.2% 0.0% 0.0% 3.8% 0.0% 4.3% 4.3% 0.0% 10.0% 0.0% 0.0% 0.0% 4.0% 10.5% 0.0% 3.1% 6.9% 0.0% 6.7% 5.0% 4.0% 0.0% 18.2% 0.0%
12 3 6 6 7 8 9 10 10 8 8 7 8 4 11 11 8 9 9 5 7 6 12 11 4 8 14 10 17 5 8 9 7 6 10
46.2% 18.8% 31.6% 27.3% 31.8% 36.4% 36.0% 40.0% 32.3% 33.3% 33.3% 29.2% 33.3% 44.4% 42.3% 42.3% 34.8% 39.1% 39.1% 25.0% 41.2% 42.9% 48.0% 44.0% 21.1% 42.1% 43.8% 34.5% 51.5% 33.3% 40.0% 36.0% 46.7% 27.3% 45.5%
26 16 19 22 22 22 25 25 31 24 24 24 24 9 26 26 23 23 23 20 17 14 25 25 19 19 32 29 33 15 20 25 15 22 22
‐32 13 12 12 12 3 ‐5 ‐18 9 5 5 18 17 ‐13 ‐17 ‐4 8 ‐7 9 22 7 ‐1 ‐18 ‐15 35 8 ‐8 12 ‐19 19 3 19 ‐1 5 5
2 1
1 1 2 1 1 1
1 1 1 2 1 1 1 2 2 3 1 1 1 4
Decreased
Rank
Improved
Maintained
2 1
1 1 1 1 1 1
1 1 1 2
1 2 1 2 1 1 1 4
Decreased
Rank difference
Indonesia
Country
Maintained
Total indicators
Improved Num. indic.
Country Somalia Iran, Islamic Rep. Malaysia Namibia South Africa Djibouti Philippines Eritrea Sri Lanka Ghana Equatorial Guinea Lao PDR Cyprus Tunisia Korea, Dem. Rep. Qatar Algeria Sudan Uruguay Lebanon Chile Bolivia Mauritania Iraq United Arab Emirates Costa Rica Saudi Arabia Jordan Brunei Darussalam Bahrain Oman Kuwait
Rank
Maintained
67 68 69 70 71 72 73 74 75 76 77 78 79 80 81 82 83 84 85 86 87 88 89 90
Improved Num. indic. 7 11 15 15 12 12 16 8 13 13 9 11 12 13 7 8 12 13 13 8 13 13 12 7
Share 58.3% 57.9% 57.7% 57.7% 57.1% 57.1% 57.1% 57.1% 56.5% 56.5% 56.3% 55.0% 54.5% 54.2% 53.8% 53.3% 52.2% 52.0% 50.0% 50.0% 50.0% 50.0% 48.0% 46.7%
Num. indic. 3 3 1 1 3 2 2
91 92 93 94 95 96 97 98
9 12 6 8 5 5 5 3
42.9% 42.9% 37.5% 32.0% 31.3% 27.8% 27.8% 18.8%
6 2 3 4 3 1 1
R(E=1)
3 2 5 1 5 4 1 1 5 3 1 1 2
Share 25.0% 15.8% 3.8% 3.8% 14.3% 9.5% 7.1% 0.0% 13.0% 0.0% 12.5% 0.0% 22.7% 4.2% 38.5% 26.7% 4.3% 4.0% 19.2% 18.8% 3.8% 0.0% 4.0% 13.3%
Decreased Num. indic. 2 5 10 10 6 7 10 6 7 10 5 9 5 10 1 3 10 11 8 5 12 13 12 6
Share 16.7% 26.3% 38.5% 38.5% 28.6% 33.3% 35.7% 42.9% 30.4% 43.5% 31.3% 45.0% 22.7% 41.7% 7.7% 20.0% 43.5% 44.0% 30.8% 31.3% 46.2% 50.0% 48.0% 40.0%
28.6% 7.1% 18.8% 16.0% 18.8% 5.6% 5.6% 0.0%
6 14 7 13 8 12 12 13
28.6% 50.0% 43.8% 52.0% 50.0% 66.7% 66.7% 81.3%
Rank
Improved
Maintained
48 85 89 50 52 53 81 83 67 69 75 77 91 76 62 86 88 71 73 74 84 78 87 80
Num. indic. 7 8 10 15 12 12 13 6 12 12 8 10 8 12 7 6 9 13 13 8 11 13 10 7
Share 58.3% 42.1% 38.5% 57.7% 57.1% 57.1% 46.4% 42.9% 52.2% 52.2% 50.0% 50.0% 36.4% 50.0% 53.8% 40.0% 39.1% 52.0% 50.0% 50.0% 42.3% 50.0% 40.0% 46.7%
Num. indic. 3 2 1 1 3 2 1
Share 25.0% 10.5% 3.8% 3.8% 14.3% 9.5% 3.6% 0.0% 8.7% 0.0% 12.5% 0.0% 18.2% 4.2% 38.5% 26.7% 4.3% 4.0% 19.2% 18.8% 3.8% 0.0% 0.0% 13.3%
94 93 90 92 95 96 97 98
7 10 6 9 5 5 5 3
33.3% 35.7% 37.5% 36.0% 31.3% 27.8% 27.8% 18.8%
6 2 2 4 2 1 1
R(E=0)
2 2 4 1 5 4 1 1 5 3 1
2
28.6% 7.1% 12.5% 16.0% 12.5% 5.6% 5.6% 0.0%
Decreased Num. indic.
2 9 15 10 6 7 14 8 9 11 6 10 10 11 1 5 13 11 8 5 14 13 15 6
Share 16.7% 47.4% 57.7% 38.5% 28.6% 33.3% 50.0% 57.1% 39.1% 47.8% 37.5% 50.0% 45.5% 45.8% 7.7% 33.3% 56.5% 44.0% 30.8% 31.3% 53.8% 50.0% 60.0% 40.0%
8 16 8 12 9 12 12 13
38.1% 57.1% 50.0% 48.0% 56.3% 66.7% 66.7% 81.3%
Total indicators
Rank difference
12 19 26 26 21 21 28 14 23 23 16 20 22 24 13 15 23 25 26 16 26 26 25 15
R(E=1)‐R(E=0) 19 ‐17 ‐20 20 19 19 ‐8 ‐9 8 7 2 1 ‐12 4 19 ‐4 ‐5 13 12 12 3 10 2 10
21 28 16 25 16 18 18 16
‐3 ‐1 3 2 0 0 0 0
REFERENCES Atkinson, A. B. (1970). ‘On the Measurement of Inequality’, Journal of Economic Theory 2, 244–63. Clemens, M., T. Moss and C. Kenny (2004). ‘The Trouble with the MDGs: Confronting Expectations of Aid and Development Success’, CGD Working Paper 40. Washington, DC, Center for Global Development. Easterly, W. (2009). ‘How the Millennium Development Goals are Unfair to Africa’, World Development 37 (1), 26–35. Fukuda-Parr, S. and J. Greenstein. (2010). ‘How Should MDG Implementation Be Measured: Accelerating Progress or Achieving Target?’, Working Paper 63. Brasilia, International Policy Centre for Inclusive Growth. Hailu, D., R. G. Osorio and R. Tsukada (2008). ‘Privatization and Renationalisation: What Went Wrong in Bolivia's Water Sector?’, Working Paper 58. Brasilia, International Policy Centre for Inclusive Growth. Kakwani, N. (1993). ‘Performance in Living Standards: An International Comparison’, Journal of Development Economics, 41, 307–336. Leo, B. and J. Barmeier (2010) ‘Who Are the MDG Trailblazers? A New MDG Progress Index’, Working Paper 222. Washington, DC, Center for Global Development. Osorio, R. G. (2008a). ‘Alternatives for Projecting MDGs Indicators. Technical Paper 2. Brasilia, International Policy Centre for Inclusive Growth. Osorio, R. G. (2008b). ‘Can we Accurately Project MDG Indicators? One Pager 68. Brasilia, International Policy Centre for Inclusive Growth. Prennushi, G., G. Rubio, and K. Subbarao (2002). ‘Monitoring and Evaluation’, in J. Klugman (ed), A Sourcebook for Poverty Reduction Strategies. Washington, DC, World Bank. Tabatabai, H. (2007). ‘MDG Targets: Misunderstood or Misconceived?’ One Pager 33. Brasilia, International Policy Centre for Inclusive Growth. UN (2010). The Millennium Development Goals Report. New York, United Nations Department of Economic and Social Affairs. UNDP (2010). Beyond the Midpoint: Achieving the Millennium Development Goals. New York, United Nations Development Programme. UNICEF (2008). State of the World’s Children. New York, United Nations Children’s Fund. Vandermoortele, J. (2007). ‘MDGs: Misunderstood Targets?’ One Pager 28. Brasilia, International Policy Centre for Inclusive Growth. World Bank (2010b). Global Monitoring Report: The MDGs after the Crisis. Washington, DC, World Bank.
NOTES 1. Other criticisms focus on the way in which the indicators are computed, such as national versus PPP-adjusted poverty lines; income versus . consumption data; international comparability of survey questionnaires, and so on. 2. See Hailu, Osorio and Tsukada (2009) for an analysis of water provision by income groups in Bolivia. 3. We recognise, however, that choosing the fixed 5 per cent margin to all levels of progress may penalise countries that were doing very well in the earlier period (in the decade 1990–2000s). 4. Recall that for positive indicators, a lower bound is zero and the upper bound is 100 per cent. 5. Recall our definition of positive indicators as those whose level we wish to increase.
6. Available at . 7. An alternative approach would be first to average the indicators into the multi-indicator targets, and second to average the targets. 8. A caveat, however, is that the composition and number of indicators may differ from country to country. 9. Note that these statistics are not informative about the depth of the acceleration, though they account for the departure level through the effort appreciation correction with ε=1. 10. Note that the shares refer to the sample of countries for which complete data are available. These estimates may be over- or underestimated because of the exclusion of countries for which no data are available. For Goal 4, exceptionally, the estimation is fairly robust given that almost all countries have complete data in the full set of indicators.
International
Centre for Inclusive Growth International Policy Centre for Inclusive Growth (IPC - IG) Poverty Practice, Bureau for Development Policy, UNDP Esplanada dos Ministérios, Bloco O, 7º andar 70052-900 Brasilia, DF - Brazil Telephone: +55 61 2105 5000 E-mail:
[email protected] URL: www.ipc-undp.org