(PAM) [7]. PMDE, a tight clustering algorithm which can separate a set of scattered genes, and .... [5] X. Guo, R. Liu, C. D. Shriver, H. Hu, and M. N. Liebman. As-.
PROBABILISTIC FRAMEWORK FOR GENE EXPRESSION CLUSTERING VALIDATION BASED ON GENE ONTOLOGY AND GRAPH THEORY Yinyin Yuan and Chang-Tsun Li Department of Computer Science University of Warwick, Coventry, UK ABSTRACT Based on the correlation between expression and ontologydriven gene similarity, we incorporate functional annotations into gene expression clustering validation. A probabilistic framework is proposed to accommodate incomplete annotations, after establishing a new term-term distance measure based on graph theory. Comprehensive evaluations are performed on six clustering algorithms. This study is the first to explore a robust quantitative functional relationship between clusters of genes. Such indices assess clustering quality in terms of consistency of annotation information and serve as new tools for combining biological knowledge with experimental data. Index Terms— Gene expression, annotation, clustering validation, Gene Ontology, hypergeometric distribution 1. INTRODUCTION As one of the most important ontologies within the bioinformatics community, the Gene Ontology (GO) Consortium [1] is a structured vocabulary containing functional annotations of gene products. The three GO ontologies are biological process (BP), molecular function (MF) and cellular component (CC), each structured as a directed acyclic graph (DAG) with nodes representing the terms and directed edges representing parent-child relationships. Gene expression clustering has been an active research area. It aims at identifying co-regulated genes involved in regulated biological processes or groups that contain functionally related proteins such as enzymes for a specific pathway. However, the assignment of a gene to a certain cluster based on expression and genetic co-regulation based on current knowledge in transcriptomics do not necessarily coincide. Genes involved in a common pathway can end up in completely different clusters while genes with different functions can be assigned to the same cluster. The reasons are manifold. First, due to the limited knowledge in GO, some underlying regulations may be unknown. Other reasons lie mainly in the biological response and in the cluster algorithm itself. Cellular processes are affected by both up- and down- regulations and many processes are
only regulated by post-translational modifications. Notably, the cluster algorithms can be sensitive to statistical variation and noise. Such contradictions between statistical learning and current biological knowledge make the biological validation of clustering methodologies a challenging and interesting issue to investigate. Another problem making the validation even more difficult is the relatively incomplete knowledge in biological annotation even in the most well-studied organism; some may even be erroneous [3]. Ideally, such validity should be robust enough to accommodate incomplete annotations while computationally efficient enough to facilitate large-scale comparisons across different datasets. Also, it should take into account not only the sets of GO terms, but also the significance of each term to this particular set of genes as well as its importance to the whole GO structure. Cross-validation using different sources of information such as sequence similarity is also preferable. There have been a number of works dedicated to statistical validation of gene expression clustering. However, fewer solutions to systematically evaluating the clustering quality based on biological evidence have been presented. Semantic similarity measures between terms and between genes have been proposed (see [5] for a review). However, none of the above evaluates the feasibility of using semantic similarity in validating clustering algorithms while considering the inherent problems in annotation knowledge. To our knowledge, we are the first to propose a probabilistic technique that integrates the graph structure of GO and evaluate different gene expression clustering algorithms. 2. GO-DRIVEN VALIDITY For each cluster Ck , k ∈ {1, 2, ..., K} for a clustering outcome, the over-represented GO terms Tk = {t1 , t2 , ..., tL } can be identified by using the hypergeometric distribution [10] together with their corresponding p-values Pk = {p1 , p2 , ..., pL }. Suppose there are v genes annotated to a function in a total of u genes in the genome, the p-value of observing q or more genes in a cluster of size b annotated with this function is � � � q−1 � �� X b u−b u p[O ≥ q] = 1 − / (1) i v − i v i=0
GO:0006119
Over−represented terms
GO:0006118
0.744
All ancestors
0.727
GO:0016310
0.589 GO:0006091
that is more specific should be larger than to a more general child term. Therefore, edge weight between two terms tp , tc , if tp is a parent to tc in a GO graph, can be defined as:
0.536 GO:0046999 1.085 0.629
0.5
GO:0050794
0.905
GO:0000746
0.891
0.657
0.507
GO:0044237
0.74 0.527
GO:0051704
GO:0065007
1.205
GO:0009987 0.942
0.642
(2)
0.939
GO:0006793
0.557
GO:0050789
wc,p = 1.5 − IC(tp )/IC(tc )
GO:0006796
GO:0008152 0.83
GO:0008150
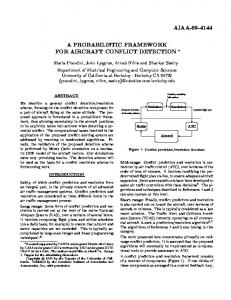
Fig. 1. A GO graph with four over-represented terms linking to all their ancestors until the root Biological Process (GO:0008150) is reached. The lower the p-value is, the more unlikely the null hypothesis that the terms appear by chance is true. These GO terms are of interest because they represent the most common functions shared by genes within a cluster. An induced GO relationship graph Gk for a cluster Ck can therefore be constructed using the most over-represented terms Tk as leaves, linking to all their ancestors until the root term, one of three ontologies, is reached. GO graphs are important because they provide straightforward representations of the functional groups with a set of genes. An example of such a GO graph is plotted in Fig.1. The edge weights are to be defined in Section 2.1. In particular, biological relevance of certain term to a specific cluster of genes can be measured by its corresponding p-value. Meanwhile, the information content (IC) [8] is a useful criterion for describing the specificity of a term regarding the whole population. The assumption is that the less occurrences, the more informative a term is since it is more specific. It is defined as the negative logarithm of the probability of observing a GO term or its offsprings in one of the ontologies, i.e., IC(t) = − Plog10 (f req(t)/f req(root)), while f req(t) = annot(t) + f req(children(t)) and annot(t) is the number of genes annotated with term t. We incorporate these information in our GO graphs and propose two graphbased cluster validity techniques. 2.1. Term-Term Distance First of all, to provide a functional distance measure between pairs of terms, we propose a graph-based strategy. As two terms can share parents via multiple paths in a GO graph, the distance between two terms, d(ti , tj ), is defined as the length of the shortest path, sp(ti , tj ), through which the two terms reach a shared parent, the lowest common ancestor (LCA). Since GO is a directed acyclic graph, uneven granularity and biological relevance of certain terms may be considered when evaluating the shortest distance between two distinct GO terms. For example, the distance from a node to its child
Since the information content of parent terms are always lower than that of child terms, edge weights defined in Eq. (2) are bounded in 0.5 ∼ 1.5. The more specific a child term is, the higher its information content is, thus the larger the weight of the edge is. Given a graph structure as described above, the term-term distance is X d(ti , tj ) = wx,y (3) edge(x,y)∈sp(ti ,tj )
2.2. Within-Cluster Compactness Intuitively, Within-Cluster Compactness aims to credit deeper GO graph with lower p-values while discouraging terms in different subgraphs with low p-values, since subgraphs represent different functional group. For example, the GO graph in Fig.1 has two big subgraphs. Meanwhile, the measure should be able to represent the large distance between node ’GO:0006119’ and node ’GO:0046999’ and their significance in terms of their p-values. Notably, if a cluster is not significantly enriched, e.g. for a certain p-value cut-off ρ, it has less GO terms that will contribute to distance measure, such a cluster should score less. Therefore, given a p-value cut-off ρ, Functional Compactness (FC) for a cluster Ck is defined: X log10 (pi )2 · d(ti , root) F Cρ (Ck ) = X
t ∈Tl
i X
log10 (pi ) · log10 (pj ) · d(ti , tj )
ti ∈Tl tj ∈Tl ,j6=i
(4) The further the terms are from root term (more specific) and the closer the terms are to each other (similar function), the higher the corresponding FC scores. For all clusters in a partition, the Within-Cluster Compactness (WCC) can be defined as PK ln|Ck | · F Cρ (Ck ) W CCρ = k=1PK (5) k=1 ln|Ck |
where |Ck | is the size of cluster Ck . Since smaller clusters tend to be easier to enrich with low p-values, the purpose of involving ln|Ck | is to encourage significantly enriched big clusters. W CCρ can serve as a measure for a clustering outcome in terms of its compactness in functional representation. 2.3. Between-Cluster Similarity Since an induced GO graph can be obtained using a certain number of over-represented GO terms from each cluster, K clusters can then be mapped to K induced GO graphs. The
idea is that the overlapping degree between two graphs can indicate their functional similarity, while the information content can be assigned as weights to the nodes to indicate their significance. If a specific term is shared in two graphs, it indicates more commonality between clusters than a general term. An extreme example is that the root term such as ’Biological Process’ is definitely shared. Cluster similarity can be used to indicate the overlapping degree between two clusters. For a specific partition, a set of graphs G = {G1 , ..., GK } each associated with a cluster are constructed. The functional similarity between two graphs can be defined as X IC(th ) Simn (Gi , Gj ) =
th ∈Gi ∩Gj
X
IC(th )
(6)
th ∈Gi ∪Gj
A large value indicates a higher level of similarity. BetweenCluster Similarity (BCS) can thus be used to identify well separated functional clusters. When n terms per cluster are used to construct the GO graphs, the BCS can be defined as P i6=j (1 + ln(n))ln|Ci | · ln|Cj | · Sim(Gi , Gj ) P BCSn = i6=j ln|Ci | · ln|Cj | (7) As the name indicates, the smaller this index is, the better the corresponding partition is since the functional clusters are well-separated.
3.1. Evaluation of six clustering algorithms We compare three unsupervised methods: Partial regression with Minimum Distance Estimator (PMDE) [11], SplineCluster [6] and MCLUST [4], and three heuristic methods: hierarchical clustering, K-means and Partitioning Around Medoids (PAM) [7]. PMDE, a tight clustering algorithm which can separate a set of scattered genes, and MCLUST, a widelyused model-based method, both give eight clusters as the best result for this dataset. By setting a threshold, SplineCluster, a Bayesian model-based hierarchical algorithm, also finds eight components. However, since PMDE can sift out a set of ten scattered genes, to facilitate fair comparison, they are discarded from experiments, leaving 374 genes for the algorithms to cluster. For the other three algorithms, which require the number of clusters as a priori knowledge, we give them eight as input. Thus all algorithms yield eight-cluster partitions. An important aspect of evaluating a validation method is to observe how much it can differentiate from random partitions. Therefore, in all of the experiments the mean of ten runs of random partitions is also compared. Hence, WCC and BCS values for seven partitions are plotted in Fig. 2 based on the three ontologies, respectively. We can observe that the random partition scores worst in terms of low WCC and high BCS. PMDE and PAM have the best performance. This is further confirmed by the V indices of the six algorithms and average of random partitions: 170, 81, 152, 108, 132, 166 and 40, respectively.
2.4. Combining WCC and BCS
3.2. Comparison of different cluster number
By pooling the WCCs of different p-value cut-offs ρ and the BCSs of consecutive number of terms n = {1, 2, ..., N } per cluster, the clustering algorithms’ functional validity, V , can be calculated by incorporating both WCC and BCS indices from all ontologies in the following formula: X 2 2 2 ) (W CCρ,MF + W CCρ,BP + W CCρ,CC
To test if the indices can help to find the optimal number of clusters, we obtain partitions of different numbers of clusters (5 ∼ 12) by PMDE. The corresponding V values for these partitions are: 279, 160, 166, 170, 149, 110, 98 and 93. The five-cluster partition scores top, reflecting the fact that this dataset is annotated to five cell cycle phases. Meanwhile, the choice of eight as number of cluster, which is regarded as the optimum by both PMDE and MCLUST, suggests new functional associations, based on its corresponding V index that ranks second. Since pathways have a hierarchical structure, expressions of genes involved in subpathways can be clustered into subclusters. As stated previously, existing functional annotation is incomplete. Therefore, the eight-cluster partition may suggest that it represents the next available subclusters in the pathway hierarchy.
V =
∀ρ
N X
(8)
2 (BCSn,MF n=1
+
2 BCSn,BP
+
2 BCSn,CC )
The reason of using square form is to stress any strong relationships in any of the three aspects of ontology. And since this measure does not depend on the cluster number, partitions with different numbers of clusters can be compared. 3. EXPERIMENTS
4. CONCLUSIONS
A subset of Yeast Cell Cycle data by Spellman et al.[9] is used in our experiments. The expressions of 384 genes from Saccharomyces Cerevisiae measured at 17 time points have peak time in five different cell cycle phases: Early G1(G1E), late G1(G1L), S, G2 and M.
To investigate how genes within a cluster are functionally related, and how clustering helps distinguish such functional groups, we proposed Within-Cluster Compactness for an overall measure of the functional homogeneity of genes within clusters, and Between-Cluster Similarity for evaluating the
0.004
0.3 0.2 0.1
Between−Cluster Similarity
0.4 0.000
0.008
5
p−value cutoff
10
15
20
Number of terms per cluster
(f) BCSn,BP 5. REFERENCES
−2 0.000
0.004
0.15 0.10
PMDE SplineCluster MCLUST Hierarchical K−means PAM Random
0.05
Between−Cluster Similarity
0
PMDE SplineCluster Hierarchical K−means MCLUST PAM Random
0.00
2
4
6
8
0.20
(a) W CCρ,BP
Within−Cluster Compactness
PMDE SplineCluster MCLUST Hierarchical K−means PAM Random
0.0
30 20 10 0
Within−Cluster Compactness
PMDE SplineCluster Hierarchical K−means MCLUST PAM Random
0.008
5
p−value cutoff
10
15
20
Number of terms per cluster
(e) BCSn,MF
0.000
0.004
0.008
p−value cutoff
(c) W CCρ,CC
0.6 0.5 0.4 0.3
Between−Cluster Similarity
PMDE SplineCluster MCLUST Hierarchical K−means PAM Random
0.2
20 15 10 5 0
Within−Cluster Compactness
0.7
(b) W CCρ,MF
PMDE SplineCluster Hierarchical K−means MCLUST PAM Random
tionships between gene products that would not be possible if the GO structures are compared empirically. In addition, it provides a mean for identification of functionally related gene products. Such measure should equip biologists a new tool in their repertoire. The advantages of our probabilistic validation technique include its robustness to noise and error, and ability to accommodate overlapping clusters. Notably, all annotation-based validation greatly depend on the completeness and reliability of the database. An important role of comparisons between different resources such as protein sequence annotation and experimental data such as gene expression is to identify such annotation and infuse new ones.
5
10
15
20
Number of terms per cluster
(f) BCSn,CC
Fig. 2. Plots of WCC (a),(b),(c) and BCS (d), (e), (f) for six clustering algorithms and an average of ten random runs based on three ontologies BP, MF and CC, respectively functional separability of various clustering algorithms, both based on the cluster-specific GO relationship graphs. Concretely, the correlation was established between semantic similarity and relevant genome resources such as gene expression data and protein sequences [2]. To take advantage of the semantic similarity in cluster validity research, a mathematical measure of distance between annotations is of crucial importance. It enables large-scale predictions of rela-
[1] M. Ashburner, C. A. Ball, J. A. Blake, D. Botstein, H. Butler, J. M. Cherry, A. P. Davis, K. Dolinski, S. S. Dwight, J. T. Eppig, M. A. Harris, D. P. Hill, L. Issel-Tarver, A. Kasarskis, S. Lewis, J. C. Matese, J. E. Richardson, M. Ringwald, G. M. Rubin, and G. Sherlock. Gene ontology: tool for the unification of biology. Nat Genet, 25(1):25–29, May 2000. [2] F. Azuaje and O. Bodenreider. Incorporating ontologydriven similarity knowledge into functional genomics: An exploratory study. In BIBE ’04: Proceedings of the 4th IEEE Symposium on Bioinformatics and Bioengineering, page 317, Washington, DC, USA, 2004. IEEE Computer Society. [3] D. Devos and A. Valencia. Intrinsic errors in genome annotation. Trends in Genetics, 17(8):429–431, August 2001. [4] C. Fraley and A. Raftery. Model-based clustering, discriminant analysis, and density estimation. Journal of the American Statistical Association, 97(458):611–631, June 2002. [5] X. Guo, R. Liu, C. D. Shriver, H. Hu, and M. N. Liebman. Assessing semantic similarity measures for the characterization of human regulatory pathways. Bioinformatics, 22(8):967– 973, 2006. [6] N. A. Heard, C. C. Holmes, and D. A. Stephens. A quantitative study of gene regulation involved in the immune response of anopheline mosquitoes: An application of bayesian hierarchical clustering of curves. Journal of the American Statistical Association, 101(473):18–29, 2006. [7] L. Kaufman and P. Rousseeuw. Finding Groups in Data: An Introduction to Cluster Analysis. John Wiley and Sons, New York, 1990. [8] P. Resnik. Semantic similarity in a taxonomy: An informationbased measure and its application to problems of ambiguity in natural language. Journal of Artificial Intelligence Research, 11:95–130, 1999. [9] P. Spellman, G. Sherlock, M. Zhang, V. Iyer, K. Anders, M. Eisen, P. Brown, D. Botstein, and B. Futcher. Comprehensive identification of cell cycle-regulated genes of the yeast Saccharomyces cerevisiae by microarray hybridization. Mol Biol Cell, 9(12):3273–97, Dec 1998. [10] S. Tavazoie, J. Hughes, M. Campbell, R. Cho, and G. Church. Systematic determination of genetic network architecture. Nat Genet, 22(3):281–285, 1999. [11] Y. Yuan and C. T. Li. Partial mixture model for tight clustering in exploratory gene expression analysis. Proc. BIBE International Symposium on BioInformatics and BioEngineering.