West Mifflin, Pennsylvania 15122. ABSTRACT. There is a growing awareness that environmentally assisted creep plays an important role in intergranular stress ...
Proceedings of International Symposium on Plant Aging and Life Predictions of Corrodible Structures, May 15-18, 1995, Sapporo, Japan
THERMALLY ACTIVATED DISLOCATION CREEP MODEL
FOR PRIMARY WATER STRESS CORROSION CRACKING
OF NiCrFe ALLOYS
M. M. Hall, Jr.
Bettis Laboratory
Westinghouse Electric Corporation
West Mifflin, Pennsylvania 15122
ABSTRACT
There is a growing awareness that environmentally assisted creep plays an important role in intergranular stress corrosion cracking (IGSCC) of NiCrFe alloys in the primary coolant water environment of a pressurized water reactor (PWR). The expected creep mechanism is the thermally activated glide ofdislocations. This mode ofdeformation is favored by the relatively low temperature ofPWR operation combined with the large residual stresses that are most often identified as responsible for the SCC failure ofplant components. Stress corrosion crack growth rate (CGR) equations that properly reflect the influence ofthis mechanism of crack tip deformation are required for accurate component life predictions. A phenomenological IGSCC-CGR model, which is based on an apriori assumption that the IGSCC-CGR is controlled by a low temperature dislocation creep mechanism, is developed in this report. Obstacles to dislocation creep include solute atoms such as carbon, which increase the lattice friction force, and forest dislocations, which can be introduced by cold prestrain. Dislocation creep also may be environmentally assisted due to hydrogen absorption at the crack tip. The IGSCC-CGR model developed here is based on an assumption that crack growth occurs by repeated fracture events occurring within an advancing crack-tip creep-fracture zone. Thermal activation parameters for stress corrosion cracking are obtained by fitting the CGR model to IGSCC-CGR data obtained on NiCrFe alloys, Alloy X-750 and Alloy 600. These IGSCC-CGR activation parameters are compared to activation parameters obtained from creep and stress relaxation tests. Recently reported CGR data, which exhibit an activation energy that depends on yield stress and the applied stress intensity factor, are used to benchmark the model. Finally, the effects of matrix carbon concentration, grain boundary carbides and absorbed hydrogen concentration are discussed within context of the model. Keywords: stress corrosion cracking, crack growth rate, models, creep, NiCrFe alloys INTRODUCTION
Recently discovered intergranular stress corrosion cracking (IGSCC) of Alloy 600 components in the primary water circuits of commercial nuclear power reactors! has renewed interest in obtaining a more fundamental understanding ofthe IGSCC ofNiCrFe alloys. An improved understanding of IGSCC and the availability of a physically based quantitative IGSCC crack growth rate (CGR) model could potentially prevent significant economic losses for electric-power utilities that operate nuclear reactors. Unfortunately, a thorough scientific understanding of stress corrosion mechanisms does not exist today and cannot reasonably be expected for some time. However, reliable models having engineering utility often can be developed for complex physical processes using phenomenological modelling methods. A phenomenological model of environmentally assisted crack growth must be
functionally descriptive of the physical processes that are considered to be controlling the crack growth rate. Mechanistic models and the results of controlled laboratory experiments provide insight into the selection of the appropriate mathematical relationships. In developing the phenomenological model, all model variables and parameters are chosen so as to be relatable to engineering parameters. The model parameters are obtained by fitting the model to the available experimental data. The range of each parameter may have to be statistically broadened to obtain satisfactory comparisons between predictions of the model and field experience. To gain acceptance for use, the model must describe all features of the data considered important and no assumption or prediction ofthe model can be in contradiction with other known experimental facts and established physical understanding. When successfully applied, this phenomenological approach results in engineering methods of component failure prevention that are logical, internally
107
consistent and are less reliant on engineering judgement.
and the applied stress,
(J,
can be written as:
. .
Evidence for the Influence of Dislocation Creep in SCC
(AG(O»).
e=eexp-
There is a growing awareness that environmentally assisted creep plays an important role in primary water stress corrosion cracking ofNiCrFe alloys. Was and co-workers 24 have reported on the influence of microstructure on the IOSCC and creep deformation of controlled impurity Alloy 600-type alloys in high purity water. Their results show that creep modes of fracture play an important role in IOSCC of these alloys. They conclude that dislocation-controlled creep is the operative creep mechanism based on their observation oflarge stress exponents in their creep rate-stress correlations. Bousier et al. 5 have reported on the influence of mechanical parameters and the water environment on the IOSCC and creep deformation of Alloy 600 and the creep deformation of Alloy 690 in pressurized water reactor (PWR) primary water. Based on their constant extension rate and stress controlled creep tests, they conclude that strain rate is the mechanical parameter that controls the IOSCC crack propagation rate. Their creep test results show that the high-stress low , , temperature creep rates of Alloy 600 and Alloy 690 in water are two to three times the rates attained in air.
(1)
RT
S
In this equation 110 is the Oibbs free energy and R is the universal gas constant. The pre-exponential factor, t s' is an intrinsic strain rate that is proportional to the density of mobile dislocations, the distance between short range obstacles and the thermal-activation frequency. UJ ::J
:; "0 00.0025
:2 .... co ~
Diffusion AsSisted Flow
0.002
@.
Athermal --Flow Stress
UJ UJ
(J) 0,0015 ....
i --~-------~ ,,
U5
Athe'rmal Temperature
"0 (J)
>=
,
0.001 -
I I
'--~--'_-'---I._.~
o
200
400
I
"
600
800
Temperature (K)
Thermally Activated Dislocation Creep Model
.
~
1,000
1,200
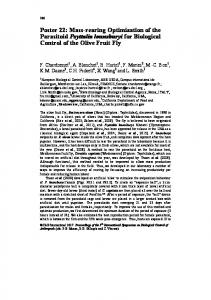
FIGURE 1. Alloy 600 Yield Stress Normalized by the Due to the relatively low temperature ofPWR operation and the large residual stresses that are most often identified as responsible for IOSCC failures of reactor components, 6 the expected creep mechanism is thermally activated glide of dislocations. This deformation mechanism is enabled by the thermal agitation of the metal lattice and can operate at temperatures less than about 0.35 ofthe melting temperature. , The lattice friction stress and short range obstacles combine '., to establish a threshold stress for dislocation slip. As the temperature is reduced, the thermal energy available to overcome obstacles to dislocation glide is reduced and the yield stress increases. This is illustrated by the temperature dependence ofthe Alloy 600 yield stress as shown by the data of Mulford and Kocks7 in Fig. 1. Indicated in this figure is the so-called athermal temperature, To, at which thermal activation is sufficient to overcome short range obstacles but not long range obstacles. Analysis of these data yields an athermal temperature of 668 K. The yield stress at this temperature is due to long range obstacles. It is termed the athermal stress and is designated here as the threshold stress, (Jth'
As shown by Kocks, et al. 8 in their treatise on the thermodynamics and kinetics of dislocation slip, the rate equation that relates creep strain rate, t, to temperature, T,
Shear Modulus. Data From Ref. 7. As shown in the Appendix, Eq.(1) can be specialized to represent creep by the thermally activated glide of dislocations. The applied stress component that is required to overcome resistance to deformation by this mechanism is commonly called the "effective" stress. A normalized effective applied stress as defined in the Appendix, is given by (2)
The subscript s refers to the maximum or "saturation II internal stress generated in overcoming the obstacles to dislocation glide at absolute zero. For stresses above the saturation stress, dislocations can find no equilibrium positions. Consequently, large scale slip, followed by a rapid approach to mechanical instability, will occur. As shown in the Appendix, the deformation rate equation can be expressed in terms of the effective stress and energy parameters:
AH*[
& exp ___0_ 1 S RT*
{
108
(3)
The asterisk indicates~ffectiveparameters asd~fined in the Appendix. The stress exponent pin Eq.(3) has a value less than or equal to one and greater than or equal to zero. A value of I is chosen for q. The effective activation enthalpy, LlHo', is the activation energy associated with the short-range obstacles only. The effective temperature, T·, is defined by
1
T*
1 T
1
(4)
To
IGSCC - CGR MODEL DEVELOPMENT We assume that stress corrosion crack advance occurs by a process of creep fracture of a crack tip region having a characteristic size, rc' Repetition of this process results in sustained crack growth. If a critical creep strain, to' is required for fracture of this zone, the crack growth rate is
a=
val ues Kth and Kg, respecti vel y. Note that t!he sa~ation stress intensity factor, analogous to O"g, is a mechanical instability parameter that has a maximum value at absolute zero. With the introduction ofthe threshold and saturation stress intensity factors, a normalized effective applied stress intensity factor can be defined, analogous to Eq.(2), by
rce ct
(5)
a
Crack Tip.(~t~ess
l>
We assume that during the time interval between CFZ fracture events the crack is stationary and that the creep deformation is confined within the CFZ. Furthermore, the CFZ is assumed to be small, compared to the dimensions of the crack tip plastic zone, so that the variation ofstress within the CFZ is small. The stress within the crack tip CFZ will decrease somewhat due to creep relaxation during the interval between fracture events. However, we assume that the CFZ stress is constantin time and is established by the time independent stress that exists at the boundary ofthe CFZ and the plastic zone into which the IGSCC crack advances when the CFZ fractures. We now introduce material parameters ~ and Ks' These parameters are defined so that the applied stress within the CFZ is equal to the threshold stress, O"lh' and the saturation stress, O"g, when the applied stress intensity factor has the
K-Kth
K*s
K s -Kth
(6)
We now establish a phenomenological relationship between the normalized effective applied stress within the CFZ and the normalized effective applied stress intensity factor, which are defined by Eq.(2) and Eq.(6), respectively. An analytical relationship that relates the stress within the crack tip plastic zone to the applied stress intensity factor has been derived by Hutchinson,1O Rice and Rosengren l1 . This relationship is derived from the deformation theory of plasticity for conditions of small scale plasticity and is given by
Ec
The size, r e, of this crack-tip creep-fracture zone (CFZ), depends on the micromechanism of crack advance 9, which may be influenced by environmental effects and dimensions of microstructural features, within and surrounding the CFZ. The Alloy 600 creep data of Boursier, et aL 5 show that the creep strain rate decreases with time, which is consistent with the expectation that strain hardening will dominate any recovery mechanism that may operate at the low temperatures assumed for a thermally activated creep mechanism of IGSCC. Therefore the crack tip strain rate, I\t, in the above equation is,t\lken to represent the average rate during the time between CFZ fracture events.
K*
Oo(
K O"o..{ii:i
)n:l.
(7)
In this equation 0"0 is the material flow stress, K is the applied stress intensity factor, r is the distance fromthe crack tip, n is the inverse ofthe strain hardening exponent and ex is a slowly varying function of n having a value of4n: for plane strain and for stresses within the elastic limit (n == 1). Eq.(7) shows that, within the plastic zone, which surrounds the CFZ, there is a nonlinear relationship between the local stress and the stress intensisty factor. We assume that, within the CFZ, a mathematically similar relationship exists between the effective stress and the effective stress intensity factor. Using this assumption, for r :::;; re l we can write:
0*
(8)
bK*m.
In this equation, b is a constant and m is expected to be a function of the strain hardening exponent, lin. Using the normalizations introduced above in Eq.(2) and Eq.(6), Eq.(8) can be written
O-Oth
as -Oth
K-Kth (
)m,
(9)
Ks -Kth
Eq.(9) can now be substituted into Eq.(3) to obtain the crack
109
tip strain rate, which can in tum be substituted into Eq.(5) to obtain an expression for the IGSCC crack growth rate.
IGSCC Crack Growth Rate Equation and Apparent Activation Energy Now the crack growth rate equation, Eq.(5), becomes
a.
:=
r e ~exp Ec
{AH:[ - - - 1- (K-K ]P]}(lO) RT* Ks -K th. th
The apparent activation energy, Q, is given by
Q
(11)
Note that, in order to avoid unnecessarily introducing another stress exponent, the stress intensity factor exponent, p, in these equations, should be understood as the product of the stress exponent, p, and stress intensity factor exponent, m, in Eq.(3) and Eq.(8), respectively. These equations were fit to IGSCC data obtained on Alloy 600 materials that, due to application of a range of cold prestrain, have a range ofyield stress, and therefor, a range of strain hardening. Fitting Eq.(IO) to these IGSCC data confirmed that, for values of n less than about 4, the stress intensity factor exponent p is equal to 2/(n+I), as suggested by Eq. (7). However, an alternate expression for p, which has 2/(n+ 1) as a limit for small values of n, is required to obtain a good fit for materials having large n (large yield strength). This is believed to be due to extraplolation beyond the data range for which the expression for n, Eq.(15), was derived. Fitting Eq.(11) to the IGSCC data showed that, when the normalized effective stress intensity approaches 1, the apparent activation energy does not reduce 'to zero as predicted. To account for this, Eq.(ll) was modified:
data, obtained on NiCrFe alloys, that are suitable for benchmarking the IGSCC-CGR model. The best available data are from the work by Shen and Shewmon l2 and Speidel and Magdowski 13. However, there are limitations to each of these data sets. Both sets of data were obtained on displacement controlled specimens, which results in a decreasing stress intensity factor as crack growth occurs. Crack growth rates were determined by Shen and Shewmon using in-situ measurements ofcrack length but their tests were conducted in steam, instead ofwater. Speidel and Magdowski obtained crack growth rates from measurements of average crack extension divided by the total exposure time. Their rates do not, therefore, account for the time to the onset of IGSCC crack growth. The Shen-Shewmon data obtained . on Alloy X-750 and Alloy 600 are shown in Fig. 2 and Fig. 4. The Speidel-Magdowski data obtained on Alloy 600 are shown in Fig. 3, Fig. 5 and Fig. 6. Note that the best fit Arrehnius curves for each data set in Fig. 2 and Fig. 3 were adjusted slightly to intersect at a common athermal temperature, To' The Shen-Shewmon data are best fit using an athermal temperature of 682 K while the Speidel Magdowski data could be fitted reasonably well using the value of 668 K obtained from the data in Fig. 1. Results of the data fitting are given in Table I in the Discussion section. The expression for the inverse hardening exponent, n in Eq.(15), was obtained from the stress-strain data reported by Webb and Ha1l 14 . In this equation, Sy is the yield stress.
1E-07
E--'================::::;-i • X-750 60.8 32.2~ "" "I
:€
-
E
a:
..c: 1E-09
~
CJ
\
'".\,
\,
..».
\ "
\ '~
U 1E-10
, ,- "...
\
\
0,
,
,'0
\
'\
",
~'~ '"
\,,',
\. :.\
Q'
\,
\
" ,,
"
1E-11 L-~__~__~~~'~~--~'--~~~--~ 0.0014 0.0016 0.0018 0.002 0.0022
A similar modification of Eq. (10) is provided below as Eq.(13). The physical meaning of this added activation enthalpy term is discussed below.
IGSCC CRACK GROWTH RATE DATA
AND DATA CORRELATIONS
I
al
1U
g
(12)
~ ~~,;~,Q""
, ',- Stress Intensity Factor (MPavm)
1E-08
.:rt:.
Q
A600
Reciprocal Temperature, 1/T, (1/K) FIGURE 2. Effect of Temperature and Stress Intensity Factor on Crack Growth Rate. Data From Ref. 12.
There are few primary water IGSCC crack growth rate
110
. MOO
1E·07 kr;;:---::-,----=========~
\~,' ....
~1E-08
".
.
"
Q)
i,.
..',
',,~
~
•
0.0018
.....
iii
--
I
u
'..,
.,
....co
()
1E-11
"
f
1E-12
'. I
0.0016
--.
~
•
~
1E-11 I 0.0014
_
f //
~
". t
f.'
..... _-
~ 1E-10
"
1E-10
-
1/./'
.t::
o
~
f ",-
i' &!. 1E-09
'
,
,.-.-.-.-.--.-.-.-.-'-.-~=~=;~~.-.
1E-08 K = 20 - 35 MPaV'm
0,
ta [(
o
-~~.~E. ~;3__e,l~_ ~~-l
2
T(I