); and additional tags correspond to non-linguistic features of blogs— for instance, and were used the mark the start and end of individual blogs posts. Word n-gram approaches provide a large feature space with which to work. But in the general interest of computational tractability, it is useful to reduce the size of the feature set. There are many automatic approaches to feature selection, exploiting, for instance, information gain (Quinlan, 1993). However, ‘manual’ methods can offer principled ways of both reducing the size of the set and avoiding overfitting. We therefore explore the effect of different levels of restriction on the feature sets, and compare them with automatic feature selection. The levels of restriction are as follows:
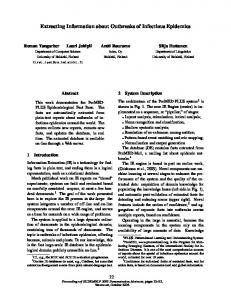
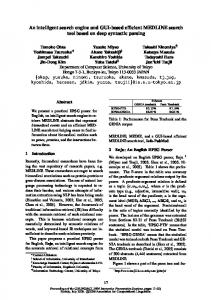
5. Following Task-4, this uses the most distinct high (H) and low (L) groups, but now considers all remaining subjects medium (M). 6. Following Task-2, this uses the larger high (hH) and low (Ll) groups, with all those in between forming the medium (m) group. 7. Using the distinction between the high and low groups of Task-5 and -6, this creates a 5-way split: highest (H), relatively high (h), medium (m), relatively low (l) and lowest (L). With the greatest number of classes, this task is the hardest. These sub-groups are tabulated in Table 2, giving the size of each group within each trait.
4 5 6 7 N4 N5 N6 N7 E4 E5 E6 E7 A4 A5 A6 A7 C4 C5 C6 C7
L L
Lowest – Ll
L 12 12
l – 25
12 11 11
13 – 23
11 11 11
12 – 22
11 11 11
11 – 17
11
6
... m M m m 24 46 24 24 24 48 24 24 28 47 28 28 27 46 27 27
Feature selection
I The least restricted feature set consists of the n-grams most commonly occurring within the blog corpus. Therefore, the feature set for each personality dimension is to be drawn from the same pool. The difference lies in the number of features selected: the size of the set will match that of the next level of restriction.
Highest – H H hH h H – 13 13 22 9 13 – 12 12 24 12 12 – 13 13 21 8 13 – 14 14 27 13 14
II The next set includes only those n-grams which were distinctive for the two extremes of each personality trait. Only features with a corpus frequency ≥5 are included. This allows accurate log-likelihood G2 statistics to be computed (Rayson, 2003). Distinct collocations are identified via a three way comparison between the H and L groups in Task-1 (see section 4.2.1) and a third, neutral group. This neutral group contains all those individuals who fell in the medium group (M) for all four traits in the study; the resulting group was of comparable size to the H and L groups for each trait. Hence, this approach selects features using only a subset of the corpus. Ngram software was used to identify and count collocations within a sub-corpus (Banerjee
Table 2: 3-way/5-way task groups: division method and author numbers. N = Neuroticism; E = Extraversion; A = Agreeableness; C = Conscientiousness.
630
and Pedersen, 2003). For each feature found, its frequency and relative frequency are calculated. This permits relative frequency ratios and log-likelihood comparisons to be made between High-Low, High-Neutral and LowNeutral. Only features that prove distinctive for the H or L groups with a significance of p < .01 are included in the feature set.
N E A C
I 747 701 823 704
II 747 701 823 704
III 169 167 237 197
IV 22 11 36 22
V 19 20 34 25
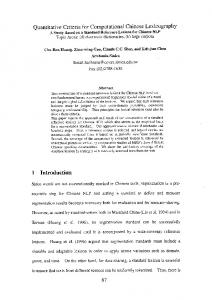
Table 3: Number of n-grams per set.
III The next set takes into account the possibility that, for a group used in Level-II, an ngram may be used relatively frequently, but only because a small number of authors in a group use it very frequently, while others in the same group use it not at all. To enter the Level-III set, an n-gram meeting the Level-II criteria must also be used by at least 50%1 of the individuals within the subgroup for which it is reported to be distinctive.
N
E
A
IV While Level-III guards against excessive individual influence, it may abstract too far from the fine-grained variation within a personality trait. The final manual set therefore includes only those n-grams that meet the Level-II criteria with p < .001, meet the Level-III criteria, and also correlate significantly (p < .05) with individual personality trait scores.
C
Low [was that] [NP1
NP1] [
after] [is that] [point in] [last night
] [it the] [is to] [thank god] [have any] [have to] [turn up] [a few weeks] [case
] [okay
] [the game]
High [this year] [to eat] [slowly
] [and buy] [and he] [cool
] [
NP1] [to her] [this is not] [
it is] [
after] [not have] [by the way] [
i hope] [how i] [kind of]
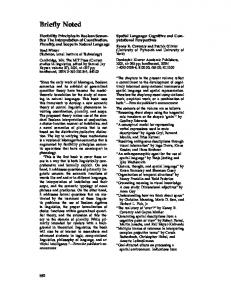
Table 4: Examples of significant Low and High n-grams from the Level-IV set.
V Finally, it is possible to allow the n-gram feature set to be selected automatically during training. The set to be selected from is the broadest of the manually filtered sets, those n-grams that meet the Level-II criteria. The approach adopted is to use the defaults within the WEKA toolkit: Best First search with the CfsSubsetEval evaluator (Witten and Frank, 1999).
pus for Level-I matches the size of the set for Level-II. In addition, the features automatically selected are task-dependent, so the Level-V sets vary in size; here, the Table shows the number of features selected for Task-2. To illustrate the types of n-grams in the feature sets, Table 4 contains four of the most significant n-grams from Level-IV for each personality class.
Thus, a key question is when—if ever—a ‘manual’ feature selection policy outperforms the automatic selection carried out under Level-V. LevelsII and -III are of particular interest, since they contain features derived from a subset of the corpus. Since different sub-groups are considered for each personality trait, the feature sets which meet the increasingly stringent criteria vary in size. Table 3 contains the size of each of the four manuallydetermined feature sets for each of the four personality traits. Note again that the number of ngrams selected from the most frequent in the cor-
5
Results
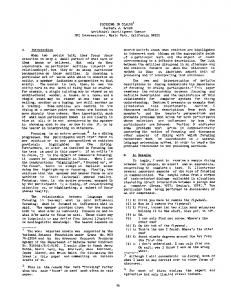
For each of the 60 binary classification tasks (1 to 3), the performance of the two approaches was compared. Na¨ıve Bayes outperformed Support Vector Machines on 41/60, with 14 wins for SVM and 5 draws. With limited space available, we therefore discuss only the results for NB, and use NB for Task-4 to -7. The results for the binary tasks are displayed in Table 5. Those for the multiple tasks are displayed in Table 6. Baseline is the majority classification. The most accurate performance of a feature set for each task is highlighted
1 Conservatively rounded down in the case of an odd number of subjects.
631
Task N1 N2 N3 E1 E2 E3 A1 A2 A3 C1 C2 C3
Base 52.0 53.2 54.9 52.2 51.1 54.9 54.2 51.2 52.1 56.0 61.2 57.7
Task N4 N5 N6 N7 E4 E5 E6 E7 A4 A5 A6 A7 C4 C5 C6 C7
Lv.I Lv.II Lv.III Lv.IV Lv.V 52.0 92.0 84.0 96.0 92.0 51.1 63.8 68.1 83.6 85.1 54.9 60.6 53.5 71.9 83.1 56.5 91.3 95.7 87.0 100.0 44.7 74.5 72.3 66.0 93.6 50.7 53.5 59.2 64.8 85.9 62.5 100.0 100.0 95.8 100.0 60.5 81.4 79.1 72.1 97.7 53.5 60.6 69.0 66.2 93.0 52.0 100.0 100.0 84.0 92.0 54.5 77.3 81.8 72.7 93.2 54.9 63.4 71.8 70.4 84.5
Table 5: Na¨ıve Bayes performance on binary tasks. Raw % accuracy for 4 personality dimensions, 3 tasks, and 5 feature selection policies.
Lv.II Lv.III Lv.IV 81.6 65.3 77.6 76.1 67.6 67.6 47.9 46.5 66.2 49.3 38.0 42.3 74.5 59.6 53.2 83.1 67.6 54.9 53.5 46.5 46.5 39.4 29.6 38.0 90.4 78.8 67.3 83.1 84.5 74.6 67.6 60.6 56.3 69.8 60.6 50.7 92.3 65.4 67.3 74.6 69.0 62.0 59.2 59.2 50.7 62.0 45.1 45.1
Lv.V 85.7 94.4 70.4 47.9 78.7 90.1 56.3 40.8 80.8 80.3 85.9 47.9 82.7 83.1 78.9 49.3
Discussion (45.8% relative improvement; we report relative improvement over baseline because baseline accuracies vary between tasks). The best performance for Neuroticism was returned by Level-IV. The accuracy of 83.6% represents a 30.4% absolute improvement over baseline (57.1% relative improvement). Argamon et al.’s feature set combined insights from computational stylometrics (Koppel et al., 2002; Argamon et al., 2003) and systemicfunctional grammar. Their focus on function words and appraisal-related features was intended to provide more general and informative features than the usual n-grams. Now, it is unlikely that weblogs are easier to categorise than the genres studied by Argamon et al. So there are instead at least two reasons for the improvement we report. First, although we did not use systemicfunctional linguistic features, we did test n-grams selected according to more or less strict policies. So, considering the manual policies, it seems that the Level-IV was the best-performing set for Neuroticism. This might be expected, given that Level-IV potentially overfits, allowing features to be derived from the full corpus. However, in spite of this, Level-II pproved best for Extraversion. Secondly, in classifying an individual as high or low on some dimension, Argamon et al. had
Let us consider the results as they bear in turn on the three main questions posed earlier: Can we improve on Argamon et al.’s (2005) performance on binary classification for the Extraversion and Neuroticism dimensions? How accurately can we classify on the four personality dimensions? And how does performance on multiple classification compare with that on binary classification? Before addressing these questions, we note the relatively good performance of NB compared with ‘vanilla’ SVM on the binary classification tasks. We also note that automatic selection generally outperforms ‘manual’ selection; however overfitting is very likely when examining just 71 data points. Therefore, we do not discuss the Level-V results further. 6.1
Lv.I 49.0 60.6 31.0 31.0 44.7 60.6 23.9 44.7 51.9 59.2 31.0 33.8 53.8 62.0 39.4 36.6
Table 6: Na¨ıve Bayes performance on multiple tasks. Raw % accuracy for 4 personality dimensions, 4 tasks, and 5 feature selection policies.
in bold while the second most accurate is marked italic.
6
Base 49.0 64.8 35.2 33.8 51.1 67.6 33.8 33.8 53.8 66.2 39.4 39.4 51.9 64.8 38.0 38.0
Extraversion and Neuroticism
The first main question relates to the feature sets chosen, because the main issue is whether word ngrams can give reasonable results on the Extraversion and Neuroticism classification tasks. Of the current binary classification tasks, Task-2 is most closely comparable to Argamon et al.’s. Here, the best performance for Extraversion was returned by the ‘manual’ Level-II feature set, closely followed by Level-III. The accuracy of 74.5% represents a 23.4% absolute improvement over baseline 632
performance. There are also general results on human personality classification performance in computer-mediated communication, which suggest that at least some dimensions can be accurately judged even when computer-mediated. Vazire and Gosling (2004) report that for personal websites, relative accuracy of judgment was, in descending order: Openness > Extraversion > Neuroticism > Agreeableness > Conscientiousness. Similarly, Gill et al. (2006) report that for personal e-mail, Extraversion is more accurately judged than Neuroticism. The current study does not have a set of human judgments to report. For now, it is interesting to note that the performance profile for the best classifiers, on the simplest tasks, appears to diverge from the general human profile, instead ranking on raw accuracy: Agreeableness > Conscientiousness > Neuroticism > Extraversion.
(for some of their materials) 500 words from that individual, whereas we had approximately 5000 words. The availability of more words per individual is to likely to help greatly in training. Additionally, a greater volume of text increases the chances that a long term ‘property’ such as personality will emerge 6.2
Binary classification of all dimensions
The second question concerns the relative ease of classifying the different dimensions. Across each of Task-1 to -3, we find that classification accuracies for Agreeableness and Conscientiousness tend to be higher than those for Extraversion and Neuroticism. In all but two cases, the automatically generated feature set (V) performs best. Putting this to one side, of the manually constructed sets, the unrestricted set (I) performs worst, often below the baseline, while Level-IV is the best for classifying each task of Neuroticism. Overall, II and III are better than IV, although the difference is not large. As tasks increase in difficulty—as high and low groups become closer together, and the left-out middle shrinks—performance drops. But accuracy is still respectable. 6.3
7
Conclusion and next steps
This paper has reported the first stages of our investigations into classification of author personality from weblog text. Results are quite promising, and comparable across all four personality traits. It seems that even a small selection of features found to exhibit an empirical relationship with personality traits can be used to generate reasonably accurate classification results. Naturally, there are still many paths to explore. Simple regression analyses are reported in Nowson (2006); however, for classification, a more thorough comparison of different machine learning methodologies is required. A richer set of features besides n-grams should be checked, and we should not ignore the potential effectiveness of unigrams in this task (Pang et al., 2002). A completely new test set can be gathered, so as to further guard against overfitting, and to explore systematically the effects of the amount of training data available for each author. And as just discussed, comparison with human personality classification accuracy is potentially very interesting.
Beyond binary classification
The final question is about how classification accuracy suffers as the classification task becomes more subtle. As expected, we find that as we add more categories, the tasks are harder: compare the results in the Tables for Task-1, -5 and -7. And, as with the binary tasks, if fewer mid-scoring individuals are left out, the task is typically harder: compare results for Task-4 and 5. It does seem that some personality dimensions respond to task difficulty more robustly than others. For instance, on the hardest task, the best Extraversion classification accuracy is 10.9% absolute over the baseline (32.2% relative), while the best Agreeableness accuracy is 30.4% absolute over the baseline (77.2% relative). It is notable that the feature set which return the best results—bar the automatic set V— tends to be Level-II, excepting for Neuroticism on Task-6, where Level-IV considerably outperforms the other sets. A supplementary question is how the best classifiers compare with human performance on this task. Mishne (2005) reports that, for general mood classification on weblogs, the accuracy of his automatic classifier is comparable to human
However, it does seem that we are making progress towards being able to deal with a realistic task: if we spot a thumbs-up review in a weblog, we should be able to check other text in that weblog, and tell whose thumb it is; or more accurately, what kind of person’s thumb it is, anyway. And that in turn should help tell us how high the thumb is really being held. 633
8
Acknowledgements
Gilad Mishne. 2005. Experiments with mood classification in blog posts. In Proceedings of ACM SIGIR 2005 Workshop on Stylistic Analysis of Text for Information Access.
We are grateful for the helpful advice of Mirella Lapata, and our three anonymous reviewers. The second author was supported by a studentship from the Economic and Social Research Council.
Scott Nowson. 2006. The Language of Weblogs: A study of genre and individual differences. Ph.D. thesis, University of Edinburgh. Bo Pang and Lillian Lee. 2005. Seeing stars: Exploiting class relationships for sentiment categorization with respect to rating scales. In Proceedings of the 43rd Annual Meeting of the ACL, pages 115–124.
References Shlomo Argamon, Marin Saric, and Sterling S. Stein. 2003. Style mining of electronic messages for multiple authorship discrimination: first results. In Proceedings of SIGKDD, pages 475–480.
Bo Pang, Lillian Lee, and Shivakumar Vaithyanathan. 2002. Thumbs up? Sentiment classification using machine learning techniques. In Proceedings of the 2002 Conference on Empirical Methods in Natural Language Processing (EMNLP), pages 79–86.
Shlomo Argamon, Sushant Dhawle, Moshe Koppel, and James W. Pennebaker. 2005. Lexical predictors of personality type. In Proceedings of the 2005 Joint Annual Meeting of the Interface and the Classification Society of North America.
James W. Pennebaker and Laura King. 1999. Linguistic styles: Language use as an individual difference. Journal of Personality and Social Psychology, 77:1296–1312.
Satanjeev Banerjee and Ted Pedersen. 2003. The design, implementation, and use of the ngram statistics package. In Proceedings of the Fourth International Conference on Intelligent Text Processing and Computational Linguistics, pages 370–381, Mexico City.
James W. Pennebaker, Martha E. Francis, and Roger J. Booth. 2001. Linguistic Inquiry and Word Count 2001. Lawrence Erlbaum Associates, Mahwah, NJ.
Tom Buchanan. 2001. Online implementation of an IPIP five factor personality inventory [web page]. http://users.wmin.ac.uk/∼buchant/wwwffi/ introduction.html [Accessed 25/10/05].
Rosalind W. Picard. 1997. Affective Computing. MIT Press, Cambridge, Ma. J. Ross Quinlan. 1993. C4.5: programs for machine learning. Morgan Kaufmann Publishers Inc., San Francisco, CA, USA.
Paul T. Costa and Robert R. McCrae, 1992. Revised NEO Personality Inventory (NEO-PI-R) and NEO Five-Factor Inventory (NEO-FFI): Professional Manual. Odessa, FL: Psychological Assessment Resources.
Paul Rayson. 2003. Wmatrix: A statistical method and software tool for linguistic analysis through corpus comparison. Ph.D. thesis, Lancaster University.
Kushal Dave, Steve Lawrence, and David M. Pennock. 2003. Mining the peanut gallery: opinion extraction and semantic classification of product reviews. In Proceedings of the 12th International Conference on World Wide Web, pages 519–528. ACM Press.
Ehud Reiter and Somayajulu Sripada. 2004. Contextual influences on near-synonym choice. In Proceedings of the Third International Conference on Natural Language Generation.
Jean-Marc Dewaele and Adrian Furnham. 1999. Extraversion: The unloved variable in applied linguistic research. Language Learning, 49:509–544.
Klaus Scherer. 1979. Personality markers in speech. In K. R. Scherer and H. Giles, editors, Social Markers in Speech, pages 147–209. Cambridge University Press, Cambridge.
Alastair J. Gill, Jon Oberlander, and Elizabeth Austin. 2006. Rating e-mail personality at zero acquaintance. Personality and Individual Differences, 40:497–507.
James G. Shanahan, Yan Qu, and Janyce Weibe, editors. 2005. Computing Attitude and Affect in Text. Springer, Dordrecht, Netherlands. Peter D. Turney. 2002. Thumbs up or thumbs down? semantic orientation applied to unspervised classification of reviews. In Proceedings of the 40th Annual Meeting of the ACL, pages 417–424.
Moshe Koppel, Shlomo Argamon, and Arat Shimoni. 2002. Automatically categorizing written texts by author gender. Literary and Linguistic Computing, 17(4):401–412.
Simine Vazire and Sam D. Gosling. 2004. eperceptions: Personality impressions based on personal websites. Journal of Personality and Social Psychology, 87:123–132.
Hugo Liu, Henry Lieberman, and Ted Selker. 2003. A model of textual affect sensing using real-world knowledge. In Proceedings of the 7th International Conference on Intelligent User Interfaces.
Ian H. Witten and Eibe Frank. 1999. Data Mining: Practical Machine Learning Tools and Techniques with Java Implementations. Morgan Kaufmann.
Gerald Matthews, Ian J. Deary, and Martha C. Whiteman. 2003. Personality Traits. Cambridge University Press, Cambridge, 2nd edition.
634