Location Context: work, home, etc. â¢. Social Context: with friends, ..... outcomes in call centers, job hiring, depression screening, and social networking situations.
MIT Media Laboratory Technical Note No. 610, Proc. ACM Multimedia, Santa Barbara, CA, Oct 2006, pp. 865 - 870
Human Computing for Interactive Digital Media Alex Pentland, Jonathan Gips, Wen Dong, Will Stoltzman The MIT Media Laboratory 20 Ames St. Cambridge MA, 02139 {sandy, jgips, wdong, will_s}@media.mit.edu
ABSTRACT Widespread adoption of interactive, peer-to-peer digital media will require a solution to the Privacy, Sharing, and Interest (PSI) problem: how can we know what the user wants to share with whom, and when, without burdening the user with constant updating of lists of approved users and sharing preferences? We argue that real-time analysis of user behavior provides an automatic PSI capability, allowing media to be automatically and proactively shared with a much lower user burden.
1. INTRODUCTION Perhaps the biggest questions facing the spread of interactive digital media are Privacy, Sharing, and Interest (PSI). Privacy is the ability to control access to media to which you have rights. Sharing is the ability to specify the group of people with whom you would like to share particular media, including the ability to make sharing parameters depend upon particular circumstances. Interest combines your personal interest given the current circumstances with the relevance and priority of the material. In this terminology, privacy mechanisms control the range of distribution, sharing mechanisms control your personal distribution activity, and interest parameters prioritize media within these broader categories. Today the main mechanism for specifying these PSI parameters is through specification of set membership, typically through security approvals, `buddy lists' and the like. The trouble with set specification mechanisms is that they are difficult to make sufficiently nuanced, because PSI depends not only on physical context, social context, and temporal context, but also on personal variables such as friendship, attraction, and social dominance. Moreover, as we add more variables to the set specification it becomes increasingly burdensome to keep the set membership upto-date. These difficulties have restricted media sharing to ambitious lead users who are willing to devote a great deal of energy to organizing their media communications, and left the rest of us relying on a limited number of simple default sharing patterns. What is required is some sort of automatic `mind reading’ capability to continually assess the users' context, social relationships, and attitude toward the relationship given the context, and then dynamically and continuously update the users' privacy, sharing, and interest parameters. Fortunately, by taking a human-centered, data mining approach applied to the users' behavior and physical situation, we have been able to show that it is possible to obtain solid, dynamic estimates of the users' group membership and the character of their social relationships. This approach to PSI “reads the users' minds” by analyzing their
behavior in different contexts, and using the resulting data to infer the likely PSI parameters. The key to automatic inference of PSI parameters is the recognition that humans are not general-purpose equipotent reasoning agents, but rather are creatures with a long evolutionary history that continues to shape our behavior and interactions with others. This shaping of behavior is particularly visible in social relationships and our attitudes toward them: we act differently when interacting with friends vs strangers, those we work for vs those who work for us, when we are interested vs when we are bored. By characterizing these patterns of behavior using statistical learning methods, we can then examine the users' current behavior to classify relationships as workgroup, friend, interesting, and so forth. Automatic PSI will never be perfect, because people do not behave with perfect regularity. However it already seems to be good enough to set defaults, scan for likely sharing errors and similar mistakes, and validate data from forms or more traditional sources. We can also vary the confidence thresholds of the system, making the system more or less cautious about particular types of mistakes. In addition, the models provided by automatic PSI can suggest when user input would be most useful, resulting in a semi-supervised PSI capability that can have very high accuracy and a relatively low user burden. In fact, given the errors people make in manually setting PSI parameters, our automatic PSI methods may already be as good or better than traditional methods, but with very much reduced user effort. Since reduced user effort correlates strongly with increased use, achieving `commonly accepted' PSI parameter estimation accuracies but with lower user burden offers the possibility of dramatically expanding the use of interactive digital media.
1.1 A Example of PSI at work Sports events are prime examples of contexts where people want to share their self-created digital media. Fans at a soccer match may record videos of their friends, fragments of a game, and spectacles around the stadium. Currently, people have two options for distributing the media they generate. They can either push the media to their friends through their mobile device, or they can upload their data to a mediasharing site like YouTube or Google Video. Neither of these cases takes advantage of the ability of mobile devices to guide distribution through the inference of PSI parameters for the created media.
Location tracking gives natural bounds to the temporal extent of a soccer event. A mobile device can segment the time spent at the stadium from the travel that occurs before and after the event. Media recorded during the soccer match can then be associated with the enclosing context. An understanding of the social context of the user yields a set of potential peers for sharing and media distribution. The fans that the media producer spends the most time with at the game are the most natural candidates to receive the produced media clips. Fans will have different preferences for the media produced at the soccer match. Mobile devices can weight available media content by the interest that they sensed at the time the media was created. When a goal is scored, for example, the excited behavior of the scoring team’s fans would result in a higher positive interest measurement for the period around the goal. Far fewer – but more specific – people would display high interest levels for a group photo taken in the parking lot after the game.
1.2 Related Work Many projects have addressed components of the PSI problem. One area that has been widely studied is sensing human context with mobile and wearable devices. The Active Badge project is one of the earliest examples of a location-aware system that employed infrared (IR) beacons to locate and route phone calls to users [1]. Today’s mobile devices have the ability to locate users by cell tower ID, GPS, and scanning fixed beacons such as Bluetooth devices. Projects from both academia and industry are using spatial context to enable location-based services. By performing repeated scans, mobile devices can measure changing social context of their users. Projects have used both specialized hardware [2,3,4] and off-the-shelf smart phones [5,6,7] to scan with both IR and radio frequency (RF), e.g. Bluetooth. These social context aware systems are largely intended to support face-to-face collaboration by revealing the user’s social context and promoting interaction. Proximity scans have also been used to generate social metadata for images that enables sharing between dyads of proximal people on a per image basis [8]. Our research group has also conducted experiments in speed dating, pitching business plans, and conference behavior that have identified behavioral features useful for the prediction of human interest [9,10]. Using methods similar to ours, Gatica-Perez et al 2005 [11] found that HMMs built from relatively simple audio and visual features could predict average group interest level ratings for discussion groups.
2. Developing PSI To develop PSI, we need to learn the relationship between user behavior and the PSI parameters. Towards this end we have conducted several large experiments where we tracked user behavior, and then compared features of that behavior to PSI parameters. We were particularly concerned with our ability to automatically infer: • •
Location Context: work, home, etc. Social Context: with friends, co-workers, boss, family, etc.
•
Social Interaction: are you displaying interest, boredom, friendliness, determination, etc. Obviously some of these categories can be inferred using standard methods such as user input or public digital databases, however these standard methods are often too abstract to be useful or are prone to becoming out-of-date. For instance, your company’s organization chart probably does not correspond to the day-to-day reality, and the central office of a construction company is not where its employees typically work. In such cases we would like to use automatic PSI to validate or even correct the standard information sources. The first experiment we will discuss used programmable `smart phones’ to track the behavior of graduate students within two divisions of MIT, the business school and the Media Laboratory [7]. The phones programmed to keep track of their owners’ locations and their proximity to other people, by sensing cell tower and Bluetooth IDs. This provided approximately 350,000 hours of data covering the behavior of 81 people for a period of nine months. The subjects were typically between 23 and 39 years of age, with the business school students almost a decade older than the Media Lab students. Subject groups were typically 2/3 male and 1/3 female, and approximately half were raised in America. The second experiment used electronic badges that record the wearers’ locations (with 2 meters typical accuracy), ambient audio, and upper body movement via a 2-D accelerometer [10]. This badge platform provides more fine-grained data than the smart phone, but the batteries only last for one day. We have used this platform to obtain data from the more than 110 adults that regularly attend the biannual Media Lab sponsor meetings, in which attendees walk around the Media Lab building to examine demonstrations and converse with each other during a four-hour period. The attendees have been approximately 1/3 from Asia, 1/2 from North America, and 1/6 from Europe. Both smart phones and badges can also be used to measure voice and body motion `signals’ from individuals. Such signals include the relative timing of vocalizations and the amount of modulation (in both pitch and amplitude) of those vocalizations, and similarly the relative timing of body motion and the amount of energy in the body motion. These signals have been show to correlate with the individuals’ attitudes toward social interaction (e.g., interest, friendliness, etc), and can be used to predict user behavior during semi-structured interactions such as speed dating, focus group interviews, or negotiations [12,13].
2.1 Reality Mining Together these two sensor platforms allow us to observe gross behavior (location, proximity) continuously over months, to more accurately observe behavior (location, proximity, body motion) over one-day periods, and to analyze vocalization statistics with an accuracy of tenths of seconds. These behavioral data are then subject to four main types of analysis: characterization of individual and group distribution and variability (typically using an Eigenvector or principal components analysis), conditional probability relationships between individual behaviors (known as `influence modeling’), accuracy with which behavior can be predicted (with equal type I and II error rates), and finally the relationship of these behavioral measures to standard PSI parameters.
2.1.1 Learning Eigenbehaviors A critical requirement for PSI is to learn and later categorize user behavior as quickly as possible. Eigenvector analysis, commonly known as principal components analysis, is the optimal linear method for obtaining a low-dimensional approximation to a signal such as observations of user behavior. Eigenbehaviors thus provides us with an efficient method of learning and classifying user behavior [14]. Calculation of Eigenbehaviors begins by measuring person I’s behavior (for instance, the time sequence of their location). This is illustrated in Figure 1 as Γ 1 (x,y), a two-dimensional D by 24 array of location information, where D is the total number of days person I has been in the study. Because of the structure in most people's lives, Γ 1 can be described by a relatively low dimensional `behavior space’, which is spanned by their Eigenbehaviors.
locations during the central daylight hours, then occasionally breaking into small clusters to move to one of a few other buildings during the early night hours and weekends, and then back their sleeping place. Over 85% of the variance in the behavior of low entropy subjects can be accounted for by the mean vector alone. For typical individuals the top three Eigenbehavior components account for up to 96% of the variance in their behavior. These three components could be thought of as the weekend pattern, the working late pattern, and the socializing pattern. Even though we are considering mostly young people without a regular job or family, it seems that there is very limited variability in human behavior. This means that one can, for instance, observe a person’s behavior in the morning, and from these observations accurately predict their behavior for the rest of the day [14]. The ability to accurately characterize peoples’ behavior with a low-dimensional model means that we can automatically classify the users’ location context with high accuracy. If we also allow the system to request that the user label locations that the system thinks are novel or are unusually sequenced, then we can achieve very high accuracies with very limited user input.
2.2 Influence Modeling The previous data illustrate the stereotypical patterns and limited variability we observe in individual subjects. Next let us ask what behavioral structure we observe between subjects. We thus move from a static analysis of behavior to a dynamic analysis.
Figure 1. A sample of a person’s location in a time sequence. Given behaviors Γ 1 , Γ 2 , Γ 3 … Γ M , for a group of M people, the average behavior of the group can be defined by M 1 Ψ= Γ . A set of M vectors, Φ i , are defined to be the ∑ n=1 n M deviation of an individual's behavior from the mean: Φ i = Γ i − Ψ . Principle components analysis is subsequently performed on these vectors generating a set M orthonormal vectors, un , which best describes the distribution of the set of behavior data when linearly combined with their respective scalar values, λ n . These vectors and their corresponding scalars are the Eigenvector and Eigenvalues of the covariance matrix of Φ , the set's deviation from the mean. M 1 ∑ Φ ΦT M n=1 n n = AAT
C=
where the matrix A = ⎡⎣ Φ1 ,Φ2 ,Φ3 ,...Φ M ⎤⎦ . These Eigenbehaviors can be ranked by the total amount of variance in the data for which they account, essentially those with the largest associated Eigenvalues.
2.1.2 PSI using Eigenbehaviors As might be expected, the main daily pattern is that of subjects leaving their sleeping place to spend time in a small set of
Conditional probability relationships between subjects, which we refer to as influence, allow us to predict the behavior of a subject from the other subjects’ data [15,16]. For instance, if Joe shows up at a meeting whenever Fred does, then observing Fred’s attendance allows accurate prediction of Joe’s impending proximity. In our cell phone proximity data there were two main sub-networks of influence relations, one during the day and the other in the evening, both with similar network prediction accuracy. Overall, influence between subjects allowed 95% of the variance in personal proximity data to be accounted for by the surrounding network of proximity data [16].
2.2.1 Learning Influence Again, a critical requirement for PSI is the ability to learn and later categorize user behavior from relatively few observations. The requirement for a minimal parameterization motivated our earlier development of Coupled Hidden Markov Models (CHMMs) to describe interactions between two people, where the interaction parameters are limited to the inner products of the individual Markov chains. The “influence model,” is a generalization of this approach, and describes the connections between many Markov chains as a network of convex combinations of the chains. This allows a simple parameterization in terms of the “influence” each chain has on the others [15,16]. The influence model has the unique advantage that its steady-state behavior has the same first-order Eigenstructure as the crossproduct of all the constituent Markov chains, despite having logarithmically fewer states. As with the Eigenbehavior representation, the influence representation makes it possible to analyze global behavior while avoiding the exponential number of states typical when using other models of interacting individuals or agents.
The graphical model for the influence model is identical to that of the generalized N-chain coupled HMM, but there is one very important simplification. Instead of keeping the entire P(Sti | St1−1 ,..., StN−1 ) , we only keep P(Sti | St j−1 ) and approximate
the former with: P(Sti | St1−1 ,..., StN−1 ) =
∑α
i ij P(St
| Stj−1 )
j
In other words, we form our probability for the next state by taking a convex combination of the pair wise conditional probabilities for our next state given our previous state and the neighbors’ previous state. As a result, we only have N QxQ tables and N α parameters per chain, resulting in a total of NQ2 + N2 transition parameters. It is important to realize the ramifications of these factors being constant: intuitively, it means that how much we are influenced by a neighbor is constant, but how we are influenced by it depends on its state.
2.2.2 PSI using Influence When we use the influence model to analyze the proximity data from our cell phone experiment, we find that clusters of influence in the proximity data map cleanly to our notion of affiliation and friendship. Clustering the daytime influence relationships allowed 96% accuracy at identifying workgroup affiliation, and clustering the evening influence relationships produced 92% accuracy at identifying self-reported ‘close’ friendships [7]. Similar findings were obtained using the badge platform. During a meeting of over 110 Media Lab sponsors, the combination of influence and proximity predicted whether or not two people were affiliated with the same company with 93% accuracy [10]. The ability to accurately characterize peoples’ social relationships by modeling their interpersonal influence (conditional probability structure) means that we can automatically classify the users’ social networks with high accuracy. If we also allow the system to request that the user label relationships that the system thinks are new, are unusual, or where the relationship characterization is uncertain, then we can achieve very high accuracies with very limited user input. Moreover, this automatic labeling of relationships works even for dynamically changing social networks; its accuracy is largely a function of the amount of observation data available. Thus, for instance, we could accurately label users’ company membership from only a few hours of meeting data.
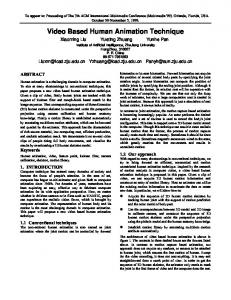
as exchanging personal identifiers [12,13]. We can name four of the more common displays as `excitement,’ `freeze,’ `determined,’ and `friendly,’ to pick terms similar to those used the animal literature, however these `displays’ are really only distinguished clusters in behavior data, defined with no direct reference to the semantics these names might suggest. The `excitement’ display is characterized by a large amount of rapid, highly modulated speech and body movement. The `freeze’ display is characterized by unusually little vocalization and body movement. The `determined’ display is characterized by rapid responses to other vocalizations and highly modulated speech and body movement. The `friendly’ display is characterized by mirroring behavior, above-average listening time, and well-modulated speech and body movement. For technical details see [12,13]; code, data, and additional publications are available at http://hd.media.mit.edu In our sponsor meeting data, with more than 110 subjects at each meeting, we observe that the `excitement’ display predicted trading of business contact information with 80% accuracy (equal error rate). The `freeze’ display, when performed in front of a demonstration, predicted requests for additional information with 80% accuracy (the `freeze display’ seems to signal mental concentration on the presentation). In a speed dating event, the woman’s display of `excitement’ predicted trading of phone numbers with 72% accuracy. And finally, in a salary negotiation (conducted for grade in a business school negotiation class), the proportion of `determination’ and `friendliness’ displays allowed prediction of who would come out ahead with almost 90% accuracy. Figure 2 shows data from a call center, where social signals were measured for 70 calls and compared to the call center ratings of whether or not the calls were successful. The vertical axis is frequency of data points, and the horizontal axis is our prediction based on social signals, with greater values meaning the call is more likely to be successful. A binary decision boundary at 0.45 produces an equal-error accuracy of 87%.
2.3 Social Signals The importance of social displays has been highlighted by the research of Ambady and Rosenthal [17] and its practical ramifications explored in the popular book `Blink’ by Malcom Gladwell [18]. In brief, they have shown that people are able to `size up’ other people from a very short (e.g., one minute) period of observation, even when linguistic information is excluded from observation, and that people use these `thin slice’ characterizations of others to quite accurately judge prospects for friendship, work relationship, negotiation, marital prospects, etc. There is something about how we behave that accurately signals the likely future course of our social interactions. We have been able to distinguish several types of `social displays’, defined as short-term (30 second) display-like behavior patterns that reliably precede important functional activities such
Figure 2. Frequency distribution of successful and unsuccessful calls vs social signaling in a call service center. The cross-validated binary linear decision rule has 87% accuracy. Other experiments have used these social signals to predict outcomes in call centers, job hiring, depression screening, and social networking situations. In each case similar prediction accuracies have been achieved by measurement of social signaling. It is especially important to note that these are not classifications of emotion; we know nothing about the subjects’
emotions in these situation. These are classifications of decision making behavior, as predicted by automatic measurement of the subjects’ social behavior prior to making the decision. The ability to accurately characterize peoples’ social interactions by classifying their signaling behavior means that we can automatically classify these interactions with high accuracy. If we also allow the system to request that the user label interactions that the system thinks are new, are unusual, or where the interaction characterization is uncertain, then we can achieve very high accuracies with very limited user input [19].
3. PSI for Interactive Digital Media These data make the point that human behavior is much more predictable than is generally thought, and is especially predictable from the behavior of others. This suggests that humans are best thought of social intelligences rather than independent actors, with individuals best likened to a musician in a jazz quartet. We can predict the behavior of these individuals from that of their associates because they are so attentive and automatically reactive to the surrounding group that they almost cease to be an individual at all. These data also make it clear that the conditions under which we trade contact information, request information, join groups and so forth, can be quite well predicted by location, proximity, and signaling behavior. As a consequence we can `reality mine’ behavior using statistical learning tools such as Eigenvector analysis and influence modeling, in order to infer social relationships without needing to understand the detailed linguistic or cognitive structures surrounding social interactions. Automatic PSI can `read users’ minds’ by analyzing their behavior in different contexts, and using the resulting data to control the sharing of media. This makes it possible to preserve privacy, share media, and measure interest without unduly burdening the user.
4. REFERENCES
[6] Eagle, N., Pentland, A. (2003) Social Network Computing, Ubicomp 2003, Springer-Verlag Lecture Notes in Computer Science, No. 2864, pp. 289-296. See TR 570
http://hd.media.mit.edu [7] Eagle, N. and A. Pentland (2005). "Social serendipity: mobilizing social software." Pervasive Computing, IEEE 4(2): 28-34. See TR 580 http://hd.media.mit.edu [8] Davis, M., S. King, et al. (2004). "From context to content: leveraging context to infer media metadata." Proceedings of the 12th annual ACM international conference on Multimedia: 188-195. [9] Madan, A., Caneel, R., Pentland, A. (2005) “Voices of Attraction,” AugCog Symposium of HCI 2005, Las Vegas, NV. See TR 584 http://hd.media.mit.edu [10] Gips, J., Pentland, A., “Mapping Human Networks,” PerCom ’06, Pisa, Italy, March 2006. See TR 586
http://hd.media.mit.edu [11] Gatica-Perez, D., I. McCowan, et al. "Detecting Group Interest Level in Meetings." Proc. IEEE Int. Conf. on Acoustics, Speech and Signal Processing (ICASSP). [12] Pentland, A. (2004) Social Dynamics: Signals and Behavior, Int’l Conf. On Developmental Learning, Salk Institute, San Diego, Oct. 20-22. See TR 579 http://hd.media.mit.edu [13] Pentland, A., (2005) Socially Aware Computation and Communication, IEEE Computer, March, pp. 63-70. See TR 590 http://hd.media.mit.edu [14] Eagle, N., and Pentland, A., “Eigenbehaviors: Identifying Structure in Routine, October 2005, See TR 601
http://hd.media.mit.edu [15] Pentland, A, Choudhury, T., Eagle, N., Push, S. (2005) Human Dynamics: Computation for Organizations, Pattern Recognition, vol 26, 503-511 See TR 589
http://hd.media.mit.edu
[1] Want, R., A. Hopper, et al. (1992). "The active badge location system." ACM Transactions on Information Systems (TOIS) 10(1): 91-102.
[16] Dong, W., and Pentland, A., (2006) Multi-sensor data fusion using the influence model, IEEE Body Sensor Networks, April, Boston, MA. See TR 597 http://hd.media.mit.edu
[2] Holmquist, L. E., J. Falk, et al. (1999). "Supporting Group Collaboration with Interpersonal Awareness Devices." Personal Technologies 3: 13-21.
[17] Ambady, N., Rosenthal, R. (1992). Thin slices of expressive behavior as predictors of interpersonal consequences: A meta-analysis. Psychological Bulletin, 111(2), 256-274.
[3] Iwatani, Y. (1998). "Love: Japanese Style." Wired News 11.
[18] Gladwell, M. (2004) Blink. New York: Little Brown
[4] Terry, M., E. D. Mynatt, et al. (2002). "Social net: using patterns of physical proximity over time to infer shared interests." Conference on Human Factors in Computing Systems: 816-817.
[19] Madan, A., Pentland, A., (2006). Vibefones: Socially Aware Mobile Phones, ISWC06, Martingy Switzerland Oct. 11-15 See TR 602 http://hd.media.mit.edu
[5] Paulos, E. and E. Goodman (2004). "The familiar stranger: anxiety, comfort, and play in public places." Proceedings of the 2004 conference on Human factors in computing systems: 223-230.