45th Lunar and Planetary Science Conference (2014)
1314.pdf
PROCESSING HAYABUSA NIRS SPECTROMETER DATA FOR COMPOSITIONAL ANALYSIS OF ASTEROID ITOKAWA. L. Le Corre1, M. Bhatt2, K. J. Becker3, J-Y. Li1, V. Reddy1, 1Planetary Science Institute, Tucson, Arizona (
[email protected]), 2Max Planck Institute for Solar System Research, Germany, 3United States Geological Survey, Flagstaff, Arizona.
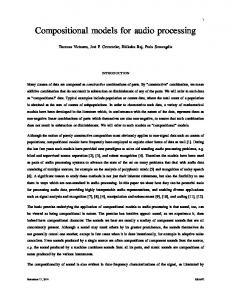
Introduction: The Hayabusa spacecraft was launched in May 2003 for a rendezvous with Apollotype NEA (25143) Itokawa and bring back a sample to the Earth. Currently the Hayabusa mission is the only robotic mission that has successfully ‘orbited,’ ‘landed,’ and returned samples of a small near-Earth asteroid (NEA). The spacecraft arrived at the asteroid in September 2005 and spent three months collecting science data in a station-keeping heliocentric orbit. The spacecraft instrument package included the Asteroid Multiband Imaging Camera (AMICA), Near Infrared Spectrometer (NIRS), X-ray Spectrometer (XRS), Lidar altimeter (LIDAR), surface hopper (MINERVA) and sample collection and return systems. Our goal for processing of the NIRS data is to extract band parameter (Band I and Band II centers, Band Area Ratio, spectral slope, Band I and II depths) of Itokawa following the method presented by [1] after photometrically correcting NIRS spectra. Following this we intend to create mineral (pyroxene chemistry, olivine/pyroxene ratio) maps of the entire visible surface of Itokawa using NIRS spectral band parameters. Instrument Description: NIRS is a 64-channel grating infrared point spectrometer (0.76-2.25 µm) with a spectral resolution of 24 nm. The field of view is 0.1 x 0.1 degrees and it has a spatial resolution of 17 x 17 meters at a distance of 10 km. During operations, NIRS made one-dimensional latitudinal scans with the target point fixed on Itokawa [2]. The original objective of NIRS was compositional mapping and distribution of minerals at tens of meters spatial scales. NIRS wavelength range (0.76-2.25 µm) complements that of AMICA (0.38-1.0 µm). While NIRS wavelength range spans 0.76-2.25 µm, in reality the usable range is 0.852.1 µm due to cutoff in detector sensitivity at the lower and higher wavelength ends of the spectrum [2]. Asteroid Itokawa: Asteroid Itokawa exhibits color variations across its surface when looking at AMICA color images (Fig. 1). [3] showed that surface albedo variations are ~15% in association with different color units. [2] also observed significant albedo variations in the near-IR (1.57 µm) across the surface. The reflectance spectrum of Itokawa from NIRS showed that it was similar to that of LL chondrites [4], consistent with interpretation from [5]. NIRS observations also showed variations in band depth and spectral slope
among different areas of Itokawa [4]. The exact cause of this heterogeneity is unknown, but space weathering [6] and particle size effects have been suggested as possible reasons [4]. It is unclear if these albedo/spectral variations affect the composition/mineralogy of the surface. Our goal is to link these color variations to possible compositional heterogeneities of the regolith by processing and analyzing the NIRS dataset.
Figure 1: Top: AMICA composite image with red (0.70 µm), green (0.553 µm) and blue (0.429 µm). Bottom: Clementine-like color image from AMICA with red/blue representing the visible slope and green corresponding to the 0.70/0.96 µm band ratio (proxy for the band depth of the 1-µm absorption band). These color ratios show the diversity of terrains on Itokawa that could be mostly influenced by space weathering, composition or grain size effects. Dataset: The mission phase consisted of three subphases depending on the distance to the asteroid [2]. These include the Gate-Position (GP) phase (20-8 km), Home-Position (HP) phase (~8 km), and the descent and touchdown (TD) phase during which the spacecraft attempted to collect surface samples. Calibrated NIRS spectra are archived in the PDS Small Bodies node and include 111,226 spectra (with
45th Lunar and Planetary Science Conference (2014)
~80,000 spectra of the asteroid Itokawa). They have been corrected for dark current and averaged onboard the spacecraft before transmitted back to Earth. Each observation contains two columns: the average spectrum and the standard deviation of the stacked spectra. About 66,000 of these spectra contain the latitude and longitude of the center and the corners of their corresponding footprint and information about illumination conditions in their label files. This information is essential to be able to create maps with the NIRS data. NIRS spectra have been acquired at phase angles between 0° and 38° with a 6 to 90 m2 footprint size [4]. Figure 2 shows NIRS coverage with each data point representing the center of each NIRS footprint. The NIRS data covers the entire surface of Itokawa enabling global compositional mapping.
1314.pdf
data files compatible with ENVI and associated header files.
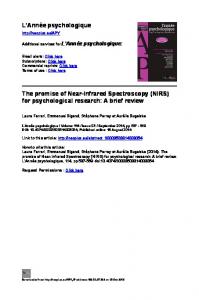
Figure 3: Comparison of a calibrated NIRS spectrum (red) and ground-based spectrum (black) of Itokawa. Future work: A photometric model will be developed and implemented in ISIS as well to calibrate the NIRS data. Observing geometry (phase angle) affects the position of the absorption bands, band depth, and spectral slope [8]. Correcting the NIRS data for this effect is important for extracting accurate surface mineralogy [1] for any subtle compositional variations on Itokawa.
Figure 2: Global distribution of the NIRS calibrated observations. Each point corresponds to the center of a NIRS footprint. Processing: NIRS data processing is done using ISIS (Integrated Software for Imagers and Spectrometers), which is developed and maintained by U. S. Geological Survey (USGS) Astrogeology Science Center to support NASA spacecraft missions [7]. We will present preliminary processing steps for using the NIRS calibrated dataset during the conference. We will also present preliminary NIRS global spectral mosaics. The NIRS calibrated spectra are stored on the PDS only with channel numbers, thus we use the spectral calibration formula presented in [2] to retrieve the wavelength. The FITS files and their associated labels are converted to ISIS-compatible cubes and we attached important information to the header (such as geometry of observation and number of spectra averaged in data file from the PDS header). We reorganized the data cubes and added channel information so that they were readable in qview application and separated actual reflectance data from standard deviation data. Figure 3 shows a typical spectrum obtained after preliminary processing in ISIS. We can then reexport the data cube in PDS format in order to create
Acknowledgment: This research work was supported by NASA Planetary Mission Data Analysis Program Grant NNX13AP27G, NASA NEOO Program Grant NNX12AG12G, and NASA Planetary Geology and Geophysics Grant NNX11AN84G. References: [1] Reddy V. et al. (2014), LPSC abstract. [2] Kitazato K. et al. (2008), Icarus 194, 137145. [3] Sasaki S. et al. (2007), LPSC abstract #1338. [4] Abe M. et al. (2006), Science 312, 1334-1338. [5] Binzel R. P. et al. (2001), Icarus 151, 139-149. [6] Hiroi T. et al. (2006), Nature 443, 56-58. [7] Anderson J. A. et al. (2004), LPSC abstract #2039. [8] Sanchez J. A. et al. (2011), Icarus 220, 36–50.