APPLIED AND ENVIRONMENTAL MICROBIOLOGY, Sept. 2000, p. 3891–3897 0099-2240/00/$04.00⫹0 Copyright © 2000, American Society for Microbiology. All Rights Reserved.
Vol. 66, No. 9
Production and Consumption of Nitric Oxide by Three Methanotrophic Bacteria ´ AL ROY,2 TIE REN,1 RE
AND
ROGER KNOWLES1*
Department of Natural Resource Sciences, McGill University, Macdonald Campus, Ste. Anne de Bellevue, Que´bec, H9X 3V9,1 and Biotechnology Research Institute, National Research Council of Canada, Montreal, Que´bec, H4P 2R2,2 Canada Received 28 February 2000/Accepted 26 June 2000
We studied nitrogen oxide production and consumption by methanotrophs Methylobacter luteus (group I), Methylosinus trichosporium OB3b (group II), and an isolate from a hardwood swamp soil, here identified by 16S ribosomal DNA sequencing as Methylobacter sp. strain T20 (group I). All could consume nitric oxide (nitrogen monoxide, NO), and produce small amounts of nitrous oxide (N2O). Only Methylobacter strain T20 produced large amounts of NO (>250 parts per million by volume [ppmv] in the headspace) at specific activities of up to 2.0 ⴛ 10ⴚ17 mol of NO cellⴚ1 dayⴚ1, mostly after a culture became O2 limited. Production of NO by strain T20 occurred mostly in nitrate-containing medium under anaerobic or nearly anaerobic conditions, was inhibited by chlorate, tungstate, and O2, and required CH4. Denitrification (methanol-supported N2O production from nitrate in the presence of acetylene) could not be detected and thus did not appear to be involved in the production of NO. Furthermore, cd1 and Cu nitrite reductases, NO reductase, and N2O reductase could not be detected by PCR amplification of the nirS, nirK, norB, and nosZ genes, respectively. M. luteus and M. trichosporium produced some NO in ammonium-containing medium under aerobic conditions, likely as a result of methanotrophic nitrification and chemical decomposition of nitrite. For Methylobacter strain T20, arginine did not stimulate NO production under aerobiosis, suggesting that NO synthase was not involved. We conclude that strain T20 causes assimilatory reduction of nitrate to nitrite, which then decomposes chemically to NO. The production of NO by methanotrophs such as Methylobacter strain T20 could be of ecological significance in habitats near aerobic-anaerobic interfaces where fluctuating O2 and nitrate availability occur. nitrogen cycle processes, we investigated both production and consumption of NO by Methylobacter luteus (a group I methanotroph), Methylosinus trichosporium OB3b (a group II methanotroph), and strain T20 (a group I methanotroph isolated from a swamp soil). We show that strain T20 is a Methylobacter sp. and report the production by it of up to 250 parts per million by volume (ppmv) of NO in the headspace of cultures growing in nitrate-containing medium.
Nitric oxide (nitrogen monoxide, NO) is an important trace gas that plays important roles in tropospheric chemistry and is a factor in acid precipitation and ozone turnover (12, 13, 38). Soils are a major source of NO, accounting for up to 40% of the global budget (43), most coming from arable land (38). Processes of microbial metabolism are responsible for most of the NO source or sink strength of terrestrial and aquatic systems. Biological production and consumption of NO occur via a variety of reductive and oxidative processes involving heterotrophic and autotrophic microorganisms. The detailed mechanisms of these processes are not yet fully understood but are further considered in the Discussion section. Methane-oxidizing bacteria are important in reducing global emissions of methane from terrestrial and aquatic systems. They also participate in various nitrogen cycle processes: nitrate and ammonium assimilation, nitrogen fixation (15), and nitrification (6). They produce nitrous oxide (N2O) during nitrification in ammonium-containing medium (24, 26, 47). Methylomonas agile and Methylosinus trichosporium, group I and II methanotrophs, respectively, consume NO, but aerobic cultures in ammonium-containing medium were not observed to produce NO (26). Denitrification was not observed in a detailed study of 136 methanotrophic bacteria (8). It was reported earlier in CH4-oxidizing isolates (14), but this has not been independently confirmed, and there may be some question about the purity of the isolates. As part of a study of the potential roles of methanotrophs in
MATERIALS AND METHODS Microorganisms and culture conditions. Organisms used were Methylobacter luteus NCIB 11914 (group I, from R. S. Hanson), Methylosinus trichosporium OB3b (group II, from R. S. Hanson), and strain T20, a group I methanotroph isolated by T.R. from the top band of growth in an agarose diffusion column (2) inoculated with a methane enrichment culture obtained with soil from a hardwood swamp at Mt. St. Hilaire, Que´bec, Canada (1). This strain is unusual in that it does not form colonies on solid or semisolid medium. Culture conditions were as previously described (33). Ammonium chloride (9.3 mM) mineral salts (AMS), sodium nitrate (11.7 mM) mineral salts (NMS) (42), ammonium plus nitrate mineral salts (ANMS), and mineral salts (MS, as for AMS without nitrogen source) media were used. Purity was tested microscopically and by plating on nutrient agar. Erlenmeyer flasks (250 ml), each containing 100 ml of NMS medium, were closed with rubber stoppers fitted with injection ports, inoculated with 0.5 ml of a late-exponential-phase culture, and CH4 injected to give a mixing ratio of 30% (vol/vol) in the headspace. Such main cultures were incubated on a rotary shaker (200 rpm) at 25°C and sampled periodically for the determination of optical density and CH4, O2, and NO mixing ratios and for further studies. For experiments described below, 10-ml samples of the main cultures were transferred by syringe to 60-ml serum bottles previously sealed with butyl stoppers and evacuated three times and filled with helium (He). For studies in the presence and absence of O2, the bottles containing culture were then evacuated again to remove carryover of dissolved gases and filled with He. Gases were then injected as desired to give 10% CH4, 20% O2, or 2 ppmv NO, unless otherwise indicated. Production and consumption of NO. Production of NO was measured in the presence and absence of O2 and presence of CH4 unless otherwise stated. The
* Corresponding author. Mailing address: Dept. of Natural Resource Sciences, McGill University, Macdonald Campus, 21 111 Lakeshore Rd., Ste. Anne de Bellevue, QC H9X 3V9, Canada. Phone: (514) 398-7751. Fax: (514) 398-7990. E-mail:
[email protected]. 3891
3892
REN ET AL.
zero-order production rates were estimated by linear regression of NO mixing ratios against time. Consumption of 2 ppmv of NO was first order, so rate constants were estimated by logarithmic regression of NO mixing ratios against time, and the rates presented were calculated at 1 ppmv of NO. In these experiments, autoclaved medium without cells was used as a control and results were corrected for the extremely low rates of NO disappearance in such controls. Studies with different nitrogen sources. Cultures (100 ml) in NMS were harvested by centrifugation (12,100 ⫻ g, 10 min, 4°C) three times and resuspension in MS medium. Pellets were finally suspended in MS containing the desired nitrogen source(s) (9.3 mM NH4Cl, 11.7 mM NaNO3, or 11.7 mM arginine-N) to the final optical density (OD) indicated in the Results section. Samples (10 ml) of such suspensions were transferred to 60-ml serum bottles that were then evacuated and filled with He plus desired mixing ratios of CH4 and O2. After appropriate incubation times at 25°C, pH, OD660, and concentrations of NO3⫺, NO2⫺, NO, and N2O were measured. In some experiments, assimilatory nitrate reductase was inhibited by 20 mM potassium chlorate (e.g., reference 31) or inactivate nitrate reductase was generated in the presence of 25 mM sodium tungstate (39). Denitrification. Denitrification by strain T20 was tested for using an acetylene (C2H2) inhibition method (48) but in a way similar to that used for methanotrophic N2 fixation (C2H2 reduction) assays (30, 40). Samples (10 ml) of a 5-day-old main culture in NMS medium were transferred to 60-ml serum bottles. Methanol (final concentration, 0.25% [vol/vol], previously shown to support growth of strain T20) was added, and the bottles were evacuated to remove residual CH4. Then C2H2 (2% final), or an equal volume of He, or sodium azide (0.5 mM final concentration) was added to triplicate bottles. N2O concentrations were measured after 2 and 5 days of incubation. In another experiment, 10 ml of NMS medium in serum bottles was directly inoculated with strain T20, incubated under 20% CH4 for 4 days, and then assayed as described above. N2O was determined after 2, 3, and 6 days of incubation. Analyses. CH4 and O2 were obtained from Air Products and Praxair, Montreal, Canada, respectively, and NO and N2O were obtained from Matheson, Montreal, Canada. CH4, O2, and OD were determined as described (33). Cell numbers were counted microscopically using a Hawksley counting chamber (Lancing, U.K.). NO, N2O, NO3⫺, and NO2⫺ were measured by gas chromatography and colorimetric methods (17). DNA extraction. A 5-day culture of strain T20 (100 ml) was centrifuged at 17,400 ⫻ g for 20 min, and the pellet was resuspended in 1 ml of sterile distilled water. DNA was then extracted using the Fast DNA method for bacterial cultures as described by the manufacturer (BIO 101, Vista, Calif.). DNA was quantified by determination of the absorbance at 260 nm on a DU-600 spectrophotometer (Beckman Instruments). PCR amplification of genes coding for nitrite, NO, and N2O reductases and for 16S rRNA from strain T20. Four sets of primers were used to amplify genes coding for the cd1 nitrite reductase (nirS), the copper nitrite reductase (nirK), the nitric oxide reductase (norB), and the 16S rRNA. The primers for the two NO2⫺ reductases, the NO reductase, and the N2O reductase (nosZ) were designed following alignment (with the program GeneWorks) of the sequences from different denitrifying bacteria (R. Roy and C. W. Greer, unpublished data) retrieved from GenBank (www.ncbi.nlm.nih.org). Conserved regions were used as the target for the primers. The primer sets were as follows: nirS from Paracoccus denitrificans Pd1222, Pseudomonas aeruginosa PAO1, Pseudomonas stutzeri ATCC 14405, and Ralstonia eutropha H16, F852-881 (5⬘-CGGCTACGC GGTGCATATCTCGCGTCTGTC-3⬘) and R1138-1167 (5⬘-GATGGACGCCA CGCGCGGCTCGGGGTGGTA-3⬘); nirK from Achromobacter cycloclastes, Pseudomonas aeruginosa G179, and Pseudomonas aureofaciens ATCC 13985, F510-539 (5⬘-GGGCATGAACGGCGCGCTCATGGTGCTGCC-3⬘) and R856885 (5⬘-CGGGTTGGCGAACTTGCCGGTGGTCCAGAC-3⬘); norB from Paracoccus denitrificans Pd1222, Pseudomonas aeruginosa PAO1, and Pseudomonas stutzeri ATCC 14405, F1295-1320 (5⬘-GGCGTGTGGGAACTGATCATGGCT GC-3⬘) and R1722-1747 (5⬘-GCGCCATAGAAGGCCATGTGGCCGTG-3⬘); and nosZ from Paracoccus denitrificans Pd1222, Pseudomonas aeruginosa PAO1, Ralstonia eutropha H16, and Pseudomonas stutzeri ATCC 14405, F1408-1437 (5⬘-CTGGGTCTCGGGCCGCTGCACACCACCTTC-3⬘) and R1675-1704 (5⬘GATCAGCTGCTCGTTCTCCGGATGCAGCGG-3⬘). It was ascertained that these primers did not form primer dimers (based on simulation with the program Amplify 1.4). They led to the synthesis of DNA fragments of the expected size for each gene by PCR amplification with annealing temperatures of 50 to 65°C. Previously published primers for nirS (nirS1F and nirS6R [9] and F1acd and R4cd [20]) and nirK (nirK1F and nirK3R plus nirK1F and nirK5R [9] and F1aCu and R3Cu [20]) were also tested at 50 and 60°C against DNA from strain T20. All primers were synthesized by Hukabel Sci. Lte´. (Montre´al, Canada). The primer set used for amplification of the 16S ribosomal DNA (rDNA) gene was F1 and R13 from reference 16. The PCRs were performed in 50-l final volumes with 200 M (each) dNTP, dATP, dCTP, dGTP, and dTTP; 2 mM MgCl2; 0.2 M (each) primer; and 2 U of Taq polymerase (Pharmacia Biotech, Baie d’Urfe´, Canada) and 1 l of DNA template (40 to 50 ng/l). PCR was done on a DNA thermal cycler (Perkin Elmer Cetus, Montre´al, Canada) using the following PCR parameters: 30 cycles of 1 min at 94°C, 1 min at 60°C, and 1 min at 72°C, and a final extension of 3 min at 72°C. Amplicons were analyzed by
APPL. ENVIRON. MICROBIOL.
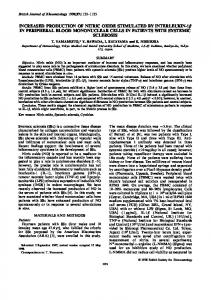
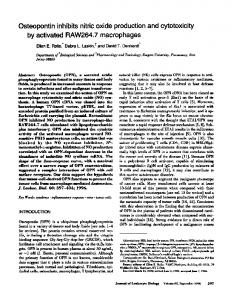
FIG. 1. Production and consumption of NO by M. luteus. (A) Growth (OD660, F), O2 consumption (), and NO accumulation (E) during 7 days of growth in NMS medium under initially aerobic conditions. Each time point represents sacrificial sampling of one of eight replicate flasks, the samples being used for the assays reported in panel B. (B) Rates of production of NO at 0% O2 (E) and 20% O2 (‚), and calculated rates of consumption of 1 ppmv of NO in the presence of 20% O2 (䊐). (Error bars represent the standard error of the mean for duplicate bottles and if not visible are contained within the symbols.) d, days.
agarose (1.6%) gel electrophoresis and visualized by ethidium bromide staining (34). Plasmids used as positive controls for PCRs were pnir9 (nirS), pRTC19 (nirK), pNorCB1 (norB), and pMW12 (nosZ). 16S rDNA sequence. For the sequencing of the 16S rDNA gene, 16S rDNA amplicons (1.5 kb) generated by PCR were first purified through a QiaQuick column (Qiagen, Mississauga, Canada). The purified DNA fragments were then used as templates for PCR reactions using a single primer. Besides primers F1 and R13, primers F2, R1, R2, R5, R8, and R11 were also used (16). Two primers developed in this study were F1B (bases 519 to 536), CAGCMGCCGCGGTA ATWC, and F1C (bases 907 to 926), AAACTCAAATGAATTGACGG (M is A or T, and W is A or C). PCRs were performed in 10-l final volumes with 20 ng of 16S rDNA template, 12 pmol of primer, and 4 l of D-rhodamine reaction mix (ABI; Perkin Elmer). PCR was done on a Gene Amp 2400 (Perkin Elmer) using 25 cycles of 10 s at 96°C, 5 s at 50°C, and 4 min at 60°C. The amplicon DNA was then purified either by using Centrisep columns (Princeton Separations, Adelphia, N.J.) or by precipitating with ethanol. The purified DNA was dried in a rotary evaporator (Speed Vac; Savant Insts., Farmingdale, N.Y.) and later processed on an ABI 373 DNA Sequencer (Perkin Elmer). Sequence data were analyzed against GenBank through the Blast program. Nucleotide sequence accession numbers. The 16S rDNA nucleotide sequence for strain T20 was deposited in the GenBank database under accession number AF131868. Other GenBank accession numbers used were as follows: for nirS Paracoccus denitrificans Pd1222 (U05002), Pseudomonas aeruginosa PAO1 (X16452, Pseudomonas stutzeri ATCC 14405 (M80653), and Ralstonia eutropha H16 (X91394); for nirK, Achromobacter cycloclastes (Z48635), Pseudomonas aeruginosa G179 (M97294), and Pseudomonas aureofaciens ATCC 13985 (Z21945); for norB, Paracoccus denitrificans Pd1222 (U28078), Pseudomonas aeruginosa PAO1 (D38133), and Pseudomonas stutzeri ATCC 14405 (Z28384); and for nosZ, Pseudomonas stutzeri ATCC14405 (M22628), Pseudomonas aeruginosa PAO1 (X65277), Ralstonia eutropha H16 (X74792), and Paracoccus denitrificans Pd1222 (X65278).
RESULTS Production and consumption of NO. Methylobacter luteus and Methylosinus trichosporium accumulated very low concentrations (⬍0.03 ppmv) of NO during growth in NMS medium (Fig. 1A and 2A). However, once O2 became significantly
VOL. 66, 2000
NITRIC OXIDE METABOLISM BY METHANOTROPHS
3893
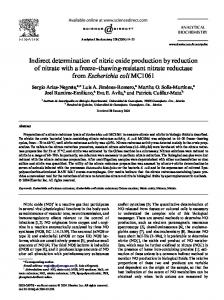
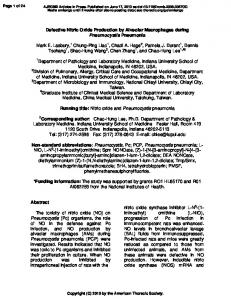
FIG. 4. Production of NO by strain T20 at different O2 concentrations. Assays of 1.75-h duration were done in the presence of 10% CH4 using samples from cultures that had been incubated for 4 (F) and 7 (E) days. FIG. 2. Production and consumption of NO by M. trichosporium. Details as in Fig. 1.
depleted, strain T20 accumulated NO nearly linearly up to mixing ratios of about 250 ppmv (Fig. 3A). Short-term measurements of anaerobic NO production rates showed that this activity was below the detection limit of our method in M. luteus and M. trichosporium (Fig. 1B and 2B), but in strain T20 (Fig. 3B) rates increased during the period of O2 depletion and reached 3 pmol of NO ml⫺1 min⫺1 in stationary phase. This was equal to a specific activity of 1.36 ⫻ 10⫺17 mol of NO cell⫺1 day⫺1. Consumption of NO could not be detected under anaerobiosis because of the NO production that occurred un-
FIG. 3. Production and consumption of NO by strain T20. Details as in Fig. 1. Note that the scale of the ordinates for NO in this figure differs from that in Fig. 1 and 2.
der such conditions, and the isotope dilution study that would have been necessary to elucidate this was beyond the scope of this study. However, in the presence of 20% O2, all three organisms showed aerobic NO consumption rates rising to about 2 pmol of NO ml⫺1 min⫺1 during the growth of the culture, and in the case of strain T20, this rate was relatively constant from 2 to 7 days of growth of the main culture. Only after the first 3 days of growth of the culture of strain T20 (Fig. 3A) was the production of NO greater than its potential consumption rate (Fig. 3B), thus allowing accumulation of NO in the culture (Fig. 3A). Effect of oxygen. Oxygen inhibited the production of NO by strain T20 (Fig. 4). Production of NO was maximum at the lowest measured O2 concentration (⬍0.2%) and decreased rapidly at higher O2, reaching zero at about 0.75% O2. To test for a possible requirement for CH4 for NO production, samples of a 4-day culture of strain T20 having an OD of 0.41 were incubated for 2 h in the presence and absence of CH4 (10%) and O2 (16%). No NO was produced under 16% O2 whether CH4 was present or not, and none was produced at 0% O2 in the absence of CH4. Production of NO occurred (1.65 pmol ml⫺1 min⫺1) only in the presence of CH4 and no added O2, suggesting a requirement for CH4 as a source of reducing power (see Discussion). Nitrogen sources. Potential nitrogen sources for the production of NO by strain T20 were studied by analyzing for NO in samples of a 5-day NMS culture washed and resuspended in MS alone and in MS containing NH4Cl, NaNO3, or arginine and 10% CH4 for a period of 18 h. With 20% O2 no NO was produced in any medium, and at 0% O2 NO was produced only in NMS in the presence of CH4 at a rate of 0.42 pmol of NO ml⫺1 min⫺1. These results suggest once again that a reductive process is involved and that an O2-requiring NO synthase such as that reported in Nocardia (11) is not involved. To test for the requirement for a nitrate reductase, we resuspended ammonium-grown and nitrate-grown cells in AMS, ANMS, and NMS media and incubated them anaerobically for 10 days. High NO production occurred only in NMS-grown cells resuspended in medium containing nitrate (ANMS and NMS), indicating that an active nitrate reductase was involved in production of NO (Table 1). AMS-grown (and therefore
3894
REN ET AL.
APPL. ENVIRON. MICROBIOL.
TABLE 1. Production of NO by strain T20 grown in AMS or NMS medium and then resuspended to an OD660 of 0.15 in AMS, ANMS, or NMS mediuma NO production (nmol/bottle)
Growth medium
Incubation (days)
AMS
ANMS
AMS
10 10 ⫹ 3
0.06 0.22
0.08 4.2
NMS
10
0.56
149.0
NMS
0.06 11.41 127.1
a
The suspensions were incubated anaerobically with 10% methane for 10 days. The AMS-grown cells were then supplemented with 5% O2 and incubated for a further 3 days.
nitrate reductase repressed) cells produced small amounts of NO only in medium containing nitrate after addition of a limited supply of O2 that presumably permitted growth, uptake of nitrate and ammonium, and some derepression of synthesis of an assimilatory nitrate reductase. Inhibitors of nitrate reductase. Potassium chlorate (20 mM) caused ⬎99% inhibition of growth and methane consumption and 98% inhibition of production of NO and CO2 in aerobic cultures of strain T20 growing in NMS over a 12-day period (data not shown). In similar cultures, sodium tungstate (25 mM) completely suppressed methane consumption and production of NO and CO2 (T. Ren and R. Knowles, unpublished data). Chlorate inhibits assimilatory nitrate reductase (31), and tungstate causes formation of inactive nitrate reductase (39), so their effects in the present study provide further evidence for the involvement of a nitrate reductase, probably the assimilatory type B. Denitrification. Reduction of residual nitrate to N2O by strain T20 was tested for in the presence of methanol as the reductant and either C2H2 or sodium azide to inhibit an N2O reductase. Only about 15 to 19 ppmv of N2O were produced in both the presence and absence of 2% C2H2, and sodium azide caused less N2O production than was observed in the controls (T. Ren and R. Knowles, unpublished data). Thus, there was no evidence for the presence of a denitrification system in strain T20. Despite the lack of physiological evidence for the presence of denitrification as a possible source of NO, we also used molecular tools to test for the presence of denitrifying reductases. PCR primers designed to amplify a 316-bp fragment from the cd1 nitrite reductase (nirS), a 378-bp fragment from the Cu nitrite reductase (nirK), a 433-bp fragment from the NO reductase (norB), and a 297-bp fragment from the N2O reductase (nosZ) of denitrifying bacteria were tested on genomic DNA extracted from strain T20. No amplification was observed with any of these primers at annealing temperatures of 50 and 60°C, although the 16S rDNA gene was successfully amplified with universal primers F1 and R13. Previously pub-
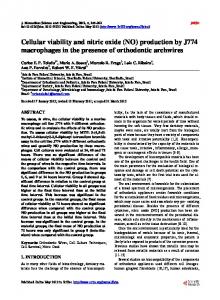
FIG. 5. Consumption of NO3⫺ and O2 and production of NO2⫺, NO, and N2O in cultures of strain T20 growing initially aerobically in NMS medium in the presence of 30% CH4. No more than half of the CH4 was consumed during the experiment.
lished PCR primers reported to amplify nirS and nirK genes (9, 20) were also tested against DNA from strain T20. At annealing temperatures of 50 and 60°C, these primers failed to amplify any denitrification genes from strain T20. These results suggest that nitrite reductase, NO reductase, and N2O reductase are absent in strain T20, or if present, they are significantly different from the corresponding denitrifying reductases. Production of nitrogen oxides. The time course of NO production by strain T20 in initially aerobic NMS medium was studied next, and NO3⫺, NO2⫺, and N2O were also measured. At about the time of O2 depletion (after about 3 days of incubation), there was accumulation of micromole quantities of NO and NO2⫺ and nanomole quantities of N2O (Fig. 5). About 2 mmol of NO3⫺ were consumed, presumably mainly by assimilation. During NO production, the specific activity was 2.0 ⫻ 10⫺17 mol of NO produced cell⫺1 day⫺1. The N oxide products were, in order of abundance (micromoles per flask), NO2⫺ (35) ⬎ NO (2.2) ⬎ N2O (0.19), and once again reductive processes seemed to be involved. M. luteus, M. trichosporium, and strain T20 differed greatly in their ability to produce NO (Fig. 1 to 3 and Tables 2 to 4). Very significant amounts of NO were produced in NMS medium only by strain T20 with 20% CH4 and no added O2 (Tables 2 to 4). In the presence of O2, this strain accumulated NO2⫺, but this did not result in great NO production (Table 4). Some nitrification (production of NO2⫺ or NO3⫺) occurred in AMS with all strains, especially with low (1%) CH4 and 20% O2, and although this was accompanied by some NO production in M. luteus (Table 2) and both NO2⫺ and NO production in M.
TABLE 2. Final cell density, pH, concentrations of CH4 and O2, and amounts of N2O, NO, NO2⫺, and NO3⫺ in cultures of M. luteus incubated for 48 h in NMS or AMS medium in the presence of CH4 and 0 or 20% O2a Medium
CH4 (%)
O2 (%)
OD660
pH
CH4 (%)
O2 (%)
N2O (pmol)
NO (pmol)
NO2⫺ (pmol)
NO3⫺ (mol)
NMS
20
AMS
1
AMS
20
0 20 0 20 0 20
0.17 0.80 0.14 0.20 0.15 0.22
6.5 6.3 6.5 5.6 6.4 5.2
20.8 4.8 1.0 0.0 19.8 18.9
0 0.68 0 19.1 0 19.0
0.2 0.9 0.6 0.9 0.2 0.2
28 44 26 868 23 39
13 18 0 77 0 0
102 84 0.1 1.1 0.1 0.1
a All values are the averages for duplicate cultures. A 5-day-old culture was washed and resuspended in NMS or AMS to an OD660 of 0.16. Samples (10 ml) of this suspension were then transferred to 60-ml serum bottles and shaken at 25°C for 48 h. Analyses were done as described in Materials and Methods.
VOL. 66, 2000
NITRIC OXIDE METABOLISM BY METHANOTROPHS
3895
TABLE 3. Final cell density, pH, concentrations of CH4 and O2, and amounts of N2O, NO, NO2⫺, and NO3⫺ per bottle in cultures of M. trichosporium OB3b incubated for 48 h in NMS or AMS medium in the presence of CH4 and 0 or 20% O2a Medium
CH4 (%)
O2 (%)
OD660
pH
CH4 (%)
O2 (%)
N2O (pmol)
NO (pmol)
NO2⫺ (pmol)
NO3⫺ (mol)
NMS
20
AMS
1
AMS
20
0 20 0 20 0 20
0.22 0.71 0.19 0.25 0.25 0.53
6.6 6.3 6.5 5.2 6.2 3.6
21.0 6.75 1.07 0.0 21.4 12.3
0 0.56 0 19.9 0 7.3
0 4.3 3.1 1.6 1.8 2.0
23 48 20 2,072 24 399
0 66 167 989 125 0
118 91 0.10 0.47 0.06 0.10
a
All values are the averages for duplicate cultures. Experimental details are as for Table 1 except that the initial OD660 values were 0.19 to 0.21.
trichosporium (Table 3), the very low nitrification by strain T20 was associated with only moderate NO production (Table 4). The 16S rDNA gene sequence from strain T20 was compared with sequences present in GenBank through a Blast analysis. The results indicate that the closest relatives of this methanotroph were two group I methanotrophs, Methylobacter sp. strain BB5.1 (AF016981), a trichloroethylene degrader (36), and Methylobacter psychrophilus (AF152597), isolated from tundra soil (41), with 96 and 97% 16S rDNA identity, respectively. DISCUSSION We report for the first time the production of significant amounts of NO (up to 250 ppmv in the gas phase, or 0.45 M) by O2-deficient cultures of a methanotroph, here tentatively identified as Methylobacter sp. strain T20, isolated from a mixed-hardwood swamp soil. The specific activities of NO production (up to 2.0 ⫻ 10⫺17 mol of NO cell⫺1 day⫺1) were close to rates reported for some denitrifiers (3) but much lower than reported for others (32). Much smaller amounts of NO were produced by M. luteus and M. trichosporium. Production of NO was not detected by Kra¨mer et al. (26) in Methylomonas agile and M. trichosporium, but their experimental conditions were aerobic only. Methanotrophs become O2 limited below a critical concentration of about 5.7 M (0.45%) O2 (33). Here, even in the absence of added O2, the presence of CH4 stimulated NO production, perhaps because some contaminating O2 allowed CH4 to act as a source of reducing power for the cells. All three bacteria used in our study consumed NO under aerobic conditions, in agreement with Kra¨mer et al. (26). Production of N2O by the three methanotrophs studied here was much less than that of NO, with a maximum specific activity for strain T20 of 5.1 ⫻ 10⫺18 mol of N2O-N cell⫺1 day⫺1. This activity is at least 1,000-fold lower than the specific denitrifying enzyme activity (DEA) of 1.75 ⫻ 10⫺14 mol of N2O-N cell⫺1 day⫺1 reported for denitrifiers assayed in soil (28). Strain T20 did not reduce N2O in either the presence or absence of CH4 under aerobic or anaerobic conditions (Ren and Knowles, unpublished).
There are several possible mechanisms by which production of NO and N2O could occur (12, 50). (i) Denitrification, involving an NO-producing NO2⫺ reductase and NO reductase, has not been confirmed in methanotrophs (8). For strain T20, nitrate (in NMS medium) supported most NO production under anaerobic or nearly anaerobic conditions, but the fact that C2H2 did not stimulate anaerobic production of N2O from nitrate by methanol-supported cells of strain T20 and the lack of detection by PCR analysis of cd1 or copper-type NO2⫺ reductases, NO reductase, and N2O reductase suggest that denitrification is unlikely. (ii) Nitrification by autotrophic bacteria releases NO and some N2O via an NO2⫺ reductase, especially at lower O2 concentrations. N2O but not, so far, NO has been reported as a product of nitrification by methanotrophs in aerobic ammonium-containing medium (AMS) (12, 26, 47). The small amounts of N2O and larger amounts of NO produced in this study in aerobic AMS by all three bacteria suggest a methanotrophic nitrification source. The mechanisms could involve chemical decomposition (chemodenitrification) of the products of NH3 oxidation, NH2OH and/or NO2⫺. We have confirmed (Ren and Knowles, unpublished) that chemical decomposition of NO2⫺ does occur in our mineral salts medium, that it is inversely related to pH and proportional to NO2⫺ concentration (compare reference 35), and occurs three to four times more rapidly with living than with boiled cells of strain T20. However, it is difficult to assign relative importance to biological versus chemical processes in the production of NO by strain T20. (iii) Activity of dissimilatory NO3⫺ reductase in bacteria other than denitrifiers can release some N2O (3, 7, 45). In Escherichia coli, a functional NO3⫺ reductase appears to be necessary for production of N2O (37) and NO (21) during NO2⫺ reduction, and a flavohemoglobin can reduce NO to N2O (23). There is also evidence that Bacillus cereus produces NO during NO3⫺ respiration (22). (iv) Assimilation of NO3⫺ can result in N2O release (7), but production of NO during assimilation has not been clearly demonstrated. Our experiments with ammonia- and nitrate-
TABLE 4. Final cell density, pH, concentrations of CH4 and O2, and amounts of N2O, NO, NO2⫺, and NO3⫺ per bottle in cultures of strain T20 incubated for 48 h in NMS or AMS medium in the presence of CH4 and 0 or 20% O2a Medium
CH4 (%)
O2 (%)
OD660
pH
CH4 (%)
O2 (%)
N2O (pmol)
NO (pmol)
NO2⫺ (pmol)
NO3⫺ (mol)
NMS
20
AMS
1
AMS
20
0 20 0 20 0 20
0.17 0.69 0.15 0.15 0.20 0.31
6.6 6.4 6.5 6.1 6.3 4.6
20.4 6.0 0.99 0.37 20.0 16.1
0 0.64 0 19.5 0 15.1
3.5 5.0 0 0.14 0.19 0
4,066 115 26 35 29 32
720 1,293 9 26 0 0
102 78 0.10 0.18 0.10 0.10
a All values are the averages for duplicate cultures. Under the conditions of this experiment, 4,066 pmol of NO is equivalent to a specific activity of 10⫺18 mol of NO cell⫺1 day⫺1. Experimental details are as for Table 1 except that initial OD660 values were 0.16 to 0.19.
3896
REN ET AL.
containing media and the effects of chlorate and tungstate suggest that assimilatory nitrate reduction, followed by chemical decomposition of nitrite, is a likely mechanism for the production of the relatively large amounts of NO and the smaller amounts of N2O by strain T20 following assimilation in NMS medium. (v) NO synthase, reported in mammalian systems and in a Nocardia sp. (11), requires arginine and O2. NO synthase does not appear to be a likely mechanism in strain T20, since arginine does not stimulate and O2 inhibits NO production. (vi) Anaerobic reduction of NO3⫺ or NO2⫺ to NO can be catalyzed by a xanthine oxidoreductase, an enzyme reported in mammalian systems (29) and in ureide-producing plant root nodules (4) but not to our knowledge in bacteria. Such a mechanism also seems unlikely but remains a possibility for future study. The 250 ppmv (ca. 0.45 M) of NO produced by strain T20 is probably toxic for many microorganisms. Two Micrococcus spp. and a Staphylococcus aureus strain were inhibited markedly by ⬍2 ppmv of NO but, surprisingly, less inhibited if NO was oxidized to NO2 (27). Unrealistically high NO concentrations (ca. 100 M) inhibit oxidase activity of membrane vesicles from anaerobically grown Paracoccus denitrificans and from bovine heart submitochondrial particles (10). In general, the effects of low NO concentrations (⬍5 M) are direct, by binding to heme copper cofactors involved in cellular regulation or by reacting with O2⫺ radicals to produce reactive N oxide species such as peroxynitrite (OONO⫺), NO2, N2O3, and N2O4 (44), which can then exert other indirect effects. These products would be less likely under the hypoxic conditions that promote NO production in strain T20. The manner in which strain T20 might protect itself from toxic NO is not clear from our data. This strain consumes NO rapidly under aerobic conditions, and the lack of net consumption under anaerobiosis suggests that activity of a denitrifying NO reductase with a low Km (1 to 6 nM NO) is unlikely. An NO-binding cytochrome c⬘, as reported in denitrifying Alcaligenes and Achromobacter spp. (46) and in Methylococcus capsulatus (49), and other NO-binding hemoproteins (23) may exert a protective effect. It is also possible that there may be spatial separation of production and consumption in the cell, but the high diffusion velocity of NO would make this unlikely. The aerobic consumption and oxidation of NO by as yet unknown mechanisms in heterotrophs (5, 17, 18, 25) is also not likely under the hypoxic conditions in which most NO is produced, but is probably relevant under aerobic conditions in these methanotrophs (26). The production of NO under O2-deficient conditions by bacteria such as Methylobacter sp. strain T20 may be of ecological significance. Many active methanotrophs occur close to aerobic-anaerobic interfaces in habitats where autotrophic or methanotrophic nitrification can lead to accumulation of NO2⫺ and/or NO3⫺. In such regions, changing location of the interface can cause methanotrophs to suffer O2 deficiency and to contribute to the gross production of NO. Whether this results in emission from the habitat would then depend on all of the NO-consuming microbial activities. Indeed, up to 95% of gross NO production in an organic soil is recycled by oxidation within the soil, greatly restricting emission (19). ACKNOWLEDGMENTS This work was supported by a grant to R.K. from the Natural Sciences and Engineering Research Council of Canada. We thank R. S. Hanson for the gift of Methylobacter luteus and Methylosinus trichosporium OB3b and W. G. Zumft and J. M. Tiedje for permission to use plasmids pnir9 (nirS), pNORCB1 (norB), and
APPL. ENVIRON. MICROBIOL. pMW12 (nosZ) (W.G.Z.), and pRTC19 (nirK) (J.M.T.) obtained through Y. K. Chan. We thank C. Greer for useful discussion and facilities, H. Bergeron for technical help, and two anonymous reviewers for helpful comments. REFERENCES 1. Amaral, J. A., and R. Knowles. 1994. Methane metabolism in a temperate swamp. Appl. Environ. Microbiol. 60:3945–3951. 2. Amaral, J. A., and R. Knowles. 1995. Growth of methanotrophs in methane and oxygen counter gradients. FEMS Microbiol. Lett. 126:215–220. 3. Anderson, I. C., and J. S. Levine. 1986. Relative rates of nitric oxide and nitrous oxide production by nitrifiers, denitrifiers, and nitrate respirers. Appl. Environ. Microbiol. 51:938–945. 4. Atkins, C. A., P. J. Sanford, P. J. Storer, and J. S. Pate. 1988. Inhibition of nodule functioning in cowpea by a xanthine oxidoreductase inhibitor, allopurinol. Plant Physiol. 88:1229–1234. 5. Baumga ¨rtner, M., M. Koschorreck, and R. Conrad. 1996. Oxidative consumption of nitric oxide by heterotrophic bacteria in soil. FEMS Microbiol. Ecol. 19:165–170. 6. Be´dard, C., and R. Knowles. 1989. Physiology, biochemistry, and specific inhibitors of CH4, NH4⫹, and CO oxidation by methanotrophs and nitrifiers. Microbiol. Rev. 53:68–84. 7. Bleakley, B. H., and J. M. Tiedje. 1982. Nitrous oxide production by organisms other than nitrifiers or denitrifiers. Appl. Environ. Microbiol. 44:1342– 1348. 8. Bowman, J. P., L. I. Sly, P. D. Nichols, and A. C. Hayward. 1993. Revised taxonomy of the methanotrophs: description of Methylobacter gen. nov., emendation of Methylococcus, validation of Methylosinus and Methylocystis species, and a proposal that the family Methylococcaceae include only the group I methanotrophs. Int. J. Syst. Bacteriol. 43:735–753. 9. Braker, G., A. Fesefeldt, and K.-P. Witzel. 1998. Development of PCR primer systems for amplification of nitrite reductase genes (nirK and nirS) to detect denitrifying bacteria in environmental samples. Appl. Environ. Microbiol. 64:3769–3775. 10. Carr, G. J., and S. J. Ferguson. 1990. Nitric oxide formed by nitrite reductase of Paracoccus denitrificans is sufficiently stable to inhibit cytochrome oxidase activity and is reduced by its reductase under aerobic conditions. Biochim. Biophys. Acta 1017:57–62. 11. Chen, Y. J., and J. P. N. Rosazza. 1995. Purification and characterization of nitric oxide synthase (NOSNOC) from a Nocardia species. J. Bacteriol. 177: 5122–5128. 12. Conrad, R. 1996. Soil microorganisms as controllers of atmospheric trace gases (H2, CO, CH4, OCS, N2O, and NO). Microbiol. Rev. 60:609–640. 13. Conrad, R. 1996. Metabolism of nitric oxide in soil and soil microorganisms and regulation of flux into the atmosphere, p. 167–203. In J. C. Murrell and D. P. Kelly (ed.), Microbiology of atmospheric trace gases. NATO Sci. Ser. vol. 139. Springer-Verlag, Heidelberg, Germany. 14. Davies, T. R. 1973. Isolation of bacteria capable of utilizing methane as a hydrogen donor in the process of denitrification. Water Res. 7:575–579. 15. De Bont, J. A. M., and E. G. Mulder. 1974. Nitrogen fixation and cooxidation of ethylene by a methane-utilizing bacterium. J. Gen. Microbiol. 83:113–121. 16. Dorsch, M., and E. Stackebrandt. 1992. Some modification in the procedure of direct sequencing of PCR amplified 16S rDNA. J. Microbiol. Methods 16:271–279. 17. Dunfield, P. F., and R. Knowles. 1997. Biological oxidation of nitric oxide in a humisol. Biol. Fertil. Soils 24:294–300. 18. Dunfield, P. F., and R. Knowles. 1998. Organic matter, heterotrophic activity, and NO consumption in soils. Global Change Biol. 4:199–207. 19. Dunfield, P. F., and R. Knowles. 1999. Nitrogen monoxide production and consumption in an organic soil. Biol. Fertil. Soils 30:153–159. 20. Hallin, S., and P.-E. Lindgren. 1999. PCR detection of genes encoding nitrite reductase in denitrifying bacteria. Appl. Environ. Microbiol. 65:1652– 1657. 21. Ji, X.-B., and T. C. Hollocher. 1989. Nitrate reductase of Escherichia coli as a NO-producing nitrite reductase. Biochem. Arch. 5:61–66. 22. Kalkowski, L., and R. Conrad. 1991. Metabolism of nitric oxide in denitrifying Pseudomonas aeruginosa and nitrate respiring Bacillus cereus. FEMS Microbiol. Lett. 82:107–111. 23. Kim, S. O., Y. Orii, D. Lloyd, M. N. Hughes, and R. K. Poole. 1999. Anoxic function for the Escherichia coli flavohaemoglobin (Hmp): reversible binding of nitric oxide and reduction to nitrous oxide. FEBS Lett. 445:389–394. 24. Knowles, R., and E. Topp. 1988. Some factors affecting nitrification and the production of nitrous oxide by the methanotrophic bacterium Methylosinus trichosporium OB3b, p. 383–393. In G. G. Sermanni and P. Nannipieri (ed.), Current perspectives in environmental biogeochemistry. C.N.R.-I.P.R.A., Rome, Italy. 25. Koschorreck, M., E. Moore, and R. Conrad. 1996. Oxidation of nitric oxide by a new heterotrophic Pseudomonas sp. Arch. Microbiol. 166:23–31. 26. Kra ¨mer, M., M. Baumga ¨rtner, M. Bender, and R. Conrad. 1990. Consumption of NO by methanotrophic bacteria in pure culture and in soil. FEMS Microbiol. Ecol. 73:345–350.
VOL. 66, 2000 27. Mancinelli, R., and C. P. McKay. 1983. Effects of nitric oxide and nitrogen dioxide on bacterial growth. Appl. Environ. Microbiol. 46:198–202. 28. Martin, K., L. L. Parsons, R. E. Murray, and M. S. Smith. 1988. Dynamics of soil denitrifier populations: relationships between enzyme activity, mostprobable-number counts, and actual N gas loss. Appl. Environ. Microbiol. 54:2711–2716. 29. Millar, T. M., C. R. Stevens, N. Benjamin, R. Eisenthal, R. Harrison, and D. R. Blake. 1998. Xanthine oxidoreductase catalyses the reduction of nitrates and nitrite to nitric oxide under hypoxic conditions. FEBS Lett. 427: 225–228. 30. Murrell, J. C., and H. Dalton. 1983. Nitrogen fixation in obligate methanotrophs. Appl. Environ. Microbiol. 129:3481–3486. 31. Pichinoty, F. 1973. La re´duction bacte´rienne des compose´s oxyge´ne´s mine´raux de l’azote. Bull. Inst. Pasteur 71:317–395. 32. Remde, A., and R. Conrad. 1991. Production and consumption of nitric oxide by denitrifying bacteria under anaerobic and aerobic conditions. FEMS Microbiol Lett. 80:329–332. 33. Ren, T., J. A. Amaral, and R. Knowles. 1997. The response of methane consumption by pure cultures of methanotrophic bacteria to oxygen. Can. J. Microbiol. 43:925–928. 34. Sambrook, J., T. S. Fritsch, and T. Maniatis. 1989. Molecular cloning: a laboratory manual, 2nd ed. Cold Spring Harbor Laboratory Press, Cold Spring Harbor, N.Y. 35. Samouilov, A., P. Kuppusamy, and J. L. Zweier. 1998. Evaluation of the magnitude and rate of nitric oxide production from nitrite in biological systems. Arch. Biochem. Biophys. 357:1–7. 36. Smith, K. S., A. M. Costello, and M. E. Lidstrom. 1997. Methane and trichloroethylene oxidation by an estuarine methanotroph, Methylobacter sp. strain BB5.1. Appl. Environ. Microbiol. 63:4617–4620. 37. Smith, M. S. 1983. Nitrous oxide production by Escherichia coli is correlated with nitrate reductase activity. Appl. Environ. Microbiol. 45:1545–1547. 38. Stohl, A., E. Williams, G. Wotowa, and H. Kromp-Kolb. 1996. A European inventory of soil nitric oxide emissions and the effect of these emissions on
NITRIC OXIDE METABOLISM BY METHANOTROPHS
3897
the photochemical formation of ozone. Atmos. Environ. 30:3741–3755. 39. Takahashi, H., and A. Nason. 1957. Tungstate as a competitive inhibitor of molybdate in nitrate assimilation and N2 fixation by Azotobacter. Biochim. Biophys. Acta 23:433–434. 40. Takeda, K. 1988. Characteristics of a nitrogen-fixing methanotroph, Methylocystis T-1. Antonie van Leeuwenhoek J. Microbiol. Serol. 54:521–534. 41. Tourova, T. P., M. V. Omel’chenko, K. V. Fegeding, and L. V. Vasil’eva. 1999. The phylogenetic position of Methylobacter psychrophilus sp. nov. Microbiology 69:493–495. (Translated from Microbiologiya 68:568–570, 1998.) 42. Whittenbury, R., K. C. Phillips, and J. F. Wilkinson. 1970. Enrichment, isolation and some properties of methane-utilizing bacteria. J. Gen. Microbiol. 61:205–218. 43. Williams, E. J., A. Guenther, and F. C. Fehsenfeld. 1992. An inventory of nitric oxide emissions from soils of the United States. J. Geophys. Res. 97:7511–7519. 44. Wink, D. A., M. B. Grisham, J. B. Mitchell, and P. C. Ford. 1996. Direct and indirect effects of nitric oxide in chemical reactions relevant to biology. Methods Enzymol. 268:12–31. 45. Yoshida, T., and M. Alexander. 1970. Nitrous oxide formation by Nitrosomonas europaea and heterotrophic microorganisms. Soil Sci. Soc. Am. Proc. 34:880–882. 46. Yoshimura, R., H. Iwasaki, S. Shidara, S. Suzuki, A. Nakahara, and T. Matsubara. 1988. Nitric oxide complex of cytochrome c⬘ in cells of denitrifying bacteria. J. Biochem. 103:1016–1019. 47. Yoshinari, T. 1985. Nitrite and nitrous oxide production by Methylosinus trichosporium. Can. J. Microbiol. 31:139–144. 48. Yoshinari, T., and R. Knowles. 1976. Acetylene inhibition of nitrous oxide reduction by denitrifying bacteria. Biochem. Biophys. Res. Commun. 69: 705–710. 49. Zahn, J. A., D. M. Arciero, A. B. Hooper, and A. A. DiSpirito. 1996. Cytochrome c⬘ of Methylococcus capsulatus Bath. Eur. J. Biochem. 240:684–691. 50. Zumft, W. 1993. The biological role of nitric oxide in bacteria. Arch. Microbiol. 160:253–264.