Journal of Human Hypertension (2002) 16, 111â116. 2002 Nature Publishing Group All rights reserved 0950-9240/02 $25.00 www.nature.com/jhh. ORIGINAL ...
Journal of Human Hypertension (2002) 16, 111–116 2002 Nature Publishing Group All rights reserved 0950-9240/02 $25.00 www.nature.com/jhh
ORIGINAL ARTICLE
Prognostic value of blood pressure in acute stroke AMHP Boreas1, J Lodder1, F Kessels2, PW de Leeuw3 and J Troost1 1
Department of Neurology, University Hospital of Maastricht, The Netherlands; 2Clinical Epidemiology and MTA, University Hospital of Maastricht, The Netherlands; 3Internal Medicine, University Hospital of Maastricht, The Netherlands
Manipulation of blood pressure (BP) in acute stroke may improve outcome. Despite various studies, data on the prognostic significance of early BP in stroke remain unclear. Therefore, we studied the relationship between various BP variables in the acute phase of stroke and functional outcome at 3 months. Blood pressures were collected by reviewing BP records of 817 patients who were admitted to our stroke unit between 1987 and 1992. Besides the first systolic and diastolic admission BP (SBP and DBP), we also used the mean of the daytime as well as the night-time systolic and diastolic BP values. Finally, we studied the relationship between the decrease in BP between day 0 and 4 and outcome. As dependent outcome variable we used the Rankin handicap score at 3 months dichotomized in a score ⬎3 (poor outcome) vs a score ⭐3 (good outcome). A total of 430 patients were admitted within 24 h following stroke
onset. There was no significant relationship between the systolic and diastolic BP and the outcome at 3 months. Only night-time systolic BP ⭓165 mm Hg (odds ratio (OR) 2.8; 95% CI 1.1–6.8), night-time diastolic BP ⭐60 mm Hg (OR 8.1; 95% CI 1.1–58.3), and a decrease in daytime diastolic BP between day 0 and 4 of ⭓10 mm Hg (OR 3.0; 95% CI 1.1–7.9) showed a significant relationship with poor outcome. Our findings suggest that admission BP values may not reliably reflect any impact of BP on stroke outcome. They also suggest a potential differential effect of BP manipulation: increasing or decreasing BP may be beneficial for patients with BP extremes in one direction, but detrimental for those with BP values in the opposite direction. Journal of Human Hypertension (2002) 16, 111–116. DOI: 10.1038/sj/jhh/1001304
Keywords: blood pressure; acute stroke; prognosis
Introduction A transient increase in arterial blood pressure (BP) frequently occurs in patients with acute stroke.1–3 This could be a physiological response to maintain or enhance perfusion of reversibly damaged cerebrum, when normal autoregulatory mechanisms are impaired.4 However, the general benefit of such a response could be questioned, as high BP in the early phase has been linked to poor outcome, particularly in patients with impaired consciousness.5,6 In a recent overview Bath5 reported that some studies failed to establish a relationship between admission BP and outcome,7,8 although low systolic pressure may be associated with poor outcome.2,5 Most series so far included only single admission BP readings to study outcome.6,9–12 More-over, BP was not always studied as an independent predictor.10 A single admission BP value may not reflect
the extent to which BP changes over time may influence outcome, especially since the ischaemic penumbra may be present for a prolonged period of time. Furthermore, variations in BP occur as a result of diurnal rhythm. Earlier studies reported that patients with a blunted fall in nocturnal BP are more likely to suffer hypertensive target-organ damage, which would mean that BP during sleep is more closely related to target-organ damage than BP in the awake state.13–17 Therefore, in the present study, we analysed various BP characteristics (including daytime and night-time BP values) as independent predictors of outcome at 3 months in patients admitted to a stroke unit within 24 h following stroke onset. We also explored whether a drop in BP values during the first 4 days was related to outcome.
Patients and methods Data collection
Correspondence: AMHP Boreas, Department of Neurology, University Hospital of Maastricht, Postbus 5800, 6202 AZ Maastricht, The Netherlands. E-mail: Abore얀sneu.azm.nl Received 23 March 2001; revised 2 August 2001; accepted 14 September 2001
Blood pressure values were collected by reviewing BP records of patients registered in an ongoing stroke registry at the University Hospital of Maastricht. The University Hospital is the only hospital
Prognostic value of BP in acute stroke AMHP Boreas et al
112
in the region of Maastricht and has an adherent population of approximately 190 000 people. The stroke registry contains data of patients who had been admitted to the neurological department or had visited the outpatient’s clinic, with a first-ever clinical cerebral brain infarct with symptoms lasting longer than 24 h. Routine investigations included standard blood tests, electrocardiogram, chest X-ray, CT scan of the brain and noninvasive carotid artery studies. Echocardiography, 24-h ECG monitoring and cerebral angiography were done in selected cases. In this study, 430 patients with a clinical first-ever infarct had been admitted within 24 h following stroke onset. Patients admitted to hospital stayed on the stroke unit until they were neurologically stable, after which they were transferred to the general neurological ward. Blood pressure was recorded manually by experienced nursing staff with a mercury sphygmomanometer (blood pressure values at 1st and 5th Korotkoff sounds taken as systolic and diastolic, respectively). For this study we only used those BP values that were obtained during the first 24 h after admission: for the daytime BP value we took the average of three BP values recorded at 10.00, 15.00 and 18.00 and for the night-time BP value we took the average of three BP values recorded at 24.00, 03.00 and 06.00. BP values registered between 06.00 and 09.00 and between 18.00 and 24.00 were not included in the analyses, because in these periods it is assumed that the BPswitch between the night-time and daytime period occurs.18 We also analysed the first blood pressure taken after admission to the stroke unit.
Outcome measures All patients were studied as part of a long term follow-up study of stroke. For the present study the score on the Rankin handicap-scale at 3 months was used as outcome variable.19 The score was dichotomized into a score ⬎3 (poor outcome) versus a score ⭐3 (good outcome).20
Blood pressure variables As it is unknown which BP variable is the best predictor of stroke outcome, we explored the following variables: • first systolic BP (first SBP) and first diastolic BP (first DBP) measured after admission to the stroke unit; • daytime systolic BP (daytime SBP) and diastolic BP (daytime DBP), as defined above; • night-time systolic BP (night-time SBP) and diastolic BP (night-time DBP), as defined above. Journal of Human Hypertension
Definitions and descriptions Hypertension was defined as known hypertension (BP recordings of more than 160 mm Hg systolic and/or 90 mm Hg diastolic pressure on at least two different occasions) whether or not treated with antihypertensive medication before the stroke occurred. Diabetes mellitus (DM) was defined as known diabetes treated with diet or medication, or either a fasting blood glucose higher than 7 mmol/l or a postprandial blood glucose higher than 11 mmol/l measured on at least two separate occasions before the stroke. Ischaemic heart disease (IHD) was defined as a history of angina pectoris, myocardial infarction or coronary bypass operation. Brain infarct was defined as the rapid onset of clinical signs of focal cerebral function disturbance, lasting longer than 24 h or leading to death, with no apparent cause other than that of vascular origin with normal CT, or CT showing an area of low attenuation compatible with the clinical signs and symptoms, or autopsy revealing an infarct compatible with the clinical signs and symptoms. When CT scan had not been performed (21 of the 430 cases), we used the Guy’s Hospital Stroke Diagnostic Score (Allen score): an Allen score less than 4 indicated a probability of 90% or more that the stroke was due to infarction.21,22 A lacunar infarct (LACI) was defined as an acute stroke syndrome with a CT lesion compatible with occlusion of a single perforating artery, ie, a small, subcortical, sharply marginated hypodense lesion with a diameter smaller than 15 mm (small deep infarct), or as a specific lacunar syndrome (ie, unilateral motor and/or sensory symptoms and signs that completely involved at least two of three body parts (face, arm, and leg) without disturbance of consciousness or language, visual field defect, or other signs of cortical dysfunction) when the CT scan showed no specific lesion. A potential cardioembolic stroke cause was not taken into account when assigning patients to this infarct subgroup. A territorial infarct was defined as an acute stroke syndrome with CT findings compatible with infarction involving the cortex, or when no specific lesion was visible on CT, as a clinically identified cortical syndrome consisting of unilateral motor and/or sensory symptoms and signs in combination with signs of cortical dysfunction with or without visual field defect, or as isolated monoparesis or as isolated cortical dysfunction (usually dysphasia). Patients with a large subcortical infarct were included in the territorial infarct group because of similar pathogenesis. Territorial infarct patients with a potential cardioembolic stroke source were assigned to the cardioembolic stroke subgroup (CE). Such patients had at least one of the following cardiac features: chronic or intermittent ECG confirmed atrial fibrillation; left ventricular myocardial infarction within 6 weeks
Prognostic value of BP in acute stroke AMHP Boreas et al
preceding stroke; left ventricular or atrial thrombus; left ventricular aneurysm; left ventricular akinetic segment; cardiomyopathy; mitral or aortic valve abnormalities (endocarditis, mitral stenosis, prosthetic aortic or mitral valves); and in young patients without any other specific stroke cause: atrial septal defect, ventricle septal defect. The remaining patients with a non-cardioembolic symptomatic territorial infarct (presumably large vessel disease, ie atherothrombosis or artery-to-artery embolism whether or not confirmed by noninvasive carotid studies) were considered as one group and assigned to the atherothrombotic infarct subgroup (AT). There were 21 patients with a ‘rare’ stroke cause, such as arterial dissection, vasculitis, fibromuscular dysplasia, haematological disorder, etc. Because of small numbers and heterogeneity in stroke cause, this group was not included in this study, leaving 409 patients for analysis. Statistical analysis For analysis we used a logistic regression model containing the following independent variables: stroke type (LACI vs CE and vs AT), Rankin score on first examination in hospital (score 1, 2 vs 3–5) as a measure of stroke severity, age (⬍60 vs 60–75 and vs ⬎75 years), IHD, sex, DM, hypertension before stroke and the various BP variables. As dependent outcome variable we used the Rankin handicap score at 3 months, dichotomized in a score ⬎3 vs a score ⭐3. Eighty-three (20%) patients died during the first 3 months, for analysis this group was included in the poor outcome group. To determine the cut-off points for the different BP values we used the following method: (1) The Rankin score at 3 months was dichotomized into a score ⬎3 vs ⭐3. (2) The patients were sorted in ascending order by their BP. (3) For patients with the same BP, the mean of the dichotomized Rankin score was calculated; this new mean Rankin value was subsequently assigned to all patients with this same BP. (4) The moving averages of the new mean Rankin scores were calculated, using a group size of 101 patients.23 (5) As the calculated average could be interpreted as an estimate of the probability of an outcome with a Rankin score ⬎3, the Odds of this average was calculated as the average divided by one minus the average. Subsequently, the logarithm of this Odds (logOdds) was taken for further analysis. We used the logarithmic function of the Odds, because the logistic regression analysis is also based on a logarithmic function of the Odds. (6) The logOdds was plotted against the blood pressure value of the corresponding patient. Based upon these plots, the BP data were divided into three parts: cut-off points were established at
10 mm Hg below and 10 mm Hg above the BP value that went together with the lowest logOdds. The BP data were put into the multivariate logistic regression model. By changing the cut-off points by adding or subtracting 5 mm Hg, we tried to determine which cut-off points showed the most significant relationship with outcome.
113
Results A total of 409 patients were admitted within 24 h following stroke onset (designated as day 0). Of these 403 patients had BP values registered during these first 24 h. Only 291 patients had BP measurements taken during the daytime, whereas 284 had BP measurements taken during the night-time on day 0. Table 1 shows the distribution of the independent variables between the different stroke subtype groups. Figures 1 and 2 display the relationship between Table 1 Patient characteristics in stroke subgroups Total group (n = 403) n (%) Sex male female Age: median (range) IHD DM HT Rankin score ⭐2 ⬎2
196 (51) 207 (49) 73 (24–96)
Laci (n = 106) n (%)
54 (51) 52 (49) 69 (39–95)
CE (n = 126) n (%)
AT (n = 171) n (%)
46 (37) 80 (63) 77 (24–96)
96 (56) 75 (44) 73 (39–92)
118 (29) 29 (27) 48 (38) 74 (18) 15 (14) 30 (24) 189 (47) 52 (49) 61 (48) on first examination in hospital 73 (18) 40 (38) 16 (13) 330 (82) 66 (62) 110 (87)
41 (24) 29 (17) 76 (45) 17 (10) 154 (90)
IHD, ischaemic heart disease; DM, diabetes mellitus; HT, hypertension; CE, cardioembolic stroke subgroup; AT, atherothrombotic infarct subgroup.
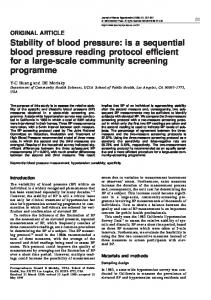
Figure 1 The logOdds of the moving average of the dichotomized Rankin (⬎3 vs ⭐3) plotted against the systolic blood pressure. Journal of Human Hypertension
Prognostic value of BP in acute stroke AMHP Boreas et al
114
Table 3 Relationship between the daytime and night-time BP variables and outcome: Rankin ⬎3 vs ⭐3 BP values (mm Hg)
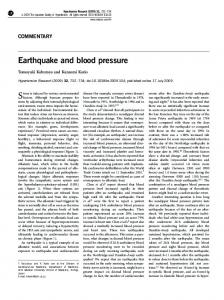
Figure 2 The logOdds of the moving average of the dichotomized Rankin (⬎3 vs ⭐3) plotted against the diastolic blood pressure.
the logOdds (Rankin at 3 months ⬎3 vs ⭐3) and the different first systolic and diastolic BP values. These (univariate) plots suggest that both low and high BP values are associated with poor outcome (Rankin score ⬎3). According to the plot, cut-off SBP values that were used for further analysis were chosen as 130 and 150 mm Hg. However, when fed into the multivariate logistic regression analysis, these values did not show a significant relationship with the outcome at 3 months. Shifting the cut-off points by adding or subtracting 5 mm Hg did not improve the relationship with outcome (Table 2). Similarly, there was no significant relationship with the outcome for DBP values (Table 2). By analysing the daytime and night-time systolic and diastolic BP values in the same way, we found that a night-time systolic BP ⭓165 vs 131–164 mm Hg and a night-time diastolic BP ⭐60 vs 61–109 mm Hg reached statistical significance as an independent predictor of stroke outcome with an odds ratio (OR) of respectively 2.8 and 8.1 (Table 3). By testing the relationship between the decrease in BP values between day 0 and 4, and stroke outcome at 3 months, only a decrease in daytime Table 2 Relationship between first BP variables and outcome: Rankin ⬎3 vs ⭐3 First BP-values (mm Hg) First SBP ⭐130 (n = 97) vs 131–149 (n = 74) ⭓150 (n = 232) vs 131–149 First DBP ⭐90 (n = 265) vs 91–109 (n = 92) ⭓110 (n = 46) vs 91–109
OR
95% CI
P-value
1.10
0.43–2.83
NS
1.38
0.58–3.31
NS
1.07
0.49–2.36
NS
2.11
0.70–6.33
NS
SBP, systolic blood pressure; DBP, diastolic blood pressure; OR, odds ratio; CI, confidence interval. Journal of Human Hypertension
Daytime SBP ⭐145 (n = 157) vs 146–164 (n = 57) ⭓165 (n = 77) vs 146–164 Daytime DBP ⭐100 (n = 262) vs 101–119 (n = 24) ⭓120 (n = 5) vs 101–119 Night-time SBP ⭐130 (n = 85) vs 131–164 (n = 129) ⭓165 (n = 70) vs 131–164 Night-time DBP ⭐60 (n = 12) vs 61–109 (n = 264) ⭓110 (n = 8) vs 61–109
OR
95% CI
P-value
0.72
0.28–1.86
NS
1.12
0.38–3.28
NS
1.01
0.29–3.54
NS
0.12
0.01–2.36
NS
1.34
0.58–3.11
NS
2.76
1.12–6.79
0.03
8.13
1.13–58.28
0.03
1.52
0.18–12.70
NS
SBP, systolic blood pressure; DBP, diastolic blood pressure; OR, odds ratio; CI, confidence interval.
diastolic BP of ⭓10 mm Hg showed a significant relationship with outcome: OR 3.0 (Table 4). Linear regression analysis showed no significant relationship between infarct size or site and initial (first) BP level.
Discussion Our data on the first post-stroke BP measurements suggest that high systolic and low diastolic values are associated with unfavourable outcome. Other studies also found that extreme BP values towards the lower5,24 and higher6,9,25,26 end may be related with poor stroke outcome. However, after we adjusted for other prognostic variables by using a multivariate logistic regression analysis, first measured BP levels could not be identified as independent predictors of outcome. These findings warn against unadjusted analyses of first post-stroke BP as outcome predictor. Nocturnal BP values may have a stronger predicTable 4 Relationship between the decrease in BP variables and outcome: Rankin ⬎3 vs ⭐3 Decrease in BP variables (mm Hg) Daytime SBP ⭐0 (n = 53) vs 1–19 (n = 53) ⭓20 (n = 74) vs 1–19 Daytime DBP ⭐−5 (n = 34) vs −4 to 9 (n = 53) ⭓10 (n = 93) vs −4 to 9 Night-time SBP ⭐5 (n = 28) vs 6–24 (n = 16) ⭓25 (n = 12) vs 6–24 Night-time DBP ⭐0 (n = 24) vs 1–19 (n = 20) ⭓20 (n = 12) vs 1–19
OR
95% CI
P-value
1.36 2.17
0.46– 4.05 0.79–5.96
NS NS
3.42 2.97
0.98–11.87 1.11–7.94
NS 0.03
1.79 1.15
0.29–11.22 0.14 –9.22
NS NS
3.17 0.82
0.49–20.62 0.09–7.35
NS NS
OR, odds ratio; CI, confidence interval.
Prognostic value of BP in acute stroke AMHP Boreas et al
tive value for end-organ damage than daytime values.13–18,27,28 A differential effect might also exist in relation to stroke outcome. Moreover, instead of analysing a single measurement such as the first one post-stroke, using several BP measurements may more reliably reflect any impact of BP level on brain tissue damage or salvage.3,16,29,30 Therefore, we studied a number of daytime and night-time BP values in separate analyses. Especially high night-time systolic and low night-time diastolic values were identified as independent predictors of stroke outcome. Although we cannot rule out the influence of several factors leading to high (eg during micturation) or low (eg as a result of volume depletion) BP values during night-time, we did not find a significant relationship between infarct size or site and initial BP level. So, our data suggest that sustained nighttime BP values that are either extremely low or high are prognostically unfavourable. If high BP values relate to poor outcome, it seems logical to improve prognosis by lowering blood pressure. However, our data suggest that a spontaneous BP decrease in the first 5 days may be independently related to poor outcome. Others also found BP decreases to be related to an unfavourable prognosis.1,5 These findings warn against a too rigorous lowering of early post-stroke BP in future clinical trials. An obvious limitation of our study is its retrospective character. Consequently, the number of BP measurements may well relate to the measured BP level as extremely high and low values may dictate the number of subsequent BP measurements. This could create bias towards an increased chance of detecting extreme values, thus overestimating the strength of the association between these values and outcome. To overcome this problem, it would have been better to use 24-h BP monitoring. Since this was a retrospective study, we tried to restrict this bias by analysing the significance of admission BP separately. We analysed early post-stroke BP values from the perspective of a potentially salvageable penumbra during this period, as any BP-related adverse effects on the brain may be amenable by early intervention. 25,31 Since PET-studies suggest that the penumbra may exist up to 18 h after stroke onset,32–35 we included BP-values taken within the first 24 h, instead of BP-values measured within a shorter period following stroke onset. Our data do not contradict the idea of therapeutic manipulation of post-stroke blood pressure. Indeed, lowering a very high BP may be beneficial, provided it is not lowered too drastically, while conversely increasing a low BP may confer benefit as well.5 Nevertheless, therapeutic BP manipulations should only cautiously be explored, on an individual patient basis. Furthermore, a single, first post-stroke BP measurement is probably not sufficient to rely on for such clinical trials. Multiple measurements may more reliably guide any BP
manipulation, but as this takes time, it may preclude the advent of any therapeutic effect.
115
References 1 Chamorro A et al. Blood pressure and functional recovery in acute ischemic stroke. Stroke 1998; 29: 1850–1853. 2 Feldmann E, Skolnick BE. Cerebral hemodynamics, autoregulation, and blood pressure management. J Stroke Cerebrovasc Dis 1999; 8: 176–182. 3 Robinson T et al. The predictive role of 24-hour compared to casual blood pressure levels on outcome following acute stroke. Cerebrovasc Dis 1997; 7: 264 –272. 4 Harper G, Castleden CM, Potter JF. Factors affecting changes in blood pressure after acute stroke. Stroke 1994; 25: 1726–1729. 5 Bath FJ, Bath PMW. What is the correct management of blood pressure in acute stroke? The Blood Pressure in Acute Stroke Collaboration. Cerebrovasc Dis 1997; 7: 205–213. 6 Carlberg B, Asplund K, Ha¨ gg E. The prognostic value of admission blood pressure in patients with acute stroke. Stroke 1993; 24: 1372–1375. 7 Adams GF. Prospects for patients with strokes, with special reference to the hypertensive hemiplegic. BMJ 1965; ii: 253–259. 8 Droller H. The outlook in hemiplegia. Geriatrics 1965; 20: 630–636. 9 Da´ valos A et al. Deteriorating ischemic stroke: risk factors and prognosis. Neurology 1990; 40: 1865–1869. 10 Allen CMC. Predicting the outcome of acute stroke: a prognostic score. J Neurol Neuro Surg Psychiatry 1984; 47: 475– 480. 11 Terayama Y, Tanahashi N, Fukuuchi Y, Gotoh F. Prognostic value of admission blood pressure in patients with intracerebral hemorrhage. Stroke 1997; 28: 1185–1188. 12 He´ non H et al. Early predictors of death and disability after acute cerebral ischemic event. Stroke 1994; 26: 392–398. 13 Yamamoto Y et al. Adverse effect of nighttime blood pressure on the outcome of lacunar infarct patients. Stroke 1998; 29: 570–576. 14 Dawson SL et al. Diurnal blood pressure change varies with stroke subtype in the acute phase. Stroke 1998; 29: 1519–1524. 15 Sander D, Klingelho¨ fer J. Changes of circadian blood pressure patterns after hemodynamic and thromboembolic brain infarction. Stroke 1994; 25: 1730–1737. 16 Mansoor GA, White WB. Ambulatory blood pressure monitoring in cerebrovascular and retinal vascular disease. J Stroke Cerebrovasc Dis 1997; 6: 313–318. 17 Maeda Y et al. Diurnal blood pressure rhythm in hypertensives with parental history of stroke. Am J Hypertens 1997; 10: 562–564. 18 Elliott WJ. Circadian variation in blood pressure. Implications for the elderly patient. Am J Hypertens 1999; 12: 43S– 49S. 19 Rankin J. Cerebral vascular accidents in patients over the age of 60: II. Prognosis. Scott Med J 1957; 2: 200– 215. 20 Sulter G, Steen C, De Keyser J. Use of the Barthel Index and Modified Rankin Scale in acute stroke trials. Stroke 1999; 30: 1538–1541. 21 Allen CMC. Clinical diagnosis of the acute stroke synJournal of Human Hypertension
Prognostic value of BP in acute stroke AMHP Boreas et al
116
22 23 24 25 26 27 28 29
drome. Quart J Med, New Series LII 1983; 208: 515– 523. Bamford J, Sandercock P, Jones L, Warlow C. The natural history of lacunar infarction: The Oxfordshire Community Stroke Project. Stroke 1987; 18: 545–551. Chau NP et al. Relationships between cardiac output, heart rate and blood volume in essential hypertension. Clin Science Mol Med 1978; 54: 175–180. Wallace JD, Levy LL. Blood pressure after stroke. JAMA 1981; 246: 2177–2180. Powers WJ. Acute hypertension after stroke: the scientific basis for treatment decisions. Neurology 1993; 43: 461– 467. Britton M, Carlsson A. Very high blood pressure in acute stroke. J Int Med 1990; 228: 611–615. Shimada K et al. Diurnal blood pressure variations and silent cerebrovascular damage in elderly patients with hypertension. J Hypertens 1992; 10: 875–878. Lip GYH, Gibbs CR, Beevers DG. Ambulatory blood pressure monitoring and stroke: more questions than answers. Stroke 1998; 29: 1495–1497. Kukla C et al. Changes of circadian blood pressure patterns are associated with the occurrence of lacunar infarction. Arch Neurol 1998; 55: 683–688.
Journal of Human Hypertension
30 Lip GYH et al. Ambulatory blood pressure monitoring in acute stroke: The West Birmingham Stroke Project. Stroke 1997; 28: 31–35. 31 Jørgensen HS, Nakayama H, Olsen TS. Treatment of arterial hypertension in acute stroke. In: Castillo J, Da´ valos A, Toni D (eds). Management of Acute Ischemic Stroke. Springer-Verlag, Iberica: Barcelona, 1997, pp 81–87. 32 Baron JC. Perfusion thresholds in human cerebral ischemia: historical perspective and therapeutic implications. Cerebrovasc Dis 2001; 11 (Suppl): 2–8. 33 Furlan M et al. Spontaneous neurological recovery after stroke and the fate of the ischemic penumbra. Ann Neurol 1996; 40: 216–226. 34 Marchal G et al. Prolonged persistence of substantial volumes of potentially viable brain tissue after stroke. A correlative PET-CT study with voxel-based data analysis. Stroke 1996; 27: 599–606. 35 Marchal G et al. Voxel-based mapping of irreversible ischaemic damage with PET in acute stroke. Brain 1999; 122: 2387–2400.