Secondly, we have developed a novel multi-line light source by combining a broadband optical source with a Michelson interferometer, where the latter contains ...
mURS CHEBCAL ELSEVIER
Sensors and Actuators B 29 11995) 87 93
Progress with optical gas sensors using correlation spectroscopy J.P. Dakin, H.O. Edwards 1, B.H. Weigl Optoelectronics Research Centre, University of Southampton, Southampton S09 5NH, UK
Abstract
The paper reviews recent progress on gas detection using real-time correlation spectroscopy. The general method relies on using a gas sample in a reference cell as a matched optical filter to detect, preferentially, similar absorption spectra in a measurement cell. All variations of the method have the advantage of excellent selectivity for gases with narrow line spectra, even when using broadband sources for illumination. They are also suitable for remote detection over optical-fibre leads. The recent progress is in two main areas. First, the earlier reported Stark modulation method has been extended to investigate a novel hygrometer. Secondly, we have developed a novel multi-line light source by combining a broadband optical source with a Michelson interferometer, where the latter contains a gas in one arm.
Keywords: Correlation spectroscopy; Optical sensors; Gas sensors
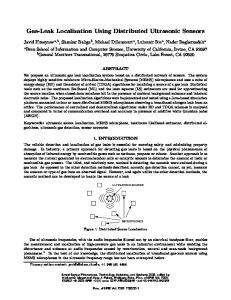
1. Introduction Many c o m m o n gases of industrial and environmental importance exhibit their fundamental optical absorption in the infrared region. Weaker overtone bands extend into the near infrared and visible region, thus coinciding with the low-loss transmission window for silica fibre. Absorption in these regions is usually d u e to transitions between vibrational-rotational energy levels of the molecule. As the fine-line structure within an absorption band is highly specific to the gas species, recognition of these features provides for highly selective gas detection. The band positions of a selection of c o m m o n gases are shown in simple form in Fig. 1, together with the absorption spectrum of silica optical fibre. Infrared fibres, typically manufactured from fluoride glasses, are also available with acceptable loss at wavelengths up to 51am. The fibres make the stronger fundamental gas absorptions accessible via remote leads, thereby enhancing the potential detection sensitivity, but have a much higher cost and are not so mechanically robust. The low loss of silica optical fibres allows a gas-sampling cell to be located m a n y kilometres from the ~ Invited paper. Present address: North West Water Ltd, Warrington WA5 3LW, UK. 0925-4005/95/$09.50 © 1995
SSDI 0925-4005(95)01667-K
Elsevier Science S.A. All rights reserved
monitoring station with little degradation of the signal. The passive nature of the sensor head and the low optical power used make such optical techniques inherently safe for hazardous applications, such as the monitoring of explosive gases [1,2]. Early fibre-optic-based methods measured gas transmission using broadband L E D sources [3] and thus had poor selectivity. Other recent methods have used laser sources [4], but these can present problems due to the long coherence length; in particular modal noise effects in multimode fibre. Even when single-mode fibre is used to prevent this, effects such as F a b r y - P ~ r o t etalons at connectors, and more complex interference patterns within the measurement cell and launch optics, can
2O
10
H2i Ni3 CH4 H20 002
O0.8 1.0 Wavelength ~~,1.8 2.0 1,2 ..... 1.4 1.6 (IJm) Fig. l. Absorption bands of some c o m m o n gases within the transmission window for silica fibre.
88
J.P. Dakin et al. / Sensors and Actuators B 29 (1995) 87 93
potentially cause severe practical limitations. Correlation spectroscopy [5 8] allows the use of a broadband source, yet still monitors the fine spectral features of the gas spectrum. It has the further advantage of employing all of the spectral information contained in the selected gas absorption band, rather than just a single line, thereby enhancing the cognitive nature of the technique. The basic methods of real-time correlation spectrometry all involve modulation of the absorption spectrum of the reference gas sample, relative to the gas to be measured. Modulation can be achieved directly by varying the absorption spectrum of the reference gas. In an earlier paper [8], we reviewed progress with three modulation techniques, each using the correlation spectroscopy method. These included Stark, pressure and phase modulation. A common optical configuration was adopted for all of the schemes investigated in the study, as shown schematically in Fig. 2(a) and (b). The apparatus comprised two gas cells, through which light from a broadband source was passed sequentially, prior to detection. In the fibre-remoted version, light was conveyed to the cells via multimode optical fibre, and a bandpass filter was included before the detector in order to attenuate light outside the absorption band of the relevant gas. The gas to be detected was directed into the measurement cell, whereas the reference cell was filled with a known concentration of the gas to be detected and then sealed. Modulation of the absorption spectrum of either gas cell resulted in a change in the correlation between the spectrum of the measurement gas sample and that of the reference gas, thereby causing a variation in the transmission of the system. The absorption spectrum of the gas contained in the reference cell was modulated, either directly or indirectly, in order to produce the desired signal. The synchronously detected output signal then depended on the concentration of the correlating gas in the measurement cell. Modulation methods that act directly on the gas include Stark and pressure modulation, as depicted in Fig. 2(a). Measurement
Cell
Reference Cell Multlmode Fibre
(a)
Broadband Source
/
Measurement
Broadband Source
Cell
In our earlier paper [8], Stark modulation was used for the detection of ammonia gas. The Stark effect is potentially very attractive, as it is only necessary to apply an electric field to the gas cell in order to cause a synchronous modulation of the detected signal. The only disadvantages are the high field strength required to produce even a low amplitude-modulation index in the detected signal and the fact that only certain gases are Stark active. In order to be Stark active (i.e., suffer line splitting or broadening under the influence of an electric field) a gas must have a strong electrical dipole moment. Traditional water-vapour sensors have many applications in industry and meteorology. Despite having been commercially available for many years, there
CONNECTION
Detector (Pressure,Stark)
(b)
Reference Cell
Multlmode Fibre
1
~ Modulation (Frequency-shift)
2. Water vapour sensing (hygrometry) using Stark modulation spectroscopy
Bandpass )/Filter
,~ Modulation
Stark modulation of gases occurs only with polar molecules and results from the splitting (or, at atmospheric pressure the broadening) of individual absorption lines when a large electric field is applied. The pressure-modulation technique is more generally applicable. This involves periodically pressurizing the gas within the reference cell, causing a variation in both the strength and width of the absorption lines. A third modulation approach is indirect and involves a redistribution of the optical spectrum of the light, as it passes from the measurement to the reference cell, as shown schematically in Fig. 2(b). Angle modulation of the light (using phase or frequency modulation) is a means of achieving this.
f
CONNECTION
Bsndpaes Fll,er
Detector
Fig. 2. Schematic diagram for the correlation spectroscopy scheme: (a) pressure and Stark modulation; (b) angle modulation.
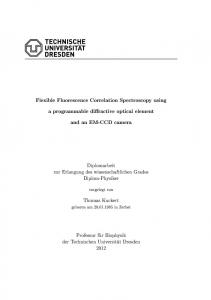
Fig. 3. Schematic of experimental Stark cell for applying electric field to a water-vapour sample. (Upper cell is heated above temperature of lower cell to avoid condensation.)
J.P. Dakin et al. / Sensors and Actuators B 29 (1995) 87 93
are few, if any, hygrometers that perform reliably over an extended temperature range. The H 2 0 molecule is strongly polarized and therefore has the necessary dipole moment for Stark modulation. However, as water is not particularly volatile at room temperature, a heated Stark cell is necessary, first to maintain a sufficiently high vapour pressure in the cell to produce a strong absorption, and secondly to prevent the possibility of condensation on the windows or electrical components, which would occur if the cell were to cool below the dew point. The basic design of our prototype cell is shown in Fig. 3. The 160 m m x 18 m m x 5 m m electrodes were held 6 m m apart using polymer spacers. The electrode/ spacer structure was mounted in a horizontal glass tube fitted with end windows. The horizontal tube (the reference gas cell) was connected to a lower-level water reservoir. Both gas cell and water reservoir could be heated electrically, with the resevoir being held at the lower temperature. The gas cell was connected to an electrical drive unit, via feedthrough leads sealed into the glass walls, in order to provide a high field strength across the water vapour between the electrodes. The electrical drive to the Stark cell was from a combined a.c. plus d.c. high-voltage unit, capable of applying a 2.0 kV p p a.c. signal at 7.1 kHz and adding a 2.0 kV d.c. bias signal. The latter was necessary to ensure a Stark-modulation component at the fundamental frequency of 7.1 kHz. Stark modulation of the optical amplitude is approximately proportional to the square of the applied voltage and therefore an a.c. signal alone would result in a modulation at the second harmonic of the applied frequency. The Stark effect results in a modulation of the linewidth of the gas absorption in the reference cell, which changes the
]l REFERENCE INPUT
I LOCK-INAMPLIFIER I INCLUDING PHASE SHIFTER I SIGNALINPUT AMPLIFIER~
SUMMING NODE
I = F.oM
OPTICAL DETECTOR
TOSTARKCELL
OSCIU
overlap integral of the gas absorption in the reference cell and that in the measurement one [8]. In order to detect the small a.c. modulation signal at the detector, the lock-in amplifier arrangement shown in Fig. 4 was used. In order to determine the modulation index of the received light, and hence reference the detection scheme, a d.c. signal was also derived from the output of the transimpedance receiver. Fig. 5(a) shows the detected signal when light from a tungsten halogen source was collimated through the Stark cell and detected via a narrow-band interference filter corresponding to the water band at 1.94 gin_+ 10 nm. The two states represent conditions when the beam was allowed to reach the detector and when the beam was blocked off. It was confirmed using a m o n o c h r o m a t o r that the modulation only occurred in the main water bands at 1.4 and 1.9 ~tm. The modulation arises from the change in the (pressure-broadened) width of the absorption lines under the action of the electric field in the reference cell (Stark cell). When the absorption lines are strong (partially saturated) this leads to a change in the optical loss in the cell. The water-vapour content of the laboratory air was monitored in a 35 cm long measurement cell, in line with the reference cell. In order to check the signal change due to the H 2 0 absorption in this path, it was alternately filled with water vapour at a partial pressure of 12 m b a r and with dry nitrogen. The resulting change in detected signal has so far been very weak, but discernible and reproducible, and represents the first detection of water vapour by this method (see Fig. 5(b)). It should be noted that our gas-sensing result using this novel arrangement is a preliminary one and steps are being taken to improve our signal-to-noise ratio for quantitative detection of water vapour. One attraction of the Stark method is that it is compatible with the use of long-term averaging to improve the signal-to-noise ratio. We shall now describe the second area of progress, that of our new light-source arrangement.
OPTICAL RECEIVER
I HIGH-VOLTAGE DRIVERCCT.
SYSTEM OUTPUT
89
HIGH-VOLTAGE D.C. BIAS
Fig. 4. Functional block diagram of electronic system for driving a Stark cell and detecting the modulation signal from the transmitted light.
3, The novel multi-line source using a Michelson interferometer
Our new light source relies on the condition of destructive interference that it is possible to establish in a suitably positioned Michelson interferometer (see Fig. 6). This condition occurs when the interferometer is mechanically biased to give a path-length difference of 2/2 between the two arms. Then, provided the reflected powers are equal, and provided the mirrors and beam splitters are suitably flat, the optical signals in the appropriate output port will cancel. The cancellation is effective over a fairly wide optical bandwidth, provided the Michelson interferometer is accurately set to the 2/2
90
J.P, Dakin et al. / Sensors and Actuators B 29 (1995) 87 93
b •blockI
beam Mocked
beamblocked
,dtrog~
t i ! t
,
(b)
Fig. 5. (a) Detected signal transmitted through the Stark cell after phase-sensitive detection with the arrangement of Fig. 4. The curve shows the signal change when the light beam is periodically blocked by a shutter. This modulation is only observable in the main H20 absorption bands at 1.4 and 1.9 ~tm. (b) Signal change due to H20 absorption in the measurement cell. The cell was alternately filled with air (containing 12 mbar aH20 vapour) and dry nitrogen. After each cycle, the beam from the tungsten halogen source was blocked. light in t h a t a r m will be selectively a t t e n u a t e d at a n u m b e r o f lines c o r r e s p o n d i n g to the g a s e o u s a b s o r p t i o n lines. L i g h t r e t u r n i n g f r o m the o t h e r (gas-free)
p a t h - l e n g t h - d i f f e r e n c e c o n d i t i o n f o r the c e n t r e w a v e l e n g t h o f t h e b a n d . I f a gas o f t h e t y p e to be d e t e c t e d is n o w i n t r o d u c e d i n t o o n e a r m o f the i n t e r f e r o m e t e r , the ¢¢'''''"
,f I,
Jil ._w_.
MICHELSON
¢ro COMPENSATE FOR GAS CELL
INTERFEROMETER
WINDOWS)
I i.H.:.:.:-:Ii
GAS CELL, CONTAINING IOO%METHANE
MIRROR
MIRROR
Ir-I
~:i:i:i:!:i:! ili!]ii!i!ii!! Ii!iiiiiililil ~iiii!:i:!:iiI
r=ll
FIBRE OUTPUT
~:':'::::.
! ........... I ...............................
I ............
PORT
ii!i!i!iii iiii;iii;iiiiiiiiiiiiiiiii iiiiiiiiiiiiiiiiNjiiiiiii ;iiiiii
I--I
M
LENS
LENS
LENS
SIG L T OH UTRC UE N
G
S
T
E
N
~
I INPUT PORT
Fig. 6. Test of the novel light-source arrangement. The output of the source is connected to a spectrum analyser via an optical-fibre lead.
J.P. Dakin et al. / Sensors and Actuators B 29 (1995) 87 93
arm, at these particular wavelengths, is then no longer effectively cancelled, as there is insufficient energy returning from the gas-filled arm to interfere with it in a totally destructive manner. As a result, the energy from the output port will consist of a series of discrete spectral lines, having significant power only in the wavelength regions where the gaseous absorption is significant. Our new source is highly attractive for gas sensing, as it is certain to be well matched to the required gaseous absorption lines of an external measurement region, provided the correct mechanical positioning is maintained in the interferometer. The contrast of a gas sensor can be greatly improved using such a source, as it contains negligible energy at wavelengths where there is no gaseous absorption and has maximum energy at the absorption peaks. Secondly, because, unlike a conventional broadband source, there is a no 'wasted' optical energy in the spectral regions between the absorption lines, problems due to excess photon noise in the optical receiver are minimized. Thirdly, unlike a single discrete laser line, the multi-line source is less likely to suffer from undesirable coherence effects. Such problems can occur with laser sources whenever there is specularly reflected light from the windows of a gasmeasurement cell, or when there is intermodal interference in a multimode optical-fibre cable.
4. Theory of the Michelson source
The Michelson interferometer (Fig. 1) has an output power, POUT, given by {'2~r AL~q POUT = P0 1 + k c o s ~ - ~ - ) J where P0 is a constant, k is the fringe contrast, AL is the total effective path difference between interfering beams and 2 is the optical wavelength. If the Michelson interferometer exhibits perfect cancellation at the nulls (i.e., k = 1), then POUT -----Po/1 +
AL~7
cosk-- . )j
and there is a null when AL = 2/2 _+ n2. Under the condition A L = 2/2 (i.e., when n = 0), cancellation at a null is effective over a relatively broad bandwidth. Let us illustrate this with a numerical example. If the interferometer remains fixed, but the wavelength of the input light changes from the 'null' condition by 3%, there will be a power output at this wavelength equivalent to only 0.0044% of the peak output, 2Po, occurring under conditions of constructive interference. Alternatively, if, at a particular wavelength, the light in one arm is totally attenuated due to gaseous absorp-
91
tion, all of the light returning from the other arm at that wavelength (except for the inevitable loss in the beam combiner) will contribute to the output. There are two additional theoretical factors to consider in the analysis of our Michelson interferometer when gas is present in one arm. Finally, the finite refractive index of the gas, compared to normal air, causes a small phase imbalance in the system, requiring a change in the length of this arm in order to set it to 2/2 total path difference. Secondly, it is necessary to consider the effect of anomalous dispersion, i.e., the more dramatic change in refractive index with wavelength that occurs in the region close to an absorption line. It should be noted, of course, that anomalous dispersion could either be unimportant, a disadvantage, or even an advantage depending on its magnitude. Clearly, if it only occurs to a significant degree when the absorption is close to 100%, its effects will not be significant, as any phase change in the weak transmitted signal will not affect the operation of our source. However, if the total (two-way) phase shift due to anomalous dispersion were to be a substantial fraction of 180 ° (i.e., a substantial fraction of the desired total path difference of 2/2 in our interferometer), then this phase shift could be utilized, instead of the gas absorption, to give a line-spectrum output at selected wavelengths. In order to calculate the effects of anomalous dispersion, we shall examine the behaviour of plane-wave propagation in an absorptive medium. The electric field E of a propagating plane wave is given by E = E0 exp i ( k x - ~ot) where x is distance, o ) = a n g u l a r frequency and t = time. The wavenumber, k, represents the number of complete 2~r phase changes that occurs per unit length of propagation and is given by [9] ic~
5 where fl is the real component of the wavenumber (this represents the phase-change coefficient in a lossless medium) and ~/2 is the imaginary component. The quantity ~ is the attenuation coefficient, usually expressed in c m - i . (The factor of two arises because ~ is the p o w e r attenuation coefficient, whereas the equations above represent electric field). The modulus of k is given by [f12 "t- (0~2/4)]1/2 and the perturbation of the phase change in the gas-containing arm due to absorption then becomes significant in our interferometer when the quantity 2 L { [ f 1 2 + ( o c 2 / 4 ) ] 1/2 - f l } becomes a significant fraction of rc (i.e., the additional phase change due to absorption approaches 180°). The anomalous dispersion therefore only becomes significant under conditions of very high absorp-
92
J.P. Dakin et a/. / Sensors and Actuators B 29 (1995) 87 93 SPECTRUn 16O
(a)
[]
-Be -9O 1625,0 ISWP 5ne/]VS
1650.8ni 1675.0 SdO/IRES .SnIIRUR SiS]
SPECTRUH
HORH
(b)
1.2
.........
;......
L
l'el~ ~J 8.6
e.$
e.4
I
!
02
6. Conclusions
1625.0 ISWP 5nm/JVS SPECTRUM -6el
]
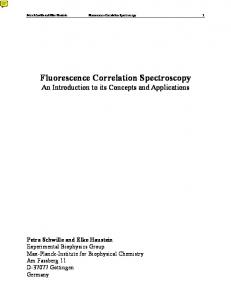
verification of our new source. With the interferometer set to give maximum fringe contrast (i.e., close to equal path condition), the length of one arm was adjusted to minimize the signal from the output port (i.e., set up to the condition of destructive interference). Under these conditions, a series of discrete spectral lines was clearly visible on the display of the Ando spectrometer unit (see Fig. 7(a)). When the path length was adjusted for constructive interference at the output port, then a broadband light output was obtained, with dips in intensity where the methane gas has absorbed energy (see Fig. 7(b)). It is clear from our simple demonstration that the proposed method works in practice. We propose to build an improved version with a more rugged construction for use as a source for gas sensing. This should enable us to use a broadband source for gas sensing, yet achieve high-contrast measurement.
0.2
5JSJ
165g.gno 16~;5. g IRES ,2na[RUR
(c)
F. . . . . . . . . . . . . . . . . . . . . . . . . . . . . . . . . . . . . . . . . . . . . . . . . . . .
-0e
We have reported the first measurements of watervapour concentration using Stark modulation of a reference cell and have described a novel light source for gas-sensing applications. Both these developments represent useful progress in our gas-sensing programme. We hope to report gas measurements using our novel source at a later date.
Acknowledgements
1625.05na/J
ISUP
VS
1650.On,
5de/iRES .5nsIRUR
1675. SJSl
Fig. 7. Output of Michelson interferometer with path lengths set to minimize power from output port: (a) log scale; (b) linear scale. It can be seen that the output is maximum at a number of wavelengths corresponding to methane absorption lines, with a low-level background signal between these lines. (c) Output (log scale) of Michelson interferometer with path length set for maximum signal from output port. It can be seen that the output has 'dips' corresponding to methane absorption lines.
tion. Under such conditions, the light in the gascontaining arm will be effectively absorbed so its phase will be irrelevant.
5. Results with the Michelson source
The source was tested using the arrangement shown in Fig. 3. The Michelson arrangement was set up using an Ealing Optics Universal Interferometer unit, fitted with 2/4 mirrors and 2/10 beamsplitter. Clearly, components of better quality are desirable for best fringe contrast, but this was useful for the first experimental
The authors would like to thank Shell Research for supporting our initial feasibility studies on the Stark cell for water-vapour detection and also Dr Paul Morkel for his valuable discussions and ideas on the Michelson source.
References [1] P.C. Hills, P.J. Samson and I. Webster, Explosion hazards of optical fibres in combustible environments, Proc. 7th Optical Fibre Sensors Conj., Sydney, Australia, 1990, p. 63. [2] N.P. Ludlam, Safety of optical systems in flammable atmospheres, Report R/IOO8/OO/A, Optical Sensors Collaborative Association, UK, 1989. [3] A. Hordvik, A. Berg and D. Thingbo, A fibre optic gas detection system, Proc. 9th Eur. Conf. Optical Communications, Geneva, Switzerland, 1983, p. 317. [4] T. Kobayasi, M. Hirana and H. Inaba, Remote monitoring of NO 2 molecules by differential absorption using optical fibre link, Appl. Opt., 20 (1981) 3279. [5] R. Goody, Cross-correlating spectrometer, J. Opt. Soc. Am., 58 (1968) 900. [6] F.W. Taylor, J.T. Houghton, G.D. Peskett, C.D. Rogers and E.J. Williamson, Radiometer for remote sounding of the upper atmosphere, Appl. Opt., 11 (1972) 135.
J.P. Dakin et al. / Sensors and Actuators B 29 (1995) 87 93
[7] H.O. Edwards and J.P. Dakin, A novel optical fibre gas sensor employing pressure-modulation spectrometry, Proc. 7th Optical Fibre Sensors ConJi, Sydney, Australia, 1990, p. 55. [8] J.P. Dakin and H.O. Edwards, Gas sensors using correlation spectroscopy, compatible with fibre optic operation, Sensors and Actuators B, 11 (1993) 9 19. [9] J.D. Jackson, Classical Electrodynamics, Wiley, New York, 2nd edn., 1975.
Biographies John P. Dakin is a principal research fellow at Southampton University, supervising research and development in optical instrumentation, having particular interests in optical-fiber sensors and other optical measurement instruments. He was formerly a student for his B.Sc. and Ph.D. degrees at Southampton University and remained there as a research fellow until 1973. He has since spent two years in Germany at A E G Telefunken, 12 years at Plessey U K and two years with York Limited/York Biodynamics before returning to the University. He is the author of over 100 technical and scientific papers, and over 120 patent applications, and has edited or co-edited four books on optical-fiber sensors. He was previously a visiting professor at Strathclyde University (UK) and was the technical programme committee chairman of the OFS '89 Conference in Paris. He is frequently an invited speaker and chair at major international conferences.
93
Dr Dakin has won a number of awards, including 'Inventor of the Year' for Plessey Electronic Systems Limited, the Electronics Divisional Board Premium of the IEE and open scholarships to both Southampton and Manchester Universities. He has also been responsible for a number of key electro-optic developments. These include the sphere-lens optical-fibre connector, the first W D M optical shaft encoder, the Raman optical-fibre distributed temperature sensor and the first demonstration of a fibre-optic passive hydrophone array sensor.
Henry Owen Edwards received a B.Eng. in electronic engineering in 1986 from the University of Liverpool. Subsequently, he was engaged in research into opticalfibre sensors at the university of Southampton, and was awarded a Ph.D. in 1991. He is currently employed by North West Water and is involved in the development of optical sensors for the water industry. Bernhard H. Weigl was born in 1966 in Steyr, Austria. He received his M.Sc. in chemistry in 1990, and his Ph.D. on optochemical sensor modules for CO2 in 1993, both at KF-University Graz, Austria (Professor O.S. Wolfbeis). During his Ph.D., he was working on the design of various optrodes at Joanneum Research, Graz, Austria. He is presently with the Optoelectronic Research Center, University of Southampton, working on UV-spectroscopic sensors for seawater.