algorithm removes the unexpected fluctuation effect of existing stroke-based .... way for illustration. Suppose we ... effect of existing stroke-based graph-cut methods, and thus provides ..... C C. = â is the 2. L -norm of the. RGB color difference of two pixels i and j. |. | i j. x x. â ..... Adobe Photoshop User Guide, 2002. [7] Boykov ...
Progressive Cut *
Chao Wang 1, Qiong Yang2, Mo Chen3, Xiaoou Tang2, and Zhongfu Ye1 2 3 1 Microsoft Research Asia, Tsinghua University, University of Science and Technology of China, Hefei, Beijing, 100080, P.R.China Beijing, 100084, Anhui, 230027, P.R.China {qyang,xitang}@microsoft.com P.R.China ABSTRACT Recently, interactive image cutout technique becomes prevalent for image segmentation problem due to its easy-to-use nature. However, most existing stroke-based interactive object cutout system did not consider the user intention inherent in the user interaction process. Strokes in sequential steps are treated as a collection rather than a process, and only the color information of the additional stroke is used to update the color model in the graph cut framework. Accordingly, unexpected fluctuation effect may occur during the process of interactive object cutout. In fact, each step of user interaction reflects the user’s evaluation of previous result and his/her intention. By analyzing the user’s intention behind the interaction, we propose a progressive cut algorithm, which explicitly models the user’s intention into a graph cut framework for the object cutout task. Three aspects of user intention are utilized: 1) the color of the stroke indicates the kind of change s/he expects, 2) the location of the stroke indicates the region of interest, 3) the relative position between the stroke and the previous result indicates the segmentation error. By incorporating such information into the cutout system, the new algorithm removes the unexpected fluctuation effect of existing stroke-based graph-cut methods, and thus provides the user a more controllable result with fewer strokes and faster visual feedback. Experiments and user study show the strength of progressive cut in accuracy, speed, controllability, and user experience.
Categories and Subject Descriptors I.4.6 [Image Processing and Computer Vision]: Segmentation— Pixel classification; partitioning I.3.6 [Computer Graphics]: Methodology and Techniques—Interactive techniques; I.4.9 [Applications]; I.5.5 [Implementation]: Interactive systems
General Terms Algorithms, Human Factors.
Keywords Interactive image segmentation, user attention, graph cuts, foreground extraction. *This work was finished when the author was an intern at Microsoft Research Asia under the supervision of Dr. Qiong Yang. Permission to make digital or hard copies of all or part of this work for personal or classroom use is granted without fee provided that copies are not made or distributed for profit or commercial advantage and that copies bear this notice and the full citation on the first page. To copy otherwise, or republish, to post on servers or to redistribute to lists, requires prior specific permission and/or a fee. MM’06, October 23-27, 2006, Santa Barbara, California, USA. Copyright 2006 ACM 1-59593-447-2/06/0010…$5.00.
1. INTRODUCTION Object cutout is a technique for cutting out an object in the image from its background. Currently, no image analysis technique can be applied fully automatically with guaranteed results over a broad class of image sources, content and complexity. So semiautomatic segmentation techniques that introduce user interaction are becoming more and more popular. Currently, there are two types of interactive object cutout methods: boundary-driven methods and seed-driven methods. The boundary-driven methods often use interactions like brush or lasso. Such a tool drives the user’s attention to the boundary of the object. It generally allows the user to trace the object’s boundary with the lasso or specify the trimap with the brush. Examples include intelligent scissor [5], image snapping [13], Jetstream [14], Bayes matting [9][11], and Knockout2 [10]. It was shown in [3] that many user interactions were necessary for highly textured (or un-textured) regions to obtain a satisfactory result by using a lasso, and a considerable degree of user interaction is required to get a high quality mattes by using brushes. Such boundary-driven method requires much attention from the user, especially when the boundary is complex and long-curved, therefore it is not fit for the task at the very beginning. The seeddriven methods require the user to give some example points, strokes, or regions as the seed, and use them to help label the remaining pixels automatically. MagicWand starts with a userspecified point or region to compute a region of connected pixels such that all the selected pixels fall within some adjustable tolerance of the color statistics of the specified region [6]. GraphCut [1] and LazySnapping [2] use graph cut for segmentation by only labeling some representative strokes in foreground or background. GrabCut [3] allows the user to give a rectangle, which contains the foreground, and then employs graph cut in an iterative way. GrowCut [8] employs a neighbor attacking process after the user gives some strokes for representative colors. IntelligentPaint [12] is a region-based interactive segmentation tool, which applies a connect-and-collect strategy to define an object region. Among them, the stroke-based graph-cut method (such as GraphCut and LazySnapping) provides much freedom in the user interaction. It allows giving strokes within the object area, which is easier for the user when handling objects with complicated object boundary. Additionally, it is a global optimization technique, and it provides a fast, instant visual feedback with few strokes, which generally requires less user interactions compared with MaggicWand, Intelligent Scissors, Bayes Matte, and Knockout2. However, a general problem of the stroke-based graph-cut methods is that for a general image, only two strokes are not sufficient to achieve a good result where large erroneous areas
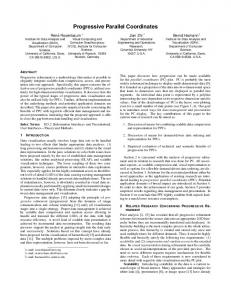
exist, see Fig.1(a)~(b). Thus additional refinements using more strokes are needed. With additional strokes, the user iteratively refines the result until s/he is satisfied. Most existing works, such as GraphCut and LazySnapping, only use the color information of the additional stroke in each update of the graph cut model, and the whole image is re-segmented based on the updated graph cut model. This is quite simple. However it may bring unexpected label change of the foreground or background, which will cause unsatisfactory “fluctuation” effect during the process of user experience. For example, Fig.2(a) is the segmentation result with the initial two strokes. When a new background stroke is added behind the neck of the man, the region behind his trousers is turned into Foreground (see the red circle in Fig.2(b)). Such a change is unexpected. For Fig.2(c), the additional stroke in the up-right corner shrinks the dog’s back, see Fig.2(d). This is also an unexpected effect to the common user. Both cases cause unpleasant results in the user experience. Furthermore, it will cause confusion on the user side about why this effect occurs and what stroke s/he should select. More examples can be seen in Fig.11.
(a) (b) Figure 1. Only two strokes are not sufficient to achieve a good result where large erroneous areas exist. Yellow stroke marks foreground, and blue stroke marks background. Such effects originate from the inappropriate update strategy, which treats the additional stroke and the previous strokes as a collection to update the color model, rather than a process. This can be illustrated in Fig.2(e)~(f). Since the graph cut method models the object cutout task as a binary labeling problem and they solve the problem by minimizing the energy function, which encodes both color and contrast information, we choose a simple way for illustration. Suppose we only consider the color distribution for foreground/background segmentation, and ignore the contrast between neighboring pixels. The graph cut method can be deemed as the pixel-by-pixel decision based on the color distribution. The pixels are classified to be Foreground (F) or background (B) when its probability is higher than the other one. As an example, the initial color distributions of foreground (red line) and background (blue line) are shown in Fig.2(e), and an extra background stroke is added with the new color model of background is shown in Fig.2(f). The background shrinkage occurs when the original blue line draws away from the red line, which is the case in Fig.2(b); and the background expansion occurs when a new peak of blue line rises up near the foreground model, which is the case in Fig.2(d). When this expansion or shrinkage is out of user’s expectation, it will cause the unpleasant result in the user experience. User experience is of great significance in many interactive tools including the interactive object cutout and pasting. It also plays an important role in the commercial products from a broad range.
Therefore, how to enhance the user experience in the process of interactive object cutout is worthy of intensive study.
(a)
(b)
(c)
(d)
(e) (f) Figure 2. The additional stroke may cause unexpected changes in the labeling results if only updating color models. (a) and (c) are the segmentation results of ‘man’ (a) and ‘pity dog’ (c) with the initial two strokes, respectively; (b) and (d) are their corresponding segmentation results after the additional stroke is given. Yellow stroke marks foreground, and blue stroke marks background. The green arrow points at the additional stroke. The over-shrinkage and over-expansion of the background are respectively visible in (b) and (d) as the red circles show; (e) is the color model with initial two strokes; (f) is the new color model updated after the additional stroke is given. This paper addresses this issue from studying the user’s intention behind the additional stroke that the user specified. The key ideas originate from two observations. First, in each step, the user’s intention is hinted by the user interaction such as the additional stroke, and it can be extracted by studying the characteristics of the user interaction. Second, we observe that the additional stroke indicates the user’s intention from at least three aspects as shown in Fig3: 1) the additional stroke falls in the erroneous areas indicating that the user inclines to change the results in such areas; 2) the color (in fact, label) of the stroke indicates which kind of change s/he expects, yellow stoke (Foreground label) in the background indicating s/he would like to change part of the background into foreground and vice versa. For those regions already with the same label as the additional stroke (such as the green region in Fig.3b), the user does not expect them to change
the labels, at least at the current step; 3) the location of the stroke indicates region of interest for the user, with high interest around the stroke (such as the red region in Fig.3b), and low interest in other erroneous areas (such as the pink region in Fig.3b).
(b) “bride” (a) “Indian girl”
(a) (b) Figure 3. User’s intention hinted behind the user interaction. (a) Additional stroke when segmentation result of the initial two strokes is given, as the green arrow points at; (b) User’s intention behind the additional stroke, green for unchanging area, red for high interest area, and pink for low interest area. Based on these observations, we propose a progressive cut algorithm to incorporate the user intention into the process of interactive object cutout in order to enhance the user experience. A new graph cut model is proposed to exploit the user’s intention behind the additional stroke that user specified, which leads the segmentation result altered along the user’s expectation. The new algorithm reduces or even eliminates the unexpected fluctuation effect of existing stroke-based graph-cut methods, and thus provides the user a more controllable result with fewer strokes and faster visual feedback.
2. PROGRESSIVE CUT Before we propose the new algorithm for progressive cut, we first study the user interactions, from which we conclude several nontrivial observations on user intention behind the interaction. Then we model the user intention into the graph-cut framework.
2.1 User interaction study We asked 7 users to attend our user interaction study. All the subjects have no prior knowledge of interactive object cutout systems. Four images with previous segmentation results, “pity dog”, “bride”, “boy”, and “Indian girl”, were used as the test images. The subjects were asked to add an additional stroke on the original image based on the segmentation result indicated by the red line in Fig.4. Before the test started, they were allowed to try out using strokes for object cutout for five minutes. The test was conducted independently among the users. The spatial distributions of their additional strokes are displayed in Fig.4, where the silhouette indicates the ground truth of the cutout result (black for background and white for foreground), and the additional strokes from 7 users are displayed in green (background) or yellow (foreground). The brighter color (such as bright green) represents higher density.
(c) “pity dog”
(d) “boy”
Figure 4. Spatial distributions of the additional strokes added by the subjects in the user interaction study. The silhouette indicates the ground truth, and the red line indicates the given segmentation result. Yellow stroke marks foreground, and green marks background. From the figure, we can see that there are some variations in the interactions from various users. For example, in Fig.4(b) where erroneous areas exist on both foreground and background, some users add a foreground (yellow) stroke, and some add a background (green) stroke. Besides that, in Fig.4(d), even when all the users add a foreground stroke, they may mark it at different positions, some on the arm, and some on the foot. Additionally, different kinds of stokes were given by different users: some are within the previous segmentation region, while others across the previous segmentation boundary at one side or both sides, which will be described by Fig.6 in the next section. However, we can still observe some common points: 1) There is a user evaluation process going on before the user gives the additional stroke, i.e. the user evaluates the previous segmentation result before s/he gives the additional stroke. Note that the additional strokes are not uniformly spatially distributed on the whole image, but mostly concentrated in those erroneous areas, which is resulted by user evaluation. This suggests that the user intention is hinted behind the additional stroke, and we should add a user intention analysis module in the process of progressive cut. Here, we propose a system flow as shown in Fig.5(a) for progressive cut, and this leads the result to approach the user’s expectation step by step. 2) The user intention is embodied in three aspects: a) The user’s attention concentrates on the erroneous areas, which indicates that the user inclines to change the results in the erroneous areas as expected. Among the 28 strokes that we collected, all are centered in the erroneous areas, although different kinds of user interactions are
given by different users. This implies that the user detects the error areas, and s/he tends to correct these areas, treating them in a way rather different from other areas.
Fig.6(b), and N = {B, F , B} in Fig.6(c), there are U = Ω H ,
b) The color of the stroke indicates which kind of change s/he expects.
In fact, it is easy to find out that no matter what N is, there is always U = Ω H , R = N ( L) ∩ Ω H , T = {H → H : R} .
For instance, in the image “bride”, the yellow stroke indicates that s/he would like to change part of the current background into foreground, while the green stroke indicates the opposite intention. This implies that the user sets different attention for foreground error and background error. For those regions with the same label as the additional stroke, s/he does not expect them to change labels at the current step. c) The location of the stroke indicates the region of interest. As an example, the stroke on the left arm of “boy” indicates the current user pays more attention to this area than other erroneous areas (such as in the left leg), while the stroke on the left leg indicates the attention of another user. This says that s/he sets higher priority for changing the region around the stroke s/he specified, than the other erroneous areas.
2.2 User Intention Model With these observations, we build the user intention model as follows. Denote F as the Foreground and B as the Background ( F = B ). The foreground area in the previous segmentation result P is denoted as Ω F and the background area denoted as Ω B . The label of the additional stroke is denoted as
H ( H ∈ {F , B} ). Its location is denoted as L , and the label sequence of the pixels on the additional stroke is denoted as N = {ni } , where ni ∈ {F , B} (e.g. there is N = {B, F , B} when N starts from a region in the background, runs across the foreground and ends in the background). The intention of the user is denoted as I, and it contains three parts: U is the unchanging region where the user does not expect to change the segmentation label; R is the region of interest; and T is the kind of change that the user expects (e.g. T = {F → B : R} indicates that the user expects the region of interest to have high priority for turning from foreground into background). The user intention model can be described as Fig.5(b) shows. New stroke
Previous result
User intention
P
U L H
Intention analysis
I
T R
(a) (b) Figure 5. Systematic framework for progressive cut. (a)system flow; (b) user intention analysis module. Case 1:
When H = B , and N = {F } , there is U = Ω B ,
R = N ( L ) ∩ Ω F , T = {F → B : R} , neighborhood of L .
Case 2:
where
N ( L ) is
the
When H = F , and N = {B} , there is U = Ω F and
R = N ( L ) ∩ Ω B , T = {B → F : R} .
Other Cases: In case that the stroke runs across both the background and foreground, such as N = {F , B} or N = {B, F } in
R = N ( L) ∩ Ω H , T = {H → H : R} where H ∈ {F , B} .
(a) (b) (c) Figure 6. Three kinds of strokes. The blue marks the background in the previous segmentation result, the yellow marks the foreground, and the purple marks the additional stroke with H as its label where H ∈ {F , B} .
2.3 Graph Cut Framework In the following, we will model the segmentation problem in a graph cut framework, and incorporate the user intention into the graph cut model. Suppose that the image is a graph G = {V , E } , where V is the set of all nodes and E is the set of all arcs connecting adjacent nodes. Usually, the nodes are pixels on the image and the arcs are adjacency relationships with four or eight connections between neighboring pixels. The labeling problem (or foreground/background segmentation or object cutout) is to assign a unique label xi for each node i ∈V , i.e. xi ∈ {foreground (=1), background (=0)}. The labeling problem can be described as the optimization problem which minimizes the energy defined as follows by min-cut/max-flow algorithm [7]: E ( X ) = λ ∑ E1 ( xi ) + (1 − λ ) i∈V
∑
E2 ( xi , x j )
( i , j )∈E
(1)
, where E1 ( xi ) is the data energy, encoding the cost when the label of node i is xi , and E2 ( xi , x j ) is the smoothness energy, denoting the cost when the labels of adjacent nodes i and j are xi and x j respectively. We now consider how to model our progressive cut in the above energy minimization framework. From the user interaction study and user intention analysis in Sec.2.1 and Sec.2.2, we can get I = {U , R , T } with the new stroke {H , L} and the previous segmentation result P. From U, we can erode the graph on the whole image G = {V , E } into a smaller graph G ' = {V ', E '} for faster computation. From U, R, and T, we can define the energy function as E ( X ) = α ∑ Ecolor ( xi ) + β ∑ Euser ( xi ) i∈V '
+ (1 − α − β )
i∈V '
∑
Econtrast ( xi , x j )
(2)
( i , j )∈E '
, where Ecolor ( xi ) is the color term energy, encoding the cost in color likelihood, Euser ( xi ) is the user intention term, encoding the cost in deviating from the user’s expectation I={U,T,R}, Econtrast ( xi , x j ) is the contrast term or smoothness term, which constrains the neighboring pixels with low contrast to select the same labels.
2.3.1 Eroded graph for progressive cut
2.3.3 Contrast term
Denote the segmentation result as P = { pi } , where pi is the current label of pixel i , with the value 0/1 corresponding to Background/Foreground, respectively. Further denote the locations of the additional stroke specified by the user as a set of nodes L = {i1 , i2 ,�it } ⊂ V , H , U , T and R are the same as in
The contrast term Econtrast ( xi , x j ) defined as a function of the color
Sec2.2. Suppose H = F as shown in Fig.7(a), we can get U = Ω F , R = N ( L ) ∩ Ω B , T = {B → F : R} , according to the user intention analysis in Sec.2.1 and Sec.2.2. In this case, we first ' ' ' construct a new graph G = {V , E } by eroding U (except the pixels neighboring to the boundary) out of the graph on the whole image G = {V , E } , as shown in Fig.7(b). Such erosion itself fits in with the user’s intention, since nodes being eroded all lie in the unchanging region U . The energies and the corresponding energy optimization in the following sections are defined on the eroded graph G ' .
contrast between two nodes i and j : Econtrast ( xi , x j ) =| xi − x j | ⋅g (Cij )
(5) 2 1 where g (ξ ) = , and Cij = Ci − C j is the L2 -norm of the ξ +1 RGB color difference of two pixels i and j. | xi − x j | allows to
capture the contrast information only along the segmentation border. Actually Econtrast is a penalty term when adjacent nodes are assigned with opposite labels. The more similar in color the two nodes are, the larger Econtrast is, and thus the less likely they are assigned with opposite labels.
2.3.4 User intention term The user intention term Euser is a nontrivial term, which is presented in this paper to encode the cost in deviating from the user’s expectation. Since U = Ω H , that is, the unchanging region contains all the pixels with the same label as the additional stroke, we set its corresponding user intention term as: Euser ( xi = H ) = +∞ , ∀i ∈ Ω H ∩ V ' Euser ( xi = H ) = 0
(a) graph G (b) eroded graph G ' Figure 7. Construction of the eroded graph. (a) is the original graph on the whole image, G . (b) is the eroded graph, G ' .
Since R = N ( L) ∩ Ω H and T = {H → H : R} , this means, for the pixels with label opposite to that of the additional stroke, the user’s attention is concentrated in the neighborhood of the stroke, and it decreases as the distance to the stroke becomes larger. Therefore we set the user intention term as:
2.3.2 Color term The color term Ecolor ( xi ) in Eq.(2) is defined as follows. Assume the foreground stroke nodes is denoted as VF = {iF 1 ,�iFM } ∈V and the background stroke nodes denoted as VB = {iB1 ,�iBM } ∈V . The color distribution of foreground can be described as a GMM model, i.e. K
pF (Ci ) = ∑ ωk pFk ( µ Fk , Σ Fk , Ci )
(3)
k =1
, where pFk is the k -th Gaussian component with the mean and covariance matrix as {µ Fk , Σ Fk } , and ωk is the weight. The background color distribution pB(Ci) can be described in a similar way. For a given node i with color Ci , the color term is defined as: If i ∈VF ∩ V ' , there is E ( xi = 1) = 0, E ( xi = 0) = +∞ ; If i ∈VB ∩ V ' , there is E ( xi = 1) = +∞, E ( xi = 0) = 0 ; Otherwise, E ( xi = 1) = E ( xi = 0) =
log ( pF (Ci ) ) log ( pF (Ci ) ) + log ( pB (Ci ) )
,
log ( pB (Ci ) ) log ( pF (Ci ) ) + log ( pB (Ci ) )
(4) .
(6)
where
i − ik
min i − ik 1≤ k ≤t
(7) , ∀i ∈ Ω H ∩ V ' r is the distance between the node i and ik ,
Euser ( xi ) =| xi − pi |
| xi − pi | is an indicator of label change, r is a parameter to control the range of user’s attention: larger r implies larger range. The implication of Eq.(7) is: there should be an extra cost to change the label of a pixel, and the cost is higher when the pixel is farther from the additional stroke. An example of the energy of the user attention energy is shown in Fig.8(a) and Fig.8(c).
2.3.5 Discussion For clear discussion, we first introduce two terms, over-expansion and over-shrinkage, as follows. Assume that the user expects the label of the pixels in the area A to change into H . If there is another area D outside of A , where the pixels change their labels into H when their correct label is H , we call this effect as the over-expansion of H; If there is another area E outside of A where pixels change their labels into H when their correct label is H , we call this effect as the over-shrinkage of H . For example, as shown in Fig.2(b), the user adds a blue stroke (background) behind the neck of the man, indicating s/he would like to expand the background in such area. However, the pixels behind his trousers changed their labels from Background to Foreground, i.e., over-shrinkage of the background occurs after the additional stroke is given. Similarly, in Fig.2(d), there is an over-expansion of the background in the dog’s back (as the red circle points out). From above, we can see that over-expansion and over-shrinkage
are two kinds of erroneous label changes out of user’s expectation, so both of them will cause unsatisfactory result.
(a)
current attention range is likely to be large, and thus a large r is set. Therefore, we dilate the additional stroke with an increasing radius until the dilated stroke covers 5% of the total length of the border. r is set to be the radius when the stroke stops dilation, as shown in Fig.9. Such a parameter r measures the user’s current attention range, and it makes our algorithm adaptive to different images, different stages in the interaction, and different users.
(b) Figure 9. Setting the parameter r
(b)
(c) (d) Figure 8. The user attention energy in progressive cut and their corresponding results. (a) and (c) are the user attention energy in “man” and “pity dog”. Higher intensity indicates larger energy. (b) and (d) are the segmentation results of progressive cut, with the additional stroke pointed by green arrow. Compared with the existing stroke-based graph-cut methods, our algorithm can effectively prevent the over-shrinkage and compress the over-expansion in the low-interest areas, as Fig.8(b) and (d) show. The prevention of the over-shrinkage (Fig.8(b) vs. Fig.2(b)) is carried out by eroding U out of the graph on the whole image (see Fig.7) and setting the infinity penalty as Eq.(6), which guarantees that there is no label change in the areas whose label is the same as the additional stroke. The compression of overexpansion (Fig.8d vs. Fig.2d) is carried out by adding the user intention term as Eq.(7) in the energy function, which assigns larger penalty to those areas farther away from the user’s high attention area. In this way, the new algorithm will change the result according to the user’s expectation, and thereby provides the user a more controllable result with no fluctuation effect and fewer strokes. Another notable strength of the new algorithm is that it provides a faster visual feedback. Since the eroded graph is generally much smaller than the graph on the whole image, the computational cost in the optimization process is greatly reduced, as demonstrated by Table 1 in Sec.4.2.
2.4 Parameter Setting In this section, we give details on how to set parameter r , which is used to control the range of user’s attention. An automatic scheme for setting r is employed to endow our algorithm with adaptability. The key idea can be intuitively explained as follows. Given the previous segmentation border and an additional stroke specified by the user, if the stroke is near to the border, it is probable that s/he cares for a small region around the stroke, and thus a small parameter r should be selected. Otherwise, her/his
(a)
(d)
(c)
(e)
(f)
(g) (h) Figure 10. The tools of polygon and brush. (a) is the source image “Indian girl” with the segmentation result using strokes. The red rectangles show the region for adjustment by polygon editing and brush; (b) and (c) are the region before and after polygon adjustment; (d)(e)(f) are the regions before, during and after the brush implementation; (g) is the final object cutout result; and (h) is the composition result using the cutout result (g).
3. SYSTEM Considering the object cutout problem from the system side, the strokes are generally used to remove the errors in large areas quickly in a few steps with a few simple strokes. After the erroneous area reduces to a considerably low level, we use another two tools, polygon adjustment tool and brush tool, for the local refinement. Such tools are employed in a similar way as in [2], which is shown in Fig.10.
Furthermore, for the sake of computational speed, we conduct a two-layer graph-cut similar to [2]. We first conduct an oversegmentation by watershed and build the graph based on the segments for a coarse object cutout, and then a pixel-level graphcut is implemented on the near-boundary area in the coarse result for a finer object cutout.
4. EXPERIMENTS The experiments are designed to compare the new algorithm with existing stroke-based graph-cut methods from three aspects: 1) the segmentation accuracy in one single step with the same initial segmentation result and the same additional stroke; 2) the speed in one single step under the same condition as in 1); 3) the controllability of the results in the process of interactive object cutout using only strokes.
4.1 Accuracy First we show a group of experiments presenting the segmentation accuracy of our progressive cut in one single step, comparing with GraphCut/LazySnapping [2], with the same initial segmentation result and the same additional stroke. Two examples have been presented in the previous sections, as shown in Fig.2 and Fig.8. Here we give more results in Fig.11. For the image “little girl”, over-shrinkage occurs in GraphCut/ LazySnapping after an additional stroke labeling the left foot as foreground was given, see Fig.11(c). This is because that they only use the color information in the additional stroke to update the result. Since the initial strokes cover the hair in a small region, thus the weight for the color of the (blond) hair in the new foreground color model will be decreased, and the color of (blond) hair is more likely to be classified as Background, than using the initial color model. As a result, over-shrinkage of foreground occurs, which is an unexpected effect in the result. Compared with GraphCut/LazySnapping, we not only use the updated color model, but also analyze the user’s intention when s/he gives the additional stroke on the left foot. Such a stroke implies that s/he would like to change part of the current background to foreground, and accordingly we set the current foreground as unchanging ( U = Ω F ). Thereby we successfully prevent the over-shrinkage in the foreground as shown in (d). Our algorithm is also effective in reducing over-expansion, which can be shown in the images “bride”, “Indian girl”, and “sleepy dog” in Fig.11. It is easy to observe that in the results of GraphCut/LazySnapping, large areas of unexpected overexpansion occur after the additional strokes (on the hair in “Indian girl” and “bride”, on the mouth in “sleepy dog”) are given, as the red rectangles in Fig11(c) mark out. As has been analyzed in Sec.1 and Fig.2, the additional stroke makes the foreground model move nearer to the background model, and this leads that these areas are more likely classified into foreground and overexpansion occurs when using the existing stroke-based graph cut methods. Such cases do not happen in our results (Fig.11(d)), since we have analyzed the user’s attention and set the regions far away from the user attention area with less probability to change, by Eq.(7).
4.2 Speed In Sec2.3.5, we have mentioned that the our algorithm will save much time than the existing graph cut methods [1,2], due to the eroded graph. To demonstrate this strength, we compare the time
cost of our algorithm with that of existing graph cut method in Table 1, using “Indian girl”, “man”, “pity dog”, “sleepy dog”, “bride”, and “little girl” as the test images. The running time is tested on a PC of P4-3.0G, 1G RAM, under the OS of Windows XP. For simplicity, we only list out the time cost in energy minimization under the same condition as Sec.4.1. From the table, we can see that the time cost is greatly reduced, which enables our system to give a faster visual feedback to the user. Table 1. Comparison of graph cut and progressive cut in speed
Indian girl
our cost (sec.) 0.167
0.462
initial foreground size (pixels) 122,629
435*639
22
man
0.107
0.843
35,120
635*640
15
Pity dog
0.135
0.187
208,393
640*609
23
Sleepy dog
0.149
0.645
127,877
640*446
9
Bride
0.163
0.794
100,551
470*640
8
Little girl
0.123
0.281
56,067
480*640
23
Image
graph cut cost (sec.)
r
image size (pixels)
(pixels)
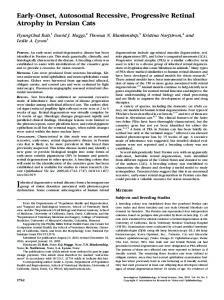
4.3 Controllability To study the controllability of the results in the process of interactive object cutout using only strokes, we select two complex images, which need a considerable number of strokes if we only use stroke tool, since the progress could be better presented in more steps. The original image and the initial segmentation results are shown in Fig.12(a), together with the initial two strokes. To compare our algorithm with existing strokebased graph cut methods, all the initial conditions are set to be the same, including the third stroke. After that, we ask 2 users who have no prior knowledge of our system before to complete the object cutout task by using only strokes. We record each step of the user interactions and the results as shown in Fig.12: the newly input stroke is marked in yellow for foreground, and blue for background; the result after the newly input stroke is presented by silhouettes in the same image, black for foreground and white for background. The “ground truth” result of each image, shown as the red line, is also given in Fig.12. From the newly input stokes from the users, we find out again that the user concentrated on the erroneous regions, as has been concluded in our user interaction study. From the results, we can see that in the process of using GraphCut/LazySnapping for “lady” and “Agassi”, the region under the lady’s hat and the region behind Agassi are cases of over-expansion. The same case also appears in Step 5 of “lady”. Since we have involved the user’s attention into our progressive cut framework, such unexpected changes are effectively compressed. Hence we need two less steps for both the two images to get an almost same result, where fewer interactions are required. We also evaluate the process by the error rate in each step, which is the ratio of erroneous area to the whole image area, as shown in Fig.13. The fluctuation is obvious in the performance curve of GraphCut/LazySnapping, while there is no fluctuation in our progressive cut algorithm. This is why we call our algorithm progressive cut.
experience in process of interactive object cutout, which is reported by user study.
(a) “lady” (b) “Agassi” Figure 13. Error rate of each step in the process of object cutout.
5. USER STUDY To study if the prevention of over-expansion/over-shrinkage, the elimination of fluctuation, and the fewer strokes really lead to a better user experience, we conduct the user study in this section. Table 2. Questions and answer statistics for user study. (a). two questions; (b) answer statistics for Q2. (a)Questions (b)Answer Statistics Q1: Which system do you prefer? A. Graph Cut B. Progressive Cut C. No obvious preference Q2: Why do you prefer that? A. More accurate in one single step B. No fluctuation in the whole process C. Fewer strokes are required D. Other reasons
We invite 11 users for test, among whom 5 have engineering background while the other 6 have no background in engineering. We first show them the results, including the single step result in Fig.11, and the whole process result in Fig.12. Then we ask 2 questions as shown in Table2(a). Among them, Q1 is a singlechoice question and Q2 is a multiple-choice one. The answer statistics for Q2 are shown in Table2(b). All the 11 users tell us that they prefer our progressive cut system to GraphCut/LazySnapping. Furthermore, 8 out of 11 users think that the proposed method can achieve a more accurate result due to the reduction of over-expansion and over-shrinkage; 5/11 say that the elimination of fluctuation in the process are attractive; 7 of them report that to obtain a comparable result, our method requires less interactions. In addition, 3 users give other reasons. Among them, one user mentioned that the results of the proposed method are faithful to the user’s intention, one user thought progressive cut is more robust to various kinds of images, and the other reported that using our system, he can easily know how to give a stroke which will lead to the result he expected.
6. CONCLUSION In this paper, we presented a progressive cut algorithm for background/foreground segmentation of image. We first analyze the user intention behind the additional stroke that the user specified, and then incorporate the user intention into the graphcut framework: an eroded graph is derived to prevent the overshrinkage, and a user attention term is added to the energy function to compress the over-expansion in the area of low interest. Experiments show that the new algorithm outperforms the existing stroke-based graph cut methods in both accuracy and speed, and it effectively removes the fluctuation effect in the interaction process which makes the results more controllable with requiring fewer strokes for the same task. With these attractive properties, the system provides the user a more pleasant
A future interesting topic would be the study on new interactions for interactive object cut, rather than the existing interactions such as using strokes in GraphCut/LazySnapping. Another related topic might be a more thorough study on the user intention model. Although we have made some initial studies on this direction in our paper and revealed one significant model for user intention analysis, these kinds of study will help the system to provide more alternatives for the user.
7. REFERENCES [1] Boykov, Y., and Jolly, M.P., Interactive Graph Cuts for Optimal Boundary & Region Segmentation of Objects in ND Images, ICCV’01, vol. I:105-112, 2001 [2] Li, Y., Sun, J., Tang, C.–K., and Shum, H.–Y., Lazy Snapping, SIGGRAPH’04 [3] Rother, C., Kolmogorov, V., and Blake, A., “Grabcut”— interactive foreground extraction using iterated graph cuts, SIGGRAPH’04. [4] Talbot, J.F., and Xu, X., Implementing Grabcut, http://students.cs.byu.edu/~jtalbot/research/Grabcut.pdf [5] Moretensen, E., and Barrett, W., Intelligent scissor for image composition, SIGGRAPH’95 [6] Adobe System Incorp. Adobe Photoshop User Guide, 2002 [7] Boykov, Y., and Kolmogorov, V., An Experimental Comparison of Min-Cut/Max-Flow Algorithms for Energy Minimization in Vision, PAMI, 26(9):1124-1137, 2004. [8] Vezhnevets, V., and Konouchine, V., “GrowCut”— interactive multi-label N-D image segmentation by cellular automata, Graphicon’2005. [9] Chuang, Y.-Y., Curless, B., Salesin, D., and Szeliski, R., A Bayesian approach to digital matting. CVPR’01, 2001. [10] Corel Corporation. Knockout user guide. 2002 [11] Ruzon, M., and Tomasi, C., Alpha estimation in natural images. CVPR’00, 2000 [12] Reese, L., Intelligent Paint: Region-Based Interactive Image Segmentation. Masters Thesis, Brigham Young University, Provo, UT, 1999 [13] Cleicher, M. Image snapping. SIGGRAPH’95 [14] Perez, P., Blake, A., and Gangnet, M. Jetstream: Probabilistic contour extraction with particles. ICCV 2001.
(a) source image
(b) initial result
(c) graph cut [2]
(d) progressive cut
Figure 11. Comparison of Progressive Cut with Graph Cut on the accuracy in one single step. Different image sources are shown in different rows. From top to bottom, they are “Indian girl”, “bride”, “sleepy dog” and “little girl”. (a) are the source images. (b) are the initial segmentation results, along with the initial two strokes are marked, yellow for foreground, and blue for background (c) are the graph cut results after an additional stroke (directed by green arrow) is given. (d) are progressive cut results, with the same additional stroke.
(a) The source images and the initial segmentation results with the initial two strokes. From left to right, the first two are the source image and initial result of “lady”, and the last two are those of “Agassi”.
(b) Step 3-7 in the process of using graph cut for interactive object cutout on “lady”
(c) Step 3-5 in the process of using progressive cut for interactive object cutout on “lady”.
(d) Step 3-9 in the process of using graph cut for interactive object cutout on “Agassi”.
(e) Step 3-7 in the process of using progressive cut for interactive object cutout on “Agassi” Figure12. Comparison of progressive cut with graph cut on the process of interactive object cutout. The newly input stroke is marked in yellow for foreground, and blue for background; the result after the new input stroke is presented by silhouettes in the same image, black for foreground, and white for background. The ground truth is shown by red line.