through funds provided by the Iowa Department of Transportation ...... To enforce clear zone policy personnel, of each of the six INDOT highway districts in ...
Clear Zone – A Synthesis of Practice and an Evaluation of the Benefits of Meeting the 10 ft Clear Zone Goal on Urban Streets
Final Report November 2008 Sponsored by Iowa Highway Research Board (IHRB Project TR-560) Iowa Department of Transportation, Office of Traffic and Safety (CTRE Project 06-261) University Transportation Centers Program, U.S. Department of Transportation (MTC Project 2006-05)
Iowa State University’s Center for Transportation Research and Education is the umbrella organization for the following centers and programs: Bridge Engineering Center • Center for Weather Impacts on Mobility and Safety • Construction Management & Technology • Iowa Local Technical Assistance Program • Iowa Traffic Safety Data Service • Midwest Transportation Consortium • National Concrete Pavement Technology Center • Partnership for Geotechnical Advancement • Roadway Infrastructure Management and Operations Systems • Statewide Urban Design and Specifications • Traffic Safety and Operations
About the MTC The mission of the University Transportation Centers (UTC) program is to advance U.S. technology and expertise in the many disciplines comprising transportation through the mechanisms of education, research, and technology transfer at university-based centers of excellence. The Midwest Transportation Consortium (MTC) is a Tier 1 University Transportation Center that includes Iowa State University, the University of Iowa, and the University of Northern Iowa. Iowa State University, through its Center for Transportation Research and Education (CTRE), is the MTC’s lead institution.
Disclaimer Notice The contents of this report reflect the views of the authors, who are responsible for the facts and the accuracy of the information presented herein. The opinions, findings and conclusions expressed in this publication are those of the authors and not necessarily those of the sponsors. The sponsors assume no liability for the contents or use of the information contained in this document. This report does not constitute a standard, specification, or regulation. The sponsors do not endorse products or manufacturers. Trademarks or manufacturers’ names appear in this report only because they are considered essential to the objective of the document.
Non-discrimination Statement Iowa State University does not discriminate on the basis of race, color, age, religion, national origin, sexual orientation, gender identity, sex, marital status, disability, or status as a U.S. veteran. Inquiries can be directed to the Director of Equal Opportunity and Diversity, (515) 294-7612.
Technical Report Documentation Page 1. Report No. IHRB Project TR-560 MTC Project 2006-05 CTRE Project 06-261
2. Government Accession No.
3. Recipient’s Catalog No.
4. Title and Subtitle Clear Zone – A Synthesis of Practice and an Evaluation of the Benefits of Meeting the 10 ft Clear Zone Goal on Urban Streets
5. Report Date November 2008
7. Author(s) Thomas H. Maze, Christian Sax, Neal Hawkins
8. Performing Organization Report No.
9. Performing Organization Name and Address Center for Transportation Research and Education Iowa State University 2711 South Loop Drive, Suite 4700 Ames, IA 50010-8664
10. Work Unit No. (TRAIS)
12. Sponsoring Organization Name and Address Iowa Highway Research Board Midwest Transportation Consortium 800 Lincoln Way 2901 South Loop Drive, Suite 3100 Ames, IA 50010 Ames, IA 50010-8634
6. Performing Organization Code
11. Contract or Grant No.
13. Type of Report and Period Covered Final Report 14. Sponsoring Agency Code
15. Supplementary Notes Visit www.ctre.iastate.edu for color PDF files of this and other research reports. 16. Abstract In urban communities, there are often limited amounts of right-of-way available for establishing a large setback distance from the curb for fixed objects. Urban communities must constantly weigh the cost of purchasing additional right-of-way for clear zones against the risk of fixed object crashes. From 2004 to 2006, this type of crash on curbed roads represented 15% of all fatal crashes and 3% of all crashes in the state of Iowa. Many states have kept the current minimum AASHTO recommendations as their minimum clear zone standards; however, other states have decided that these recommendations are insufficient and have increased the required minimum clear zone distance to better suit the judgment of local designers. This report presents research on the effects of the clear zone on urban curbed streets. The research was conducted in two phases. The first phase involved a synthesis of practice that included a literature review and a survey of practices in jurisdictions that have developmental and historical patterns similar to those of Iowa. The second phase involved investigating the benefits of a 10 ft clear zone, which included examining urban corridors in Iowa that meet or do not meet the 10 ft clear zone goal. The results of this study indicate that a consistent fixed object offset results in a reduction in the number of fixed object crashes, a 5 ft clear zone is most effective when the goal is to minimize the number of fixed object crashes, and a 3 ft clear zone is most effective when the goal is to minimize the cost of fixed object crashes.
17. Key Words clear zone—clear zone enforcement—fixed object setback—state of practice— urban clear zone
18. Distribution Statement No restrictions.
19. Security Classification (of this report) Unclassified.
21. No. of Pages
22. Price
156
NA
Form DOT F 1700.7 (8-72)
20. Security Classification (of this page) Unclassified.
Reproduction of completed page authorized
CLEAR ZONE – A SYNTHESIS OF PRACTICE AND AN EVALUATION OF THE BENEFITS OF MEETING THE 10 FT CLEAR ZONE GOAL ON URBAN STREETS Final Report November 2008 Principal Investigator Thomas H. Maze Professor of Civil, Construction, and Environmental Engineering Center for Transportation Research and Education, Iowa State University Co-Principal Investigator Neal Hawkins Associate Director of Traffic Operations Center for Transportation Research and Education, Iowa State University Research Assistant Christian Sax Sponsored by the Iowa Highway Research Board (IHRB Project TR-560) and the Midwest Transportation Consortium a U.S. DOT Tier 1 University Transportation Center (MTC Project 2006-05). Preparation of this report was financed in part through funds provided by the Iowa Department of Transportation through its research management agreement with the Center for Transportation Research and Education, CTRE Project 06-261. A report from Center for Transportation Research and Education Iowa State University 2711 South Loop Drive, Suite 4700 Ames, IA 50010-8664 Phone: 515-294-8103 Fax: 515-294-0467 www.ctre.iastate.edu
TABLE OF CONTENTS ACKNOWLEDGMENTS ..........................................................................................................XIII EXECUTIVE SUMMARY .........................................................................................................XV CHAPTER 1. INTRODUCTION ....................................................................................................1 CHAPTER 2. LITERATURE REVIEW .........................................................................................3 2.1. Introduction...................................................................................................................3 2.2. Description of Current Standards .................................................................................3 2.3. Controlling the Clear Zone Standards ..........................................................................6 2.4. The Relationship between Clear Zone Distance and Collisions...................................7 2.5. Relationship between Run-off-the-Road Crashes and Turning Movements ................8 2.6. Relationship between Landscape Improvements and Midblock Crashes.....................8 2.7. The Effect of a Consistent Clear Zone........................................................................10 CHAPTER 3. STATE SYNTHESIS .............................................................................................11 3.1. Introduction.................................................................................................................11 3.2. Summary of State Synthesis .......................................................................................11 CHAPTER 4. DATA COLLECTION ...........................................................................................12 4.1. Introduction.................................................................................................................12 4.2. Selection of Corridors .................................................................................................12 4.3. Physical Characteristics Collected..............................................................................15 4.4. Surveying Strategy......................................................................................................15 4.5. Data Compilation ........................................................................................................16 4.6. Data Sets .....................................................................................................................18 CHAPTER 5. ANALYSIS.............................................................................................................20 5.1. Introduction.................................................................................................................20 5.2. Minimum Setback.......................................................................................................21 5.3. Average Setback .........................................................................................................23 5.4. 15th Percentile Setback...............................................................................................25 5.5. Intersection Area of Influence ....................................................................................27 5.6. Violation of Area of Influence....................................................................................29 5.7. Speed Limit.................................................................................................................46 5.8. Fixed Object Density ..................................................................................................49 5.9. Cumulative Percent Crashes .......................................................................................51 5.10. Cumulative Percent Cost ..........................................................................................80 5.11. Economic Evaluation ..............................................................................................104 CHAPTER 6. CONCLUSIONS AND RECOMMENDATIONS ...............................................113 6.1. Summary of Findings................................................................................................113 6.2. Policy Implications ...................................................................................................114 6.3. Limitations and Future Research ..............................................................................114 APPENDIX A. SURVEY AND QUESTIONNAIRE ................................................................ A-1 v
APPENDIX B. STATE RESPONSES.........................................................................................B-1 B.1. California..................................................................................................................B-1 B.2. Colorado ...................................................................................................................B-2 B.3. Illinois ......................................................................................................................B-3 B.4. Indiana......................................................................................................................B-5 B.5. Iowa..........................................................................................................................B-6 B.6. Kansas ......................................................................................................................B-6 B.7. Kentucky ..................................................................................................................B-7 B.8. Michigan ..................................................................................................................B-8 B.9. Minnesota .................................................................................................................B-9 B.10. Missouri................................................................................................................B-11 B.11. Nebraska...............................................................................................................B-11 B.12. Nevada..................................................................................................................B-12 B.13. North Carolina......................................................................................................B-13 B.14. North Dakota ........................................................................................................B-14 B.15. Ohio......................................................................................................................B-15 B.16. Oregon..................................................................................................................B-16 B.17. South Dakota ........................................................................................................B-18 B.18. Texas ....................................................................................................................B-19 B.19. Washington State..................................................................................................B-20 B.20. Wisconsin .............................................................................................................B-22 REFERENCES
vi
LIST OF FIGURES Figure 2-1. Landscape improvements..............................................................................................9 Figure 4-1. Map of Des Moines corridors .....................................................................................13 Figure 4-2. Map of Waterloo corridors..........................................................................................14 Figure 4-3. University Avenue in Des Moines, Iowa ....................................................................14 Figure 4-4. East 4th Street in Waterloo, Iowa ...............................................................................15 Figure 4-3. HP handheld computer................................................................................................15 Figure 4-4. DISTO Classic 5 laser distance meter.........................................................................16 Figure 4-5. I-Blue wireless GPS receiver ......................................................................................16 Figure 4-6. Division of corridors into segments ............................................................................17 Figure 4-7. Division of corridors into blocks ................................................................................18 Figure 4-8. Division of corridor into 15 m sections ......................................................................18 Figure 5-1. Example roadway section ...........................................................................................20 Figure 5-2. Minimum setback in segment analysis .......................................................................21 Figure 5-3. Minimum setback in block analysis............................................................................22 Figure 5-4. Minimum setback in 15 m analysis.............................................................................23 Figure 5-5. Average setback in segment analysis..........................................................................24 Figure 5-6. Average setback in block analysis ..............................................................................24 Figure 5-7. Average setback in 15 m analysis ...............................................................................25 Figure 5-8. 15th percentile setback in segment analysis ...............................................................26 Figure 5-9. 15th percentile setback in block analysis....................................................................26 Figure 5-10. 15th percentile setback in 15 m analysis...................................................................27 Figure 5-11. Area of influence at intersections in 15 m analysis ..................................................28 Figure 5-12. Violation of 2 ft area of influence in segment analysis.............................................29 Figure 5-13. Violation of 3 ft area of influence in segment analysis.............................................30 Figure 5-14. Violation of 4 ft area of influence in segment analysis.............................................30 Figure 5-15. Violation of 5 ft area of influence in segment analysis.............................................31 Figure 5-16. Violation of 6 ft area of influence in segment analysis.............................................31 Figure 5-17. Violation of 7 ft area of influence in segment analysis.............................................32 Figure 5-18. Violation of 8 ft area of influence in segment analysis.............................................32 Figure 5-19. Violation of 9 ft area of influence in segment analysis.............................................33 Figure 5-20. Violation of 10 ft area of influence in segment analysis...........................................33 Figure 5-21. Violation of average offset area of influence in segment analysis ...........................34 Figure 5-22. Violation of the 2 ft area of influence in block analysis ...........................................34 Figure 5-23. Violation of the 3 ft area of influence in block analysis ...........................................35 Figure 5-24. Violation of the 4 ft area of influence in block analysis ...........................................35 Figure 5-25. Violation of the 5 ft area of influence in block analysis ...........................................36 Figure 5-26. Violation of the 6 ft area of influence in block analysis ...........................................36 Figure 5-27. Violation of the 7 ft area of influence in block analysis ...........................................37 Figure 5-28. Violation of the 8 ft area of influence in block analysis ...........................................37 Figure 5-29. Violation of the 9 ft area of influence in block analysis ...........................................38 Figure 5-30. Violation of the 10 ft area of influence in block analysis .........................................38 Figure 5-31. Violation of the average offset area of influence in block analysis ..........................39 Figure 5-32. Violation of 2 ft area of influence in 15 m analysis..................................................40 Figure 5-33. Violation of 3 ft area of influence in 15 m analysis..................................................40 Figure 5-34. Violation of 4 ft area of influence in 15 m analysis..................................................41
vii
Figure 5-35. Violation of 5 ft area of influence in 15 m analysis..................................................42 Figure 5-36. Violation of 6 ft area of influence in 15 m analysis..................................................42 Figure 5-37. Violation of 7 ft area of influence in 15 m analysis..................................................43 Figure 5-38. Violation of 8 ft area of influence in 15 m analysis..................................................44 Figure 5-39. Violation of 9 ft area of influence in 15 m analysis..................................................44 Figure 5-40. Violation of 10 ft area of influence in 15 m analysis................................................45 Figure 5-41. Violation of average setback area of influence in 15 m analysis..............................46 Figure 5-42. Speed limit in segment analysis ................................................................................47 Figure 5-43. Speed limit in block analysis ....................................................................................48 Figure 5-44. Speed limit in 15 m analysis .....................................................................................48 Figure 5-45. Fixed object density in segment analysis..................................................................49 Figure 5-46. Fixed object density in segment analysis, with outlier removed ..............................50 Figure 5-47. Density in block analysis ..........................................................................................50 Figure 5-48. Density in 15 m analysis ...........................................................................................51 Figure 5-49. Cumulative percent minimum setback in segment analysis .....................................52 Figure 5-50. Cumulative percent average setback in segment analysis ........................................53 Figure 5-51. Cumulative percent 15th percentile setback in segment analysis .............................53 Figure 5-52. Cumulative percent minimum setback in segment analysis at 30 mph ....................54 Figure 5-53. Cumulative percent average setback in segment analysis at 30 mph .......................54 Figure 5-54. Cumulative percent 15th percentile setback in segment analysis at 30 mph ............55 Figure 5-55. Cumulative percent minimum setback in segment analysis at 35 mph ....................55 Figure 5-56. Cumulative percent average setback in segment analysis at 35 mph .......................56 Figure 5-57. Cumulative percent 15th percentile setback in segment analysis at 35 mph ............56 Figure 5-58. Cumulative percent minimum setback in segment analysis at 40 mph ....................57 Figure 5-59. Cumulative percent average setback in segment analysis at 40 mph .......................57 Figure 5-60. Cumulative percent 15th percentile setback in segment analysis at 40 mph ............58 Figure 5-61. Cumulative percent minimum setback in segment analysis at ADT 1,500–6,000 ...58 Figure 5-62. Cumulative percent average setback in segment analysis at ADT 1,500–6,000 ......59 Figure 5-63. Cumulative percent 15th percentile setback in segment analysis at ADT 1,500–6,000........................................................................................................................59 Figure 5-64. Cumulative percent minimum setback in segment analysis at ADT over 6,000 ......60 Figure 5-65. Cumulative percent average setback in segment analysis at ADT over 6,000 .........60 Figure 5-66. Cumulative percent 15th percentile setback in segment analysis at ADT over 6,000...................................................................................................................................61 Figure 5-67. Cumulative percent minimum setback in block analysis..........................................62 Figure 5-68. Cumulative percent average setback in block analysis.............................................62 Figure 5-69. Cumulative percent 15th percentile setback in block analysis .................................63 Figure 5-70. Cumulative percent minimum setback in block analysis at 30 mph.........................63 Figure 5-71. Cumulative percent average setback in block analysis at 30 mph............................64 Figure 5-72. Cumulative percent 15th percentile setback in block analysis at 30 mph ................64 Figure 5-73. Cumulative percent minimum setback in block analysis at 35 mph.........................65 Figure 5-74. Cumulative percent average setback in block analysis at 35 mph............................65 Figure 5-75. Cumulative percent 15th percentile setback in block analysis at 35 mph ................66 Figure 5-76. Cumulative percent minimum setback in block analysis at 40 mph.........................66 Figure 5-77. Cumulative percent average setback in block analysis at 40 mph............................67 Figure 5-78. Cumulative percent 15th percentile setback in block analysis at 40 mph ................67 Figure 5-79. Cumulative percent minimum setback in block analysis at ADT 1,500–6,000........68 Figure 5-80. Cumulative percent average setback in block analysis at ADT 1,500–6,000...........68 viii
Figure 5-81. Cumulative percent 15th percentile setback in block analysis at ADT 1,500– 6,000...................................................................................................................................69 Figure 5-82. Cumulative percent minimum setback in block analysis at ADT 6,000...................69 Figure 5-83. Cumulative percent average setback in block analysis at ADT 6,000......................70 Figure 5-84. Cumulative percent 15th percentile setback in block analysis at ADT 6,000 ..........70 Figure 5-85. Cumulative percent minimum setback in 15 m analysis...........................................71 Figure 5-86. Cumulative percent average setback in 15 m analysis..............................................72 Figure 5-87. Cumulative percent 15th percentile setback in 15 m analysis ..................................72 Figure 5-88. Cumulative percent minimum setback in 15 m analysis at 30 mph..........................73 Figure 5-89. Cumulative percent average setback in 15 m analysis at 30 mph.............................73 Figure 5-90. Cumulative percent 15th percentile setback in 15 m analysis at 30 mph .................74 Figure 5-91. Cumulative percent minimum setback in 15 m analysis at 35 mph..........................74 Figure 5-92. Cumulative percent average setback in 15 m analysis at 35 mph.............................75 Figure 5-93. Cumulative percent 15th percentile setback in 15 m analysis at 35 mph .................75 Figure 5-94. Cumulative percent minimum setback in 15 m analysis at 40 mph..........................76 Figure 5-95. Cumulative percent average setback in 15 m analysis at 40 mph.............................76 Figure 5-96. Cumulative percent 15th percentile setback in 15 m analysis at 40 mph .................77 Figure 5-97. Cumulative percent minimum setback in 15 m analysis at ADT of 1,500–6,000 ....77 Figure 5-98. Cumulative percent average setback in 15 m analysis at ADT of 1,500–6,000 .......78 Figure 5-99. Cumulative percent 15th percentile setback in 15 m analysis at ADT of 1,500–6,000........................................................................................................................78 Figure 5-100. Cumulative percent minimum setback in 15 m analysis at ADT of 6,000 .............79 Figure 5-101. Cumulative percent average setback in 15 m analysis at ADT of 6,000 ................79 Figure 5-102. Cumulative percent 15th percentile setback in 15 m analysis at ADT of 6,000.....80 Figure 5-103. Cumulative cost minimum setback in segment analysis.........................................81 Figure 5-104. Cumulative cost average setback in segment analysis............................................82 Figure 5-105. Cumulative cost 15th percentile setback in segment analysis ................................82 Figure 5-106. Cumulative cost minimum setback in segment analysis at 30 mph........................83 Figure 5-107. Cumulative cost average setback in segment analysis at 30 mph...........................83 Figure 5-108. Cumulative cost 15th percentile setback in segment analysis at 30 mph ...............84 Figure 5-109. Cumulative cost minimum setback in segment analysis at 35 mph........................84 Figure 5-110. Cumulative cost average setback in segment analysis at 35 mph...........................85 Figure 5-111. Cumulative cost 15th percentile setback in segment analysis at 35 mph ...............85 Figure 5-112. Cumulative cost minimum setback in segment analysis with a 1,500–6,000 ADT ...................................................................................................................................86 Figure 5-113. Cumulative cost average setback in segment analysis with a 1,500–6,000 ADT...86 Figure 5-114. Cumulative cost 15th percentile setback in segment analysis with a 1,500–6,000 ADT ...................................................................................................................................87 Figure 5-115. Cumulative cost minimum setback in segment analysis with over 6,000 ADT .....87 Figure 5-116. Cumulative cost average setback in segment analysis with over 6,000 ADT ........88 Figure 5-117. Cumulative cost 15th percentile setback in segment analysis with over 6,000 ADT ...................................................................................................................................88 Figure 5-118. Cumulative cost minimum setback in block analysis .............................................89 Figure 5-119. Cumulative cost average setback in block analysis ................................................89 Figure 5-120. Cumulative cost 15th percentile setback in block analysis.....................................90 Figure 5-121. Cumulative cost minimum setback in block analysis at 30 mph ............................90 Figure 5-122. Cumulative cost average setback in block analysis at 30 mph ...............................91 Figure 5-123. Cumulative cost 15th percentile setback in block analysis at 30 mph....................91 ix
Figure 5-124. Cumulative cost minimum setback in block analysis at 35 mph ............................92 Figure 5-125. Cumulative cost average setback in block analysis at 35 mph ...............................92 Figure 5-126. Cumulative cost 15th percentile setback in block analysis at 35 mph....................93 Figure 5-127. Cumulative cost minimum setback in block analysis with a 1,500–6,000 ADT ....93 Figure 5-128. Cumulative cost average setback in block analysis with a 1,500–6,000 ADT .......94 Figure 5-129. Cumulative cost 15th percentile setback in block analysis with a 1,500–6,000 ADT ...................................................................................................................................94 Figure 5-130. Cumulative cost minimum setback in block analysis with over 6,000 ADT..........95 Figure 5-131. Cumulative cost average setback in block analysis with over 6,000 ADT.............95 Figure 5-132. Cumulative cost 15th percentile setback in block analysis with over 6,000 ADT ...................................................................................................................................96 Figure 5-133. Cumulative cost minimum setback in 15 m analysis ..............................................97 Figure 5-134. Cumulative cost average setback in 15 m analysis .................................................97 Figure 5-135. Cumulative cost 15th percentile setback in 15 m analysis......................................98 Figure 5-136. Cumulative cost minimum setback in 15 m analysis at 30 mph .............................98 Figure 5-137. Cumulative cost average setback in 15 m analysis at 30 mph ................................99 Figure 5-138. Cumulative cost 15th percentile setback in 15 m analysis at 30 mph.....................99 Figure 5-139. Cumulative cost minimum setback in 15 m analysis at 35 mph ...........................100 Figure 5-140. Cumulative cost average setback in 15 m analysis at 35 mph ..............................100 Figure 5-141. Cumulative cost 15th percentile setback in 15 m analysis at 35 mph...................101 Figure 5-142. Cumulative cost minimum setback in 15 m analysis with a 1,500–6,000 ADT...101 Figure 5-143. Cumulative cost average setback in 15 m analysis with a 1,500–6,000 ADT......102 Figure 5-144. Cumulative cost 15th percentile setback in 15 m analysis with a 1,500–6,000 ADT .................................................................................................................................102 Figure 5-145. Cumulative cost minimum setback in 15 m analysis with over 6,000 ADT.........103 Figure 5-146. Cumulative cost average setback in 15 m analysis with over 6,000 ADT............103 Figure 5-147. Cumulative cost 15th percentile setback in 15 m analysis with over 6,000 ADT 104
x
LIST OF TABLES Table 1-1. Iowa crashes, average annual crashes from 2004 to 2006 .............................................2 Table 1-2. Iowa crashes, average annual crash exposure from 2004 to 2006 .................................2 Table 2-1. State minimum clear zone distances on curbed roads (ft)..............................................4 Table 4-1. List of Des Moines corridors........................................................................................12 Table 4-2. List of Waterloo corridors ............................................................................................13 Table 5-1. Results of intersection significance test .......................................................................28 Table 5-2. Results of violation of 2 ft area of influence significance test .....................................40 Table 5-3. Results of violation of 3 ft area of influence significance test .....................................41 Table 5-4. Results of violation of 4 ft area of influence significance test .....................................41 Table 5-5. Results of violation of 5 ft area of influence significance test .....................................42 Table 5-6. Results of violation of 6 ft area of influence significance test .....................................43 Table 5-7. Results of violation of 7 ft area of influence significance test .....................................43 Table 5-8. Results of violation of 8 ft area of influence significance test .....................................44 Table 5-9. Results of violation of 9 ft area of influence significance test .....................................45 Table 5-10. Results of violation of 10 ft area of influence significance test .................................45 Table 5-11. Results of violation of average setback area of influence significance test ...............46 Table 5-12. Incremental benefit in segment analysis ..................................................................105 Table 5-13. Incremental benefit in segment analysis at 30 mph .................................................105 Table 5-14. Incremental benefit in segment analysis at 35 mph .................................................106 Table 5-15. Incremental benefit in segment analysis at 40 mph .................................................106 Table 5-16. Incremental benefit in segment analysis at 1,500–6,000 ADT ................................106 Table 5-17. Incremental benefit in segment analysis at over 6,000 ADT ...................................107 Table 5-18. Incremental benefit in block analysis.......................................................................108 Table 5-19. Incremental benefit in block analysis at 30 mph......................................................108 Table 5-20. Incremental benefit in block analysis at 35 mph......................................................108 Table 5-21. Incremental benefit in block analysis at 40 mph......................................................109 Table 5-22. Incremental benefit in block analysis at 1,500–6,000 ADT.....................................109 Table 5-23. Incremental benefit in block analysis at over 6,000 ADT........................................109 Table 5-24. Incremental benefit in 15 m analysis........................................................................110 Table 5-25. Incremental benefit in 15 m analysis at 30 mph.......................................................111 Table 5-26. Incremental benefit in 15 m analysis at 35 mph.......................................................111 Table 5-27. Incremental benefit in 15 m analysis at 1,500–6,000 ADT......................................111 Table 5-28. Incremental benefit in 15 m analysis at over 6,000 ADT ........................................112 Table B-1. AASHTO specifications for non-curbed roads (ft) ...................................................B-3 Table B-2. Illinois clear zone distance (ft) ..................................................................................B-4 Table B-3. Iowa clear zone distances (ft) ....................................................................................B-6 Table B-4. Michigan clear zone distance (ft) ..............................................................................B-8 Table B-5. North Carolina 3R/rehabilitation minimum clear zone (ft) .....................................B-13 Table B-6. North Dakota clear zone distance (ft)......................................................................B-14 Table B-7. Ohio clear zone distance (ft)....................................................................................B-16 Table B-8. Oregon clear zone distance (ft)................................................................................B-17 Table B-9. South Dakota clear zone distance (ft)......................................................................B-19 Table B-10. Texas clear zone distance (ft) ................................................................................B-20 Table B-11. Washington clear zone distance (ft) ......................................................................B-21 Table B-12. Wisconsin clear zone distance (ft).........................................................................B-22
xi
ACKNOWLEDGMENTS The authors would like to thank the Iowa Highway Research Board; the Iowa Department of Transportation, Office of Traffic and Safety; the Midwest Transportation Consortium; and the Center for Transportation Research and Education at Iowa State University for sponsoring this research. The authors also thank Amelia Hayes, Zach Hans, Dr. Konstantina Gkritza, Eric Fitzsimmons, Xudong Chai, Joshua Hochstein, and Joshua Hinds and for their support and expertise throughout this project. Finally, special thanks are due to the project advisory committee for their recommendations and to the transportation agency employees who participated in the surveys and interviews necessary for this project. The project advisory committee included the following individuals: • • • • • • •
Tim Crouch, State Traffic Engineer, Iowa Department of Transportation Mike Ring, Traffic Engineer, City of Des Moines Donna Buchwald, Office of Local Systems, Iowa Department of Transportation Mohammad Elahi, Traffic Engineer, City of Waterloo Jerry Roche, Federal Highway Administration, Iowa Division Dave Little, Assistant District Engineer, Iowa Department of Transportation Deanna Maifield, Methods Engineer, Iowa Department of Transportation
xiii
EXECUTIVE SUMMARY In urban communities, there are often limited amounts of right-of-way available for establishing a large setback distance from the curb for fixed objects. Urban communities must constantly weigh the cost of purchasing additional right-of-way for clear zones against the risk of fixed object crashes. From 2004 to 2006, this type of crash on curbed roads represented 15% of all fatal crashes and 3% of all crashes in the state of Iowa. Many states have kept the current minimum AASHTO recommendations as their minimum clear zone standards; however, other states have decided that these recommendations are insufficient and have increased the required minimum clear zone distance to better suit the judgment of local designers. This report presents research on the effects of the clear zone on urban curbed streets. The research was conducted in two phases. The first phase involved a synthesis of practice that included a literature review and a survey of practices in jurisdictions that have developmental and historical patterns similar to those of Iowa. The second phase involved investigating the benefits of a 10 ft clear zone, which included examining urban corridors in Iowa that meet or do not meet the 10 ft clear zone goal. The results of this study indicate that a consistent fixed object offset results in a reduction in the number of fixed object crashes, a 5 ft clear zone is most effective when the goal is to minimize the number of fixed object crashes, and a 3 ft clear zone is most effective when the goal is to minimize the cost of fixed object crashes.
xv
CHAPTER 1. INTRODUCTION In urban communities, there are often limited amounts of right-of-way available to establish a clear run-out zone. On roadway projects, the clear zone recommended by the administering jurisdiction is sometimes not implemented because of the presence of established buildings, trees, or other fixed objects, any of which would be too difficult or costly to remove. These obstacles present hazards to drivers when the fixed objects are located too close to the roadway to allow drivers to recover when they run off the road. However, the obstacles also provide a protective barrier for pedestrians when a sidewalk is located behind the fixed objects. Moreover, a uniform horizontal distance from the edge line of the road to the fixed object allows drivers to establish an appropriate speed and to focus on the roadway edge, while non-uniform distances do not reinforce this behavior. However, in all cases, fixed object crashes are reduced when fixed objects are located further back from the roadway edge. Beginning in the 1960s, the American Association of State Highway and Transportation Officials (AASHTO) began creating clear zone standards. However, these standards codeveloped with state and local standards, resulting in inconsistent clear zone standards for the location of fixed objects on urban curbed roads. If the AASHTO guidance alone were to be used in defining the clear zone limits on an urban roadway reconstruction or improvement project, the design engineer would have to weigh the costs of clearing aboveground utilities, buildings, walls, and other fixed objects back from the roadway against the benefits of having additional space for an errant vehicle to recover (above 18 in.). Naturally, because every situation in unique, the design engineer and design reviewers must make trade-offs between the construction costs and the benefits of making a decision that has unique circumstances. For each situation, the costs of providing additional clear zone (removing fixed objects) can be estimated, but the associated safety benefits of clearing 10 ft back from the curb or some distance less than 10 ft are unclear. In some cases, providing wider clear zones may even be counter to traffic calming treatments or context-sensitive design concepts. Most design engineers understand that providing a clear zone of 10 ft or more away from the edge of the road is an acceptable practice in most urban situations. However, exceptions to the 10 ft goal might include traffic calming treatments and context-sensitive solutions. More design guidance is needed to understand when it is practical and cost-effective to provide less than 10 ft of clear zone. Furthermore, urban roadway design engineers and municipal engineers need some assurance that their design will be approved when they consider all engineering criteria. It is not practical, in all situations, for designers to provide 10 ft of clear zone distance in order for their project will be positively reviewed by the Iowa Department of Transportation (Iowa DOT). In some cases, engineers from local agencies have reported that the costs associated with creating a 10 ft clear zone has become a “project buster” for some safety improvement projects. According to computations based on the Iowa DOT crash database, fixed object collisions on urban curbed roads constitute approximately 3% of all crashes in Iowa. Crash severities for fixed object collisions are similar to those for crashes overall. However, fixed object collisions make
1
up 15% of fatal urban crashes, while only 6% of urban crashes are fixed object crashes. This suggests that there is a tendency for fixed object crashes to be more severe than other urban crash types. Table 1-1 compares the number of total crashes, urban crashes, and urban fixed object crashes in Iowa from 2004 to 2006. Table 1-1. Iowa crashes, average annual crashes from 2004 to 2006 Fatal
Major Minor Possible Property Total Injury Injury Damage Only Total Crashes 380 1,643 5,498 10,263 39,756 57,540 Urban Crashes* 66 584 2,649 6,429 22,797 32,525 Urban Fixed Object Crashes 10 51 186 357 1,240 1,844 % of all Crashes 3% 3% 3% 3% 3% 3% % of all Urban Crashes 15% 9% 7% 6% 5% 6% *Urban crashes are those crashes that take place on curbed roads.
The crash rate of urban fixed object collisions decreases as the average annual daily traffic (AADT) increases, as illustrated in Table 1-2. Table 1-2 also shows that the crash density increases due to higher traffic. Table 1-2. Iowa crashes, average annual crash exposure from 2004 to 2006 AADT
Total Segment Length 0-1000 6,404 1000-5000 1,888 5000-15000 826 15000-30000 190 Above 30000 12
Total Annual VMT 1,061,400,804 1,642,203,339 2,597,116,710 1,399,106,889 217,911,539
Fixed Object Crashes 687 576 506 212 36
Crash Rate 65 35 19 15 17
Crash Density 0.1 0.3 0.6 1.1 3.0
The present report seeks to increase the level of knowledge regarding the benefits and drawbacks associated with the urban roadway clear zone width goal of 10 ft. The research for this report was conducted in two phases. The first phase included a synthesis of practice through a literature review and a survey of practices in jurisdictions with development and historical patterns similar to those of Iowa. The second phase investigated the benefits of a 10 ft clear zone by examining urban corridors in Iowa that meet or do not meet the 10 ft clear zone goal.
2
CHAPTER 2. LITERATURE REVIEW 2.1. Introduction The 2004 AASHTO publication A Policy on Geometric Design of Highways and Streets, 5th Edition (i.e., “The Green Book”) defines a clear zone as “the unobstructed, relatively flat area provided beyond the edge of the traveled way for the recovery of errant vehicles. The clear zone includes any shoulders or auxiliary lanes” (AASHTO 2004). This definition does not provide a specific clear zone width, but only provides guidance on absolute recommended minimum clear zone dimensions. Therefore, jurisdictions have different interpretations of the distance it takes for an errant vehicle to recover. The concept of a roadside clear zone had emerged in a 1967 AASHTO report that was referred to as the “Yellow Book.” The report stated, “For adequate safety, it is desirable to provide an unencumbered recovery area up to 30 ft from the edge of the traveled way; studies have shown that 80 percent of the vehicles in run-off-road accidents did not travel beyond this limit” (AASHTO 1967). AASHTO further emphasized the clear zone in its 1977 Guide for Selecting, Locating, and Designing Traffic Barriers, or the barrier guide. The guide presents the results of a large amount of research and was the first publication to outline the specific criteria used to select the appropriate safety treatments within the clear zone (AASHTO 1977). The barrier guide was the first guide to provide tables, charts, formulas, and example calculations to roadway designers who were concerned about obstacles adjacent to the roadway. The guide was certain to acknowledge that its guidance should only be applied with the engineers’ judgment and was not an absolute answer to fixed objects adjacent to the roadway. The emphasis on safety increased when AASHTO published its first version of “The Green Book” in 1984. “The Green Book” dedicated several portions to the clear zone and identified lateral clearances for various obstacles. These clearances varied based on roadway type, speed, slope, and average daily traffic (ADT) (AASHTO 1984). The latest national guidance has been given by the AASHTO Roadside Design Guide, published in 2006. This guide continues with the variable width clear zone based on roadway type, speed, slope, and traffic patterns. The guide also provides an approximate distance to the center of a range of clear zone distances that can be used in a given design. This guide acknowledges that the provided distances are not exact and that engineering judgment should be used when determining the clear zone width (AASHTO 2006). 2.2. Description of Current Standards Many organizations have developed independent concepts and definitions of the clear zone and various standards for different types of obstacles in the clear zone. When new concepts of the
3
clear zone emerged and evolved, the guidance changed rapidly and interpretation of design guidance varied by jurisdiction, resulting in jurisdictions with conflicting standards. The 2006 AASHTO Roadside Design Guide breaks required clear zone distances into groups based on design speed, design ADT, and the slope of the fill or cut adjacent to the roadway. Fill and cut slopes adjacent to the roadway require different clear zones because gravity affects the distance a vehicle traverses after it leaves the roadway. The design speed determines how severe a crash could potentially be, and ADT is used to determine whether the roadway has enough traffic to warrant spending the funds to meet a higher standard of clear zone distance. A review of all four AASHTO publications, from 1967 to 2006, shows a number of inconsistencies in how clear zone is defined. There are four basic consistency questions raised that should be addressed. These include the precise technical definition of clear zone, whether the presence of curbs by definition precludes clear zone requirements, the publication of specific dimensional guidance for clear zones, and the relationship of the term clear to “horizontal clearance” (Neuman et al. 2004). Due to the lack of national uniform guidelines for clear zone requirements, many states have taken the initiative to reinforce and expand the guidance given by AASHTO (i.e., making stricter clear zone requirements). This has resulted in differing design standards in many states. Table 21 shows the distribution of 32 state standards that were reviewed for this research. Many of the states reviewed have kept the current minimum AASHTO recommendation of 1.5 ft (AASHTO 2006) as their minimum standard. However, other states decided that these recommendations were insufficient and have increased the required minimum clear zone distance to fit the judgment of local designers. Table 2-1. State minimum clear zone distances on curbed roads (ft) 1.5 ft (AASHTO) (13 states) • California Department of Transportation (Caltrans). Highway Design Manual. [page 300-322] • Colorado Department of Transportation. Design Guide 2005 [4.5, page 4-12] • Connecticut Department of Transportation. Highway Design Manual [page 5] • Florida Department of Transportation. Deign Manual [page 3-69] • Illinois Department of Transportation. Illinois DOT Bureau of Local Roads & Streets Manual – 2005 Edition [page 23] • Indiana Department of Transportation. The Indiana Design Manual [49-2.03(05)] • Minnesota Department of Transportation. Minnesota Road Design Manual. [4-6.05] • North Dakota Department of Transportation. A policy for Accommodation of Utilities on State Highway Right-of-Way. [page 7] • Ohio Department of Transportation. Location and Design Manual. [page 6-3] • City of Rapid City, SD. Design Standards. [page 4] • Tennessee Department of Transportation. Roadway Design Guidelines. [1-310.35] • Texas Department of Transportation. Roadway Design Manual. [page 2-54] • Utah Department of Transportation. Roadway Design Manual of Instruction. May 2007 [page 85]
4
Table 2-1. State minimum clear zone distances on curbed roads (ft) (continued) 1.5–5 ft (13 states) • Arkansas State Highway Commission. Utility Accommodation Policy. Arkansas State Highway and Transportation Department. [401.3] • City of Tampa. Technical Standards for Transportation [page 23] • Iowa Department of Transportation. Iowa DOT: Office of Design Manual [page 5] • City of Lexington, Kentucky Lexington: Street Tree Selection and Care. [page 2] • Kansas City Missouri. Supplement to Design Criteria, Section 5200 streets [page 6] • City of Springfield, MO. Design Standards for Public Improvements. • Nebraska Department of Roads. Roadway Design Manual. [page 1-4] • City of Lincoln, NE. Design Standards. [page 12] • City of Cincinnati, OH. Street Restoration Book. [II-C] • South Dakota Department of Transportation. Road Design Manual. [page 10-5] • City of Sioux Fall, SD. Engineering Design Standards. [Figure 4.1-6] • City of Nashville, TN. Downtown Streetscape Elements Design Guidelines. [page 52] • Wisconsin Department of Transportation. Facilities Development Manual [page 16] 5.0–10 ft (5 states) • Los Angeles Bureau of Engineering [E222.111] • Massachusetts Department of Transportation. Massachusetts DOT [Exhibit 5-19] • City of Ann Arbor Public Services Department Standard Specifications. 1992. [Drawing No. SD-GU-1] • Oregon Department of Transportation. Highway Design Manual. [Table 5-9] • Washington Department of Transportation. Design Manual. [Figure 700-1] 10 + ft (1 state) • Michigan Department of Transportation. Road Design Manual [9.03.01] Note: For more detailed information about the state clear zone standards see Appendix B.
Turner et al. (1989) attributes the variation of clear zone requirement to the reasons listed below and notes that these variations have caused some states to be slow to establish minimum guidelines: 1. Cost. Clear zone projects must compete for funding with other highway projects and functions. Thus, some agencies initially viewed the clear zone as a diversion of sorely needed funds that could be better used for construction or maintenance. 2. Development on several fronts. The clear zone premise is not contained in a single book or document. Many agencies, organizations, and committees simultaneously contributed to development of the concept, which has resulted in multiple guidelines. 3. Constant change in standards. During the approximately 40 years of experience with the clear zone, safety research has caused improvements in the understanding of fixed object crashes and in ways to minimize their effects. Legal issues have raised additional concerns and, consequently, the policies have been modified several times. 4. No detailed criteria. Even though many documents contain clear zone guidance, few contain specific numerical criteria. Instead of a table of dimensions for various situations, the documents require the user to have a full understanding of the clear zone concept, use 5
a series of references, perform a series of calculations, and exercise good judgment. This lack of detailed criteria discourages individuals from mastering and using the concept. 5. Existing facilities. One of the major points of resistance to clear zones has been that there are hundreds of thousands of miles of roadways containing existing objects that are not in compliance with clear zone criteria. State transportation agencies and utility owners have been slow to embrace a concept that would drain their funds to perform corrective work on existing facilities. Although many guidelines provide some distinctions between existing and new work, there is no universal principle that allows existing facilities to meet a lower standard than new ones. 6. Right-of-way already crowded. Some of the most difficult clear zone problems occur in urban or suburban areas where the roads are old and many utilities are already in place. The clear zone criteria do not seem to fit these sites because there is too little right-ofway and simply no location left for new utilities. 7. Liability. Clear zone law is emerging on a case-by-case basis. The opinions of the courts are sometimes confusing and contradictory, further complicating the issue and making it more difficult for transportation agencies and utility companies. The State of Iowa began using clear zone standards when the 1988 AASHTO Roadside Design Guide was published (AASHTO 1988). Designers used tables and figures as a general basis and then made adjustments to the suggested values based on experience and site conditions. The state’s current goal is to maintain a 3 ft minimum clear zone in urban areas. The optimum clear zone is 10 ft, with 6 ft being dedicated to a sidewalk and 6 ft for snow storage. 2.3. Controlling the Clear Zone Standards The Federal Highway Administration (FHWA) answered whether the clear zone is a controlling criterion in a document by Obenberger (2007) titled “Clear Zone and Horizontal Clearance Frequently Asked Questions.”. Obenberger stated that the controlling criteria of the National Highway System (NHS) design standards include 13 items or elements that require a formal design exception when the adopted minimum value is not met on a project. The list of controlling criteria was developed to ensure that deviations less than the adopted value for a critical element were adequately considered in the design of a project. When the original list was developed in 1985, “clear zone” was considered to be synonymous with “horizontal clearance.” Subsequently, in 1990, following adoption of AASHTO’s Roadside Design Guide, it was decided that clear zone width would no longer be considered as an element requiring a formal design exception. In the rulemaking to adopt the Roadside Design Guide, it was defined that a clear zone width should not be controlled by a fixed, nationally applicable value. The various numbers in the guide associated with “clear zone” are not considered to be exact distances but rather ranges of values within which judgment should be exercised to make design decisions. Fixed objects or terrain features that fall within the appropriate clear zone are typically shielded, so a design exception is not needed. The FHWA believes that a consistent design approach, guided by past crash history and an analysis of cost-effectiveness, is the most responsible method for determining the appropriate clear zone width for a roadway. While these are not controlling criteria for the purpose of applying “The Green Book” to the NHS, an exception to a clear zone for a project does need to
6
be noted, approved, and documented in the same manner as exceptions to other non-controlling criteria when the established value is not met. The FHWA recommends that documentation be included in project meetings notes or by other appropriate means. 2.4. The Relationship between Clear Zone Distance and Collisions A study conducted by Turner and Barnett (1989) investigated the effect of utility poles located in the urban clear zone. This study conducted field investigations at the site of 385 pole collisions. The collision data revealed that about 90% of the accidents occurred within 10 ft of the pavement edge. Within this range, the relationship between accident frequency and offset distance was linear (Turner and Barnett 1989). Although the study found a relationship between collisions and offset distance, it did not look into the effects of other objects along the side of the road, such as buildings, trees, or parked cars. While the recommendations from the study offer effective methods for the placement of poles and signs, those principles cannot be directly applied to other obstacles in the clear zone. While there is no single strategy to meet minimum lateral clearance distances, Turner and Barnett made recommendations about how the design engineer can effectively reduce the number of hazardous poles in the clear zone. These recommendations are as follows: • • • • • •
In general, utility poles are to be placed to the maximum extent practical at the outer limits of the right-of-way (or additional utility easement) Where insufficient right-of-way is available, an engineering analysis should determine whether purchase of additional easement is the best course of action. Distribution lines would be best placed in an underground conduit in new developments. Ancillary aboveground equipment should be constructed in compliance with lateral clearances for utilities. Where constructing underground distribution lines is impractical or cost-prohibitive (e.g., due to the cost of rock excavation), poles are to be located in the rear of the building lot wherever possible. This may call for the creation of a dedicated utility easement. Where overhead lines must be located along the front of the lot, it is desirable to place them at least 10 ft behind the curb. Where utility poles are to be installed along curved sections (including 200 ft of tangent section adjacent to each end on the outside of horizontal curves) or on roadways that have open drainage systems, consideration should be given to locating poles along the inside of the curve, unless the poles can be placed outside a non-traversable ditch section on the outside of the curve.
Although these guidelines can be followed and may result in a reduced number of crashes, Turner and Barnett did not identify the severity or the frequency of crashes that would be avoided, and hence did not identify the safety benefits of following their guidance. Thus, design engineers can exactly calculate the cost of removing utility poles from the edge of the roadway, but they have no measure of the benefits resulting from the relocation expenditure.
7
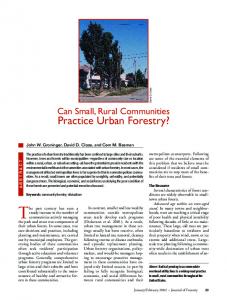
2.5. Relationship between Run-off-the-Road Crashes and Turning Movements Dumbaugh (2005) investigated the relationship between run-off-the-road crashes and turning movements. He noted that urban roadside crashes appear to be strongly associated with vehicle turning movements, an association not currently considered in roadside design practice. The current standards focus on the assumption that the farther an object is placed from the edge of the roadway, the greater the safety. There are no current standards that address the safety hazard posed by objects placed in the potential run-off-the-road areas at the intersection of a main arterial and a side road. Dumbaugh found that between 65% and 83% of all fixed objects involved in roadside crashes are located behind a driveway or intersection, not at random locations along the roadway. Dumbaugh suggests that the current approach assumes that the farther a roadside object is set from the traveled way, the lower the probability of a fixed object crash. However, the roadside object most likely to be involved in a roadside crash is often not that which is closest to the traveled way, but that which is located behind a driveway or intersection. The result of using forgiving design values is that drivers will travel at a speed that limits their ability to respond to the vehicle and pedestrian hazards that naturally occur in these environments. Dumbaugh claims that “Under design conditions where land access is a major function of a roadway, or where there are frequent driveways and intersections, lower-speed and less-forgiving designs can substantially enhance a roadway’s safety” (Dumbaugh 2005). 2.6. Relationship between Landscape Improvements and Midblock Crashes The findings from a pilot study conducted by Naderi (2003) indicate that a positive correlation exists between the landscape improvements along the roadside and a reduction in midblock accidents. These landscape improvements include raised concrete planters, shrubs, decorative lights, decorative paving, decorative noise barriers, sculptures, and trees, as shown in Figure 2-1. While nearly all of the tree planting and landscape improvements occurred within the clear zone, midblock accidents decreased from between 5% to 20%. The data generated from these case studies indicates that there may be a positive effect of having a well-defined edge, which may result in an overall decrease in run-off-the-road collisions with objects. The street tree may define the edge of the road space by providing a diverse visual edge that also is repetitively simple in color, texture, and form (Naderi et al. 2008). According to Berlyne (1971), optimum levels of complexity that maximize attentiveness fall within this mean: a visual landscape that is diverse but not overwhelmingly so, and a landscape that is simple but not boring. It should be noted that design standards that incorporate the safety benefit of street trees on drivers and other roadway users must be performance-based and tested (Naderi et al. 2008).
8
Figure 2-1. Landscape improvements Dumbaugh (2005) analyzed the relationship between run-off-the-road crash severity and urban clear zone usage. The results show a paradigm shifting relationship between clear zone distance and safety. According to the study, a smaller clear zone can actually increase safety on an urban roadway. Dumbaugh defines livable street treatments as wide sidewalks, lawn ornaments close to the edge of the roadway, a narrow clear zone, and trees between the sidewalk and the roadway. The author found that the places where these treatments were used experienced a reduced probability of roadside crashes and an increase in the roadway’s safety performance. Widening shoulders, increasing clear zones, and adding livable street treatments were also found to dramatically reduce midblock, multiple-vehicle, and pedestrian crashes and injuries. Neither a roadway’s fixed object offset nor the provision of a paved shoulder was found to meaningfully enhance a roadway’s safety performance in Dumbaugh’s 2005 study. Lynch (1960) had theorized that a distinct roadway edge contributes to the legibility of the city, engendering a feeling of familiarity and comfort. The resultant comfort and reduction in stress could have a positive effect on drivers (Lynch 1960). A survey done by Naderi et al. (2008) indicated that people perceived suburban streets with trees as the safest streets and urban streets without trees as the least safe streets. In terms of edge definition, suburban streets with trees were perceived as the streets with the most defined edges; urban streets with no trees were perceived as the streets with the least defined edges. For the suburban landscape, the presence of trees significantly dropped the cruising speed of drivers by an average of 3.02 mph. Faster drivers and slower drivers both drove more slowly with the presence of trees. Thus, Naderi et al. (2008) concluded that increases in drivers’ perception of 9
safety had a significant relationship to increases in drivers’ perception of the roadway edge. The addition of curbside trees significantly increased driver perception of spatial edge. Two issues emerge with regard to trees and the guidelines. First, transportation designers may fail to heed the flexibility implied and framed by the Green Book and implement recommendations (and local derivations) as “standards.” Transportation officials are encouraged to mitigate the effects of environmental impacts using “thoughtful design processes” because standards have been “less rigorously derived” for urban settings (AASHTO 2004). Second, most geometric design criteria apply to high-speed and rural roads, so their use in urban areas may be inappropriate. Engineers often take a conservative approach, where the engineer chooses to use a larger clear zone distance to increase safety rather than consider that using a smaller clear zone distance could achieve the same outcome (Wolf and Bratton 2006). 2.7. The Effect of a Consistent Clear Zone An increase in consistent clear zone requirements in an urban area could reduce the number of severe crashes. Evidence follows intuitive thinking that the consistency of the clear zone could be more important for safety then the minimum offset distance. For example, if most objects are 10 ft from the roadway but one tree is only 4 ft from the roadway, that one tree is going to be the cause of a severe accident. This idea can also be applied to corridors where the clear zone distance may change from “X” ft to “Y” ft. At the location of the change in clear zone distance, there is a higher likelihood that a severe accident will occur. The consistent application of clear zone guidance could address some of the factors that relate to causing a run-off-the-road crash. The following are some of the reasons a vehicle may leave the pavement and encroach on the roadside (Dumbaugh 2005): • • • • • • •
Driver fatigue or inattention Excessive speed Driving under the influence of drugs or alcohol Collision avoidance Roadway conditions such as ice, snow or rain Vehicle component failure Poor visibility
10
CHAPTER 3. STATE SYNTHESIS 3.1. Introduction To evaluate the administration of clear zones within various states, a survey was sent to 20 state agencies. The survey included six questions regarding federal aid projects and six questions regarding state aid projects. The survey is included in Appendix A. The individuals representing the state agencies were also asked to provide additional contacts at the local level who could be interviewed about design exception practices within the jurisdiction. A summary of each state’s response to the survey is included in Appendix B. 3.2. Summary of State Synthesis The 20 states surveyed and the personnel interviewed provided many different standards that they currently use. These standards ranged from a minimum clearance of 1 ft to 35 ft. These differing standards suggest that there is no universal standard that neither is nor should be applied to every urban community. The State of Iowa’s clear zone standards require a generous amount of setback in comparison to many of the states surveyed for this project. Many of the states surveyed had desirable setbacks requirement similar to Iowa’s minimum. Of those states that had a desirable setback requirement similar to Iowa’s minimum, many had a minimum requirement of only 1.5 ft from the face of curb.
11
CHAPTER 4. DATA COLLECTION 4.1. Introduction To conduct the evaluation of the significance of the clear zone, a project database was created. The project database included 11 corridors in the Des Moines metropolitan area and two corridors in the Waterloo/Cedar Falls area. At each of the corridor sites, the lateral offset distance to each fixed object in the right-of-way was measured from the face of the curb using a laser distance meter. The location of each object was also collected using a global positioning system (GPS) device. 4.2. Selection of Corridors Corridors in Des Moines were recommended by the City of Des Moines city engineer. The corridors in Waterloo were recommended by the City of Waterloo city engineer. The 11 corridors used for evaluation in the Des Moines area are listed in Table 4-1 and shown in Figures 4-1 and 4-3. The two corridors used for evaluation in the Waterloo area are listed in Table 4-2 and shown in Figures 4-2 and 4-4. Table 4-1. List of Des Moines corridors Road Name 2nd Avenue Army Post Road Beaver Avenue East University Avenue East University Avenue Euclid Avenue Hubbell Avenue Merle Hay Road NE 14th SW 9th Street University Avenue
Begin Aurora Avenue SW 14th Street Aurora Avenue East 30th Street East 6th Street Martin Luther King Jr Parkway East Tiffin Avenue Meredith Drive NE 44th Avenue SW 14th Street 63rd Street
12
End University Avenue SE 14th Street Urbandale Avenue Winegardner Road East 17th Court 6th Avenue East Euclid Avenue Hickman Road East University Avenue SE 14th Street 42nd Street
Figure 4-1. Map of Des Moines corridors Table 4-2. List of Waterloo corridors Road Name Williston Ave East 4th St
Begin
End Washington St Franklin St
Kimball Ave Newell St
13
Figure 4-2. Map of Waterloo corridors
Figure 4-3. University Avenue in Des Moines, Iowa
14
Figure 4-4. East 4th Street in Waterloo, Iowa 4.3. Physical Characteristics Collected It was determined that six physical characteristics would be recorded for each fixed object along each corridor. Those characteristics included location, fixed object type, setback distance from the face of the curb, roadway name, roadway speed limit, and side of roadway. 4.4. Surveying Strategy The six characteristics listed above were to be recorded into a Hewlett Packard (HP) handheld computer (Figure 4-3) running ESRI ArcMap software. The information was recorded by two researchers driving the corridor and stopping at each fixed object. When stopped, one researcher determined the latitude and longitude by using an I-Blue wireless GPS receiver (Figure 4-5), linked via Bluetooth to the HP handheld computer. The other researcher used a DISTO classic 5 laser distance meter (Figure 4-4) to measure the distance from the face of the curb to the face of the fixed object. The first researcher typed the characteristics associated with the fixed object into the HP handheld computer, and then the researchers drove to the next fixed object.
Figure 4-3. HP handheld computer
15
Figure 4-4. DISTO Classic 5 laser distance meter
Figure 4-5. I-Blue wireless GPS receiver 4.5. Data Compilation After the physical characteristics of each fixed object were collected, the characteristics were compiled into a geographic information system (GIS) program called ArcView GIS 3.3. The objects on each roadway were divided into three types of sections: segments, blocks, and 15 m sections. The corridors were divided in this fashion to evaluate the significance of the fixed object attributes based on three different measurements of the linear length of the roadway. 4.5.1. Fixed Object Crashes Fixed object crashes from the years 2001 to 2006 were extracted from the Iowa DOT’s crash database. The Iowa DOT’s geographic information management system (GIMS) contains a data set of centerlines for public roads, including interstates, U.S. and state highways, county roads, city streets, park roads, and institutional roads (Iowa DOT 2008a). The roads in this database have been digitized from the Iowa DOT’s GIMS database and updated through construction and maintenance updates and field inventories. Construction and maintenance updates are performed annually, and data for county roads is collected and inventoried using field inspections for all 99 Iowa counties performed within the previous year. Road data is inventoried and collected from field inspections for city streets, park roads, and institutional roads on a four-year cycle. 16
The crashes used in this study are from the crash database maintained by the Iowa DOT. The locations of the crashes used for this study are those that have been documented in the crash database to have occurred within 50 m of a curbed roadway. Each fixed object crash used in this research has been documented in the crash database as a crash in which the first harmful event is the collision with the fixed object and in which the collision is with a bridge/bridge rail/overpass, underpass/structure support, culvert, ditch/embankment, curb/island/raised median, guardrail, concrete barrier, tree, pole, sign post, mailbox, impact attenuator, or other fixed object. Segments were created for this study by analyzing the entire corridor and breaking it into lengths that were several blocks long and that shared similar characteristics, such as a residential area, commercial area, or industrial area. Even though some of these segments had a large variation in the given fixed object offset, it was important to be able to analyze relatively longer lengths of roadway to evaluate the significance of the fixed object setback. Each of the segments received a segment identification number to be used in the project database.
Figure 4-6. Division of corridors into segments Blocks were created by breaking the entire corridor into individual blocks. Blocks were considered to be an important distance to analyze because it was considered to be highly likely that the roadway characteristics would be consistent over the length of a block. Each of the blocks received a block identification number to be used in the project database.
17
Figure 4-7. Division of corridors into blocks The 15 m sections were created by segmenting the entire corridor into 15 m long sections, as measured by the centerline of the roadway. The 15 m sections are important because the fixed object setback is most likely to be the most consistent over a short distance, such as 15 m. Each of the 15 m sections received a section identification number to be used in the project database.
Figure 4-8. Division of corridor into 15 m sections 4.6. Data Sets The segment data set includes 43 segments. For each of the segments, the following information was recorded: • Setback distance (minimum setback, average setback, and 15th percentile setback) • Area of influence violations (for 2, 3, 4, 5, 6, 7, 8, 9, and 10 ft areas of influence and the average setback area of influence) • Speed limit • Length of segment
18
• • • • • •
Number of fixed objects Density of fixed objects ADT Number of fixed object crashes per year (from 2001 to 2006) Average crashes per year The severity of each crash per year (fatalities, major injuries, minor injuries, possible injuries, unknown injuries, and property damage amount) • The average severity of crashes per year The block data set includes 226 sections. The block spreadsheet includes the same columns as the segment spreadsheet, and the same information was recorded. The 15 m data set includes 2,140 sections. The 15 m spreadsheet includes the same columns as the segment and block spreadsheets, but with one exception. In the segment and block spreadsheets, the violation column includes a count of the number of times the area of influence is violated. In the 15 m spreadsheet, the violation column includes a “1” if there are any violations of the area of influence and a “0” if there are no violations of the area of influence.
19
CHAPTER 5. ANALYSIS 5.1. Introduction A descriptive analysis was completed to evaluate the significance of the clear zone distance. The predictors included minimum setback, average setback, 15th percentile setback (the offset distance that 85% of fixed objects are behind), intersection area of influence, violations to the area of influence, speed limit, and fixed object density. Three additional analyses were completed to measure the optimal clear zone distance: cumulative percent crashes, cumulative percent cost, and an economic analysis that evaluated the dollar benefit of increasing the fixed object setback by an incremental amount. The three measurements—minimum setback, average setback, and 15th percentile setback—were used as a proxy for the consistency of the fixed object setback for the length of a section. While these three predictors were used in each analysis, the minimum setback measurement was determined to be the most useful because it is the most accurate measurement of the clear zone. The example roadway section in Figure 5-1 has a minimum clear zone of 2 ft, an average clear zone of 4.1 ft, and a 15th percentile clear zone of 2 ft.
Figure 5-1. Example roadway section
20
To assess the significance of the clear zone distance, these three predictors were evaluated over three different lengths of linear sections, including segments, blocks, and 15 m lengths. The segments are of varying linear distances, which range from a few blocks to a mile in length, depending on roadway characteristics. The blocks are the linear distance of the particular street block. The 15 m lengths are 15 m long sections as measured along the centerline of the roadway. The segment measurement was determined to be the most useful because the driver is able to adjust to the driving conditions of the longer length of roadway. 5.2. Minimum Setback The minimum setback is defined as the setback distance of the object that is closest to the face of the curb over the length of the section. In summary, only in the segment analysis did an increase in the minimum setback affect the number of fixed object crashes; the block and 15 m analyses showed no relation between these variables. 5.2.1. Segment Analysis In the segment analysis, the minimum setback showed a relationship to the average number of fixed object crashes. Figure 5-2 illustrates the average number of crashes per year in relation to the minimum setback. This figure shows that as the minimum setback is increased, the average number of fixed object crashes per year decreases.
Figure 5-2. Minimum setback in segment analysis
21
5.2.2. Block Analysis In the block analysis, the minimum setback did not show a relationship to the average number of fixed object crashes. Figure 5-3 illustrates the average number of crashes per year in relation to the minimum setback. This figure shows that as the minimum setback is increased, the average number of fixed object crashes per year is not affected. This indicates that the minimum setback is not a significant factor to be taken into account when designing the roadside placement of fixed objects.
Figure 5-3. Minimum setback in block analysis 5.2.3. 15 m Analysis In the 15 m analysis, the minimum setback did not show a relationship to the average number of fixed object crashes. Figure 5-4 illustrates the average number of crashes per year in relation to the minimum setback. This figure shows that as the minimum setback is increased, the average number of fixed object crashes per year is not affected. As with the block analysis, the minimum setback is not a significant factor to be taken into account when designing the roadside placement of fixed objects.
22
Figure 5-4. Minimum setback in 15 m analysis 5.3. Average Setback The average setback is defined as the average distance between the face of the curb and all the fixed objects in the segment. As shown in Figures 5-5 through 5-7, the average width of the clear zone does not have any quantifiable impact on the number of fixed object crashes that may occur. 5.3.1. Segment Analysis In the segment analysis, the average setback did not show a relationship to the average number of fixed object crashes. Figure 5-5 illustrates the average number of crashes per year in relation to the average setback. This figure does not show any significant relationship between the average setback and the average number of fixed object crashes per year. This conclusion is similar to the conclusions of the minimum setback analyses: that the setback distance does not affect the number of fixed object crashes.
23
Figure 5-5. Average setback in segment analysis 5.3.2. Block Analysis In the block analysis, the average setback did not show a relationship to the average number of fixed object crashes. Figure 5-6 illustrates the average number of fixed object crashes per year in relation to the average setback. This figure does not show any significant relationship between the average setback and the average number of fixed object crashes per year. The conclusion to be drawn from this analysis is the same as in the segment analysis: that the setback distance does not affect the number of fixed object crashes.
Figure 5-6. Average setback in block analysis
24
5.3.3. 15 m Analysis In the 15 m analysis, the average setback did not show a relationship to the average number of fixed object crashes. Figure 5-7 illustrates the average number of crashes per year in relation to the average setback. This figure shows that as the average setback increases, the average number of fixed object crashes per year is not affected. The conclusion is the same as for the segment and block analyses: that the setback distance does not affect the number of fixed object crashes.
Figure 5-7. Average setback in 15 m analysis 5.4. 15th Percentile Setback The 15th percentile setback used in this analysis is the offset distance that 85% of fixed objects are behind. For example, if the 15th percentile setback is 6 ft for a segment with 100 fixed objects, 85 of those fixed objects would have an offset greater than 6 ft, and 15 of those fixed objects would have an offset less than 6 ft. As shown by Figures 5-7 through 5-9, the 15th percentile width of the clear zone does not have any quantifiable impact on the number of fixed object crashes that may occur. 5.4.1. Segment Analysis In the segment analysis, the 15th percentile setback did not show a relationship to the average number of fixed object crashes. Figure 5-8 illustrates the average number of crashes per year in relation to the 15th percentile setback. This figure shows that as the 15th percentile setback increases, the average number of fixed object crashes per year is not affected. This conclusion agrees with that drawn from the minimum setback and average setback analyses: that the setback distance does not affect the number of fixed object crashes.
25
Figure 5-8. 15th percentile setback in segment analysis 5.4.2. Block Analysis In the block analysis, the 15th percentile setback did not show a relationship to the average number of fixed object crashes. Figure 5-9 illustrates the average number of crashes per year in relation to the 15th percentile setback. This figure shows that as the 15th percentile setback increases, the average number of fixed object crashes per year is not affected. This is the same conclusion from the segment analysis: that the setback distance does not affect the number of fixed object crashes.
Figure 5-9. 15th percentile setback in block analysis
26
5.4.3. 15 m Analysis In the 15 m analysis, the 15th percentile setback did not show a relationship to the average number of fixed object crashes. Figure 5-10 illustrates the average number of crashes per year in relation to the 15th percentile setback. This figure shows that as the 15th percentile setback is increased, the average number of fixed object crashes per year is not affected. This is the same conclusion from the segment and block analyses: that the setback distance does not affect the number of fixed object crashes.
Figure 5-10. 15th percentile setback in 15 m analysis 5.5. Intersection Area of Influence The intersection area of influence in this analysis is defined as the area that is within 45 m of the intersection centerline. A 15 m segment that is within 45 m of the intersection centerline is considered to be influenced by the intersection. The intersection was found to be a significant factor in the number of fixed object crashes. 5.5.1. 15 m Analysis In the 15 m analysis, the intersection area of influence showed a relationship to the average number of fixed object crashes. Figure 5-11 illustrates the average number of crashes per year in relation to the intersection area of influence. A “0” indicates that the 15 m segment is within 45 m of the intersection centerline and is considered to be influenced by the intersection. A “1” indicates that the 15 m segment is outside of the intersection area of influence and is not considered to be influenced by the intersection. The figure shows that segments within the intersection’s area of influence have greater average number of fixed object crashes per year than other segments. This demonstrates that the characteristics of an intersection do have an impact on the number of fixed object crashes, possibly a result of the inconsistent setback allowed for roadside objects such as trees, signing, and signal poles.
27
0.014
Average Fixed Object Crashes per Year
0.012
0.01
0.008
0.006
0.004
0.002
0 0
1 Area of Influence
Figure 5-11. Area of influence at intersections in 15 m analysis A significance test of the effect of the intersection was conducted to determine whether the difference in the number of fixed object crashes illustrated in Figure 5-11 is great enough to warrant mention. The test used was a “t-Test: Two-Sample Assuming Unequal Variance.” The results of this test are shown in Table 5-1. The test finds that, because the absolute value of the tstat is greater than the absolute value of t-critical, the effect of the intersection is statistically significant. Table 5-1. Results of intersection significance test t-Test: Two-Sample Assuming Unequal Variances Intersection Non-Intersection Mean 0.005319149 0.011455331 Variance 0.001676063 0.003177981 Observations 752 1388 Hypothesized Mean Difference 0 df 1964 t Stat -2.886722254 P(T