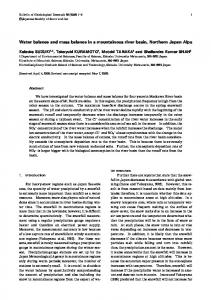
PROJETO KARST: WATER BALANCE AND ISOTOPE INVESTIGATIONS IN THE COMPARTMENT KARST AQUIFER OF COLOMBO-FERVIDA (CURITIBA/PR)
T. Harum1; H.P. Leditzky1; S. Reinsdorff1; P. Saccon1; H. Zojer1; A.A. Lisboa2; J.L. Vaine2; E.F. da Rosa Filho3; D.A. Giusti3; M.S. Monastier3 & A. Ribas4
Abstract - The paper gives an overview about the first results of an international co-operation project carried out in the karst aquifer of Colombo-Fervida 20 km N of Curitiba (Paraná). The aquifer is separated into compartments due to NW-SE-striking volcanic dikes which cut through a sequence of folded phyllites and carbonate rocks. The carbonate rocks are karstified and therefore represent an important aquifer which is partly drained by springs, but also exfiltrates to small creeks. The dikes can be considered as impermeable layers separating the aquifer to isolated compartments. Most of the springs are located at the contact of the aquifer to dikes. Combined investigations on geology, tectonics, catchment and isotope hydrology allowed to develop a conceptual model of groundwater recharge and transit times. The relatively high mean transit times (18-36 y) confirm the huge storage in the unsaturated zone of the weathered layer with thickness up to 40 m corresponding to infiltration velocities of 0.5-1 m/y. The correlation of measured discharges from subcatchment areas with those from the meteorological water balance proved deficits and surplus corresponding to mainly areas of recharge in the north-western part and discharge in the
1
Institute of Hydrogeology and Geothermics, JOANNEUM RESEARCH, Elisabethstrasse 16, A-8010 Graz/Austria, phone: ++43 316 876 1372, fax: ++43 316 876 1321, email:
[email protected] 2 Superintendência de Desenvolvimento de Recursos Hídricos e Saneamento Ambiental SUDERSHA, Rua santo Antônio, 239 – Bairro Rebouças, Curitiba – PR/Brazil CEP: 80230-120, phone: ++55 41 333-4774, fax: ++55 41 333-3621, email:
[email protected] 3 Departamento de Geologia, Universidade Federal do Paraná, Centro Politécnico - Jardim das Américas Caixa Postal 19001 – Curitiba – PR/Brazil CEP 81531-990, phone: ++55 41 361-3163, fax: ++55 41 2662393, email:
[email protected] 4 Companhia de Saneamento do Paraná SANEPAR, Unidade de Serviços de Hidrogeología, Rua Alexandre Gutierrez 528 – Água Verde, Curitiba – PR/Brazil CEP 80240-130, phone: ++55 41 342 2652, fax: ++55 41 342 6297, email:
[email protected] st 1 1 Joint World Congress on Groundwater
south-eastern one and indicate the direction of karst water flow under the phyllites from NW to SE along the dikes.
Keywords - compartment karst, water balance, transit time
INTRODUCTION The city of Curitiba, capital of the Brazilian federal state Paraná with 1.5 Million inhabitants, has to fight with very large structure and ambient environment problems. The extreme population increase (per year about 6
%) leads to a strong uncontrolled urban
spread and an urbanisation of the periurban area with all accompanying phenomena typical of this. The cover of the drinking water consumption permanently growing represents one of the main problems which at present is covered predominantly with water from surface reservoirs. However, this must be treated with relatively high technical and financial effort. Till now, groundwater only was used little and without consideration of the available resources. In the last years various wells have been drilled in the karst area of ColomboFervida N of Curitiba and are being pumped for water supply. The increasing withdrawals of karst water led in some parts to an overexploitation and consequently conflicts between the fast development of urbanisation due to the vicinity of the city of Curitiba , intensive agricultural land use and water use for irrigation of the resident population. These conflicts led to a co-operation within the frame of the “Projeto Karst” created between the Universidade Federal do Paraná UFPR (Departamento do Geologia), the Companhia de Saneamento do Paraná SANEPAR, the Superintendência de Desenvolvimento de Recursos Hídricos e Saneamento Ambiental SUDERSHA and the Institute of Hydrogeology and Geothermics (JOANNEUM RESEARCH JR, Austria). Intensive investigations are being carried out in parts of the karst aquifer of Colombo-Fervida near Curitiba with the main goal to create the data base and conceptual model for a sustainable use and management of the karst water resources. UFPR was mainly engaged in mapping and compilation of the geological and tectonical background and together with JR on the hydrogeological mapping, SUDERSHA mainly in the compilation and evaluation of the hydrometeorological data as basis for the water balance and JR mainly in land use mapping, development of a conceptual model of water balance and karst water dynamics based on hydrological, isotope and hydrochemical investigations. The project is not finished due to the necessary long time observations of hydrological and isotope st
1 Joint World Congress on Groundwater
2
parameters, the first results are documented in two unpublished reports (T. HARUM et al., 1998; G. DONIZETTI et al., 1998). The area investigated comprises about 85 km2. It is situated approximately 20 km N of Curitiba (Paraná) mainly in the municipality of Colombo, and a smaller western part in the municipality of Almirante Tamandaré. It contains the regions of Colombo Fervida, Colombo Sede and the upper valleys of Agua Comprida river and Atuba river in Colombo and the upper valley of Uvaranal river in Almirante Tamandaré. The main watershed between Colombo Fervida and Colombo Sede divides the investigation area: the western part drains to the system of Iguaçu river and the eastern part to the drainage basin of Ribeira river.
1.
GEOLOGICAL AND HYDROGEOLOGICAL BACKGROUND The karst area north of Curitiba belongs geologically to the Açungui Group. The
lithology of the investigation area belongs to the Capiru Formation that comprises all the metasediments of higher pre-cambrian age. The depositional environment varies from very shallow platform carbonates to continental slopes with turbidite deposite. As well, the climatic conditions varied from wet to glacial or subglacial (FIORI; GASPAR, 1993). According to A.P. FIORI (1992, 1994) and A.P. FIORI & GASPAR (1993) the tectonic evolution of the Açungui Group is complex and results from three superimposed deformation events that altered the original stratigraphic order. The geological map is represented in fig. 1. The result of the mapping is, that the geology in the area of Colombo is dominated by three E - W - striking valleys in dolomites which are separated by phyllite ridges. By the systematic observation of the ground-water level in wells and the hydrological investigations (section 2) the hydraulic connection between the carbonates below the phyllite ridge could be proved. Strong volcanic activities in the Mesozoic age led to intrusion of magmatic rocks. Erosional outlier of such dikes form NW-SE oriented lines. The thickness of dikes can reach 100 m. The direction of the dike configuration is given by an proterozoic fault system. The magma reached the surface and formed the Serra Geral Formation, which covers the vast western part of Paraná. In the investigation area this magma cover is completely eroded. These dikes cut through a sequence of folded phyllites and dolomites, separating them at the surface. The carbonate rocks are intensively karstified and therefore represent
st
1 Joint World Congress on Groundwater
3
an important aquifer which is partly drained by springs but also partly exfiltrates directly into
st
1 Joint World Congress on Groundwater
4
Fig. 1:
st
Geological map of the karst area of Colombo (with contributions from L. CHAVEZ, M.J. GUARDA, E. HINDI, A. KERTSCHER).
1 Joint World Congress on Groundwater
5
the small creeks of the investigation areas. The dikes can be generally considered to be impermeable layers separating the aquifer to compartments of different hydraulic and recharge characteristics. Most of the spring outlets are located at the contact of the karst aquifer to the dikes. Due to the less permeable thick weathered layer (up to 40 m) the aquifer is semiconfined and its recharge is mainly originating from diffuse infiltration of precipitation, in some areas direct recharge from the creeks through dolines could be detected. South of the karst area the base of karstification is formed by the outcropping crystalline basement. The youngest sediments of tertiary age are formed by the so called Guabirotuba formation.
2.
FIRST RESULTS OF WATER BALANCE
2.1
ACTUAL EVAPOTRANSPIRATION One of the main goals of the investigations of the karst aquifer is the determination of
the water balance. The method was chosen to estimate at first the potential evaporation using meteorological formulae and consequently the real one by vegetation indices. A map of the land use system was carried out by classification of a satellite image from LANDSAT5 with a ground resolution of 30x30 m. 20 cluster classes have been set, the channels chosen for the classification are: channel number 3 (red) 0.63-0.69 m, channel number 5 (middle IR) 1.55-1.75 m, channel number 7 (middle IR) 2.08-2.35 m. The clustering was verified in the field. 8 land use classes could be verified, the map of land use is represented in fig. 2. The potential evaporation Etp was estimated after the equation of H.L. PENMAN (1956). The actual evapotranspiration Etr can be considered as the most unsure parameter, which depends not only on meteorological parameters but also mainly on the vegetation cover. Various methods exist for its estimation on the basis of vegetation indices. In Southern America often the method of C. GRASSI & G. CHRISTIANSEN (1966) is used, Etr is calculated from Etp using coefficients from temperature, duration of the vegetation cycle, percentage of its total duration and cultivation factors (UNESCO, 1982).
st
1 Joint World Congress on Groundwater
6
Land use categories
Forest old Forest young Bush Grass land Arable land
8.3
No vegetation
8.4
8.7 8.5
Quarry-pit
8.6
Low urban density Water bodies Catchment areas 7.1.1
6.0
5.0
8.2.0
7.2.1
7.1.0 8.0
7.2.2.0
7.2.0 8.1.0
7.2.2.1.0
7.0
6.1 7.2.2.1.1 4.0 4.1
2.2.1
1.2.0
7.2.2.2
1.2.2
7.3.0 7.2.2.3.0
7.3.1 7.3.2.0
3.0
7.2.2.3.1.1.2 2.2.0
8.2.1
7.2.2.3.1.0
1.2.1
8.1.1
7.3.2.1 7.2.2.3.1.1.1 1.1
7.2.2.3.1.1.0 1.0
2.1
2.3 2.0
0
500
1000
1500
2000 m
M = 1 : 73.000
Fig. 2: st
Land use map and catchment areas of the investigation region.
1 Joint World Congress on Groundwater
7
The land use classes determined from remote sensing were again grouped to 6 types (open water bodies, grassland, forest, arable land, mixed areas and areas without vegetation) with corresponding cultivation factors and coefficients of variation of the vegetation cycle. For open water bodies the potential evaporation after PENMAN was used, for the other land use types Etr was calculated from Etp using the method of C. GRASSI & G. CHRISTIANSSEN (1966). Due to the low relief differences altitude effects could be neglected. The results comparing to the areal precipitation are summarised in tab. 1 and plotted in fig. 3 for the period 1974-1993.
Tab. 1: Mean monthly and annual precipitation P, potential Evaporation Etp, actual evapotranspiration Etr and theoretical mean monthly runoff MQ=P- Etr for 6 different land use classes in the area of Colombo-Fervida. Month 1 2 3 4 5 6 7 8 9 10 11 12 year (mm) year (l/s km 2) % of P
open water bodies grassland forest arable land mixed area no vegetation P (mm) Et p (mm) P-Et p (mm) Et r (mm) P-Et r (mm) Et r (mm) P-Et r (mm) Et r (mm) P-Et r (mm) Et r (mm) P-Et r (mm) Et r (mm) P-Et r (mm) 182 109 73 85 97 96 86 77 105 81 101 67 115 142 93 49 72 70 82 60 65 77 69 73 57 85 120 84 36 66 54 75 45 60 60 63 57 52 68 81 58 23 48 33 54 27 43 37 46 35 38 43 97 41 56 35 62 40 57 32 65 34 63 28 69 102 33 69 29 73 33 69 23 79 26 76 23 79 93 38 54 34 59 39 54 27 66 30 62 27 66 67 51 16 45 22 51 16 41 26 43 24 35 32 121 62 58 54 67 61 59 49 72 51 69 43 78 129 85 44 71 58 81 49 64 65 68 62 56 73 117 97 19 79 38 89 27 71 45 75 42 62 54 149 103 46 81 67 92 56 74 75 78 71 64 84 1399 856 544 699 700 794 605 628 771 663 736 553 846 44.3 100.0
27.1 61.2
17.2 38.8
22.1 49.9
Min (l/s km 2)
25.6
Max (l/s km 2)
69.3
22.2 50.1
25.2 56.7
12.5
6.0
41.5
27.8
11.0
8.5
12.5
32.2
37.0
36.6
19.2 43.3
19.9 44.9
24.4 55.1
21.0 47.4
6.2
8.7
10.0
9.9
32.6
29.3
40.0
30.8
23.3 52.6
17.5 39.5
26.8 60.5
9.3
8.7
12.1
38.5
25.5
43.8
Precipitation and evapotranspiration 200 180 160
P, ETr (mm)
140
Precipitation ETp from surface water
120
Forest Grassland
100
Mixed area 80
Arable land No vegetation
60 40 20 0 1
2
3
4
5
6
7
8
9
10
11
12
Month
Fig. 3:
Mean monthly precipitation P and actual evapotranspiration Etr for different land use classes in the area of Colombo-Fervida.
st
1 Joint World Congress on Groundwater
9
The calculated values of Etr has to be seen as mixed mean values which depend in a high extend on the ground resolution and accuracy of the land use mapping. Mainly for the category „arable Land“ high local differences can occur depending on the cultivated crops, which could not be distinguished on the satellite image from winter. Also for „mixed areas“ a high variability within the class is probable. But the results are in good accordance with the maximum evapotranspiration Etm calculated by EMATER (1997) for typical crops in the area of Colombo-Fervida. The results confirm that in a normal year there is a surplus in the water balance all over the year, Etr never being higher than the precipitation for all land use groups. 2.2
FIRST ESTIMATION OF THE METEOROLOGICAL WATER BALANCE The main methodological aspect of the investigations in the karst area of Colombo-
Fervida is the development of a catchment model, which uses the altitude effects of specific yield (q in l/s km2) and the stable isotope
18
O. Fig. 6 shows a flow chart of the
different steps and expected results of the model RYAMOAM (runoff yield-altitude model). The methodology is described in H. BERGMANN et al. (1996) and T. HARUM & J. FANK (1997). The first step is the selection of adaptable measuring points for runoff and the division of the area in various orographic subcatchments which are delimited on the basis of the morphology. For the subcatchments the morphometric parameters, mainly the mean altitude of each subcatchment are calculated on the basis of a digital elevation model. At the outlet of every subcatchment runoff measurements are being carried out partly continuously at gauging stations, partly periodically. The periodical runoff data are correlated with those of the gauging station using a multiple linear regression model, which allows to estimate the main statistical hydrological values (mean annual and monthly runoff and runoff yield) for each subcatchment as basis for the water balance. For the model calibration catchment areas with corresponding orographic watershed and recharge area or the theoretical water balance from meteorological data are used. Under comparable meteorological conditions their mean specific yields (in l/s km2) will be characterized by a linear relationship to the mean altitude. The same catchment areas will usually have a linear relation between the parameters 18O and altitude.
st
1 Joint World Congress on Groundwater
10
Catchment model DTM Digital Terrain model
Discharge Continous data from gauging stations, periodical measurements in the tributary catchments concentration 18O, Tritium
Morphometric parameters Orographical delimitation of the catchment areas
RYAM Runoff yield altitude model catchments for calibration Areal precipitation, water balance Correlation specific yield : mean altitude Deficits and surplus
Precipitation Rain gauges 18O, Tritium
Discharge evaluations Correlations periodical to continous measurements, MQ and MoMNQ Discharge recession curves
OAM 18O - altitude model Mean residence time catchments for calibration Correlation 18O : Altitude
Mean altitude and surface of the recharge areas Effective porosity Storage capacity Total water volume and volume of mobile water Water balance
Fig. 7:Flow chart of the conceptual catchment model RYAMOAM (T. HARUM & J. FANK, 1997).
Deviations from this calibration function can have different reasons (H. BERGMANN et al., 1996): •
Differences in precipitation and/or evapotranspiration, therefore differing groundwater recharge.
•
The recharge area does not correspond to the orographic watershed.
•
Anthropogenic reasons (derivations to or from the catchment area, irrigation etc.).
•
The runoff measurement point at the outlet of the catchment does not represent the total outflow due to an existing aquifer.
If the deviations from the calibration function are only due to not corresponding recharge area and orographical catchment, they can be interpreted as deficit or surplus. Combining the two models RYAM and OAM one can estimate from them the size and the mean altitude of the recharge area, the total water volume and volume of mobile water in the reservoir, the effective porosity and the storage capacity. Therefore the combined model RYAMOAM represents an important tool to characterize the main flow directions, the aquifer parameters and the water balance of the underground drainage systems.
st
1 Joint World Congress on Groundwater
11
In the case of the karst aquifer of Colombo-Fervida the altitude effect is not of high importance due to the low relief energy. At the present state the long term observation is not finished, but on the basis of the existing data first conclusions can be drawn on the recharge mechanism of the aquifer and the functioning of the hydrogeological compartments. The main goal of the hydrological investigations is the water balance of all subcatchments in the investigation area. At this time not enough runoff data are available for such a detailed balance. This will be only possible at the end of the project when simulation of hydrographs for all subcatchments will be done. But on the basis of the evaluations in section 2.1 a first rough estimation of the water balance can be done for the whole area of investigation, ist comparison to the existing runoff data cal allow to draw first conclusions on the recharge-discharge conditions in the compartments. Tab. 2 and fig. 5-6 summarise the results the theoretical runoff yields (estimated from the water balance) for the different land use classes.
Tab. 2: Mean annual precipitation and theoretical runoff with monthly minima and maxima. mm l/s km2 % of P Min (l/s km2) Max (l/s km2) 1399 44.3 100.0 25.6 69.3 846 26.8 60.5 12.1 43.8
Precipitation no vegetation
P P-Etr
arable land
P-Etr
771
24.4
55.1
10.0
40.0
mixed area
P-Etr
736
23.3
52.6
9.3
38.5
grassland
P-Etr
700
22.2
50.1
8.5
37.0
forest
P-Etr
605
19.2
43.3
6.2
32.6
open water bodies P-Etp
544
17.2
38.8
6.0
27.8
200 180 160 140 P, MQ=P-ETr (mm)
Precipitation No vegetation
120
Arable land 100
Mixed area Grassland
80
Forest Surface water
60 40 20 0 1
2
3
4
5
6
7
8
9
10
11
12
Month
Fig. 5:
Mean monthly precipitation P and theoretical mean total runoff depth (MQ=P-Etr) for different land use classes and in the area of Colombo-Fervida.
st
1 Joint World Congress on Groundwater
12
P = 44.3 l/s km2 40
15 10
22.2 17.2
21.0
Mixed area
24.4
23.3
No vegetation
20
Grassland
25
27.1 Surface water
l/s km2
30
17.5
19.9 25.2
Forest
22.1
Arable land
35
ETr Mq=P-ETr
26.8
19.2
5 0
Fig. 6:
Mean annual precipitation P (in l/s km2) and theoretical mean total runoff yield (Mq=P-Etr) for different land use classes and in the area of Colombo-Fervida.
2.3 RUNOFF AND GROUNDWATER RECHARGE A first rough plausibility check is possible on the basis of long time runoff measurements at the gauging station Praia Grande on the river Capivari (catchment area 920 km2, period 1931-1969). According to W. WUNDT (1953, 1958) the mean monthly low water runoff yield MoMNqT is corresponding for long observation periods to the groundwater runoff of a catchment area and consequently to the groundwater recharge. For the catchment area of Rio Capivari at Praia Grande a value of MoMNqT = 10.3 l/s km2 corresponding to a mean annual groundwater recharge of 325 mm is estimated for the period 1931-1969. Transferring this value to the area of investigation a first preliminary water balance with separation of the runoff components surface flow QS and groundwater runoff QG can be estimated after the following equation for the whole area of 85 km2, fig. 7) and for each subcatchment area.
P = Etr + QS + QG Etr = Σ Etr land use classes Until now the observation period of 1.5 years is too short to estimate mean runoff and specific yield from the different catchment areas. But mainly the first evaluation of a measurement series in may 1997, which represents low water runoff after a longer dry period, can give first results concerning the outflow from the orographical catchments and connections between the compartments when comparing these data with the theoretical mean annual discharge from the meteorological water balance. st
1 Joint World Congress on Groundwater
13
23% Evapotranspiration
Surface flow
54% Groundwater recharge 23%
P ETr Groundwater recharge Surface flow
mm 1399 754 325 320
l/s km2 44.3 23.9 10.3 10.1
l/s 3721 2006 864 851
Fig. 7:Preliminary water balance of the whole area of investigation.
The calculated ratios Nqmeas. / Mqest. are shown in fig. 8. They show very clearly the existence of deficits and surplus corresponding to mainly recharge areas in the nortwestern part and discharge areas in the south-eastern one and indicate the main direction of karst water flow from NW to SE along the dikes that seem to be mainly a hydrogeological barrier. Connections under the phyllites are indicated due to the high surplus in S and SE, a fact that is in good accordance with the tectonical situation (folded phyllites with underlaying carbonates). In some area the low water runoff is even more than 20 times higher comparing to theoretical MQ. As „normal“ value (no deficit and no surplus) the ratio NQ/MQ = 0.42 of the big phyllitic catchment area of Campestre in the northern part can be assumed taking into consideration corresponding orographical catchment and recharge area. In fig. 9 catchment areas with deficits and surplus are illustrated, the map proves the assumed main direction of karst water flow parallel to the dikes with the main discharge areas in the southwestern part where the basis of karstification is formed by the crystalline basement.
st
1 Joint World Congress on Groundwater
14
Ratio measured NQ / theoretical MQ (P-ETa) 10.00
NQMai97/MQ
1.00
NQ / MQ = 0.42 0.10
Fig. 8:
7.2.2.0
7.3.0
7.2.2.1.0
1.2.0
1.2.2
2.2.1
7.3.2.1
4.1
7.2.2.3.1.1.2
6.1
6.0
7.2.2.1.1
2.3
1.2.1
3.0
5.0
4.0
7.1.1
2.1
7.2.1
2.2.0
7.2.2.3.0
2.0
7.3.2.0
7.1.0
7.3.1
1.1
7.2.2.3.1.0
1.0
7.2.2.2
7.2.2.3.1.1.0
7.0
7.2.0
7.2.2.3.1.1.1
0.01
Ratio measured NQ / theoretical MQ (P-Etr) of the subcatchment areas during dry season (May 1997).
Fig. 9:
Catchment areas with “normal” (no inflow and outflow) water balance, recharge (deficit) and discharge (surplus) areas.
The area S and SW is characterised by thick phyllites and rocks of the crystalline basement, both formations with low permeability that are crossed by the NW-SE-striking dikes. Therefore the main discharge area of the karst aquifer must be N of these formations as the hydrological results indicate. But in the well data bank of SUDERSHA some wells in the crystalline basement could be found, which show very similar hydrochemical characteristics to karst water. Therefore it becomes probable that losses of st
1 Joint World Congress on Groundwater
15
the karst aquifer to the crystalline basement are existing. They could be explained by the probable existence of fractured zones in the basement in the vicinity of the dikes that could act as preferential zones of water flow. Until now the amount of these losses can not be estimated, but it is probably a smaller portion comparing to the outflow in the discharge areas of the karst aquifer.
3. MEAN TRANSIT TIME OF KARST WATER 3.1 METHODOLOGICAL ASPECTS The radioactive isotope tritium was lanced into the atmosphere mainly in the years 1960-1970 due to the hydrogen bomb tests. The peak concentration in precipitation was reached in the year 1963, since that year the tritium input is decreasing continuously. Observing the tritium concentrations in groundwater gives then the possibility to estimate the turnover time (H. BEHRENS at al., 1992; P. FRITZ & J.Ch. FONTES, 1986; P. MALOSZEWSKI, 1983; P. MALOSZEWSKI & A. ZUBER, 1996; E. MAZOR, 1991; H. MOSER & W. RAUERT, 1980). For the karst aquifer of Colombo-Fervida the exponential model after Y. YURTSEVER (1983) is used for the simulation of the output function in groundwater taking into account the half life time of tritium if 12.43 y. The mean residence time is determined by its variations until the best fit (minimum difference between measured and simulated tritium concentrations) is reached. The input concentrations of tritium were much lower in the southern hemisphere, therefore the accuracy of dating is reduced in the regions south of the equator. Additionally it has to be taken into account that in the area of Colombo Fervida no long term observation of tritium exist, therefore only data measured within the short period of the project can be used, for the determination of the input function data from stations of the global IAEA-network (IAEA, 1999) has to be included to the evaluation. The samples from selected springs were measured by GSF Munich (W. STICHLER).
3.2 DETERMINATION OF THE INPUT FUNCTION For tritium in precipitation, data are available from the meteorological stations in Rio de Janeiro, Porto Allegre, Buenos Aires and Ciudad Buenos Aires (IAEA, 1999). Unfortunately the analyses where stopped in 1978 for the Rio de Janeiro and 1983 for Porto Allegre. In Ciudad Universitaria Buenos Aires more actual data are available until 1991, they were combined with older data from Buenos Aires. Actual tritium concentrations in
st
1 Joint World Congress on Groundwater
16
precipitation has been measured in the frame of the Projeto Karst from samples of the pluviometer Strapasson in 1998. The input of tritium into the aquifer depends also on the amount of precipitation. Therefore for the most monthly existing data of all stations mentioned above weighted annual means were calculated using the monthly amount of precipitation as weighing parameter. The next step of evaluation was to estimate lacking data for the stations being nearest to the investigation area Rio de Janeiro and Porto Allegre using a multiple linear regression model. On this basis mean annual tritium concentrations could be simulated until the year 1991. The result shows that the measured actual data at Strapasson are even higher comparing to Rio de Janeiro 1991 but are well comparable with the input functions of Porto Allegre and Buenos Aires. Therefore the long time series of Porto Allegre can be assumed to be representative for the investigation area and can be extrapolated to actual values using additionally the data from Strapasson. The partly simulated and partly measured input functions are plotted in fig. 10.
80.00
weighted annual mean (TU)
70.00 Porto Allegre
60.00
Rio de Janeiro
50.00
Buenos Aires Strapasson
40.00 30.00 20.00 10.00 0.00 1955
1960
1965
1970
1975
1980
1985
1990
1995
year
Fig. 10: Tritium contents, estimated input functions in precipitation at the stations of Porto Allegre, Rio de Janeiro and Buenos Aires and actual contents at Strapasson.
The input function of tritium is characterised by a peak in the first years of the sixties due to the intensive nuclear tests during this period and a following period with continuously decreasing contents interrupted by a secondary peak in 1975. The shape of the function is nearly the same as for the northern hemisphere, but with much lower tritium fallout. This fact leads to a reduced accuracy when determining the mean transit times. For st
1 Joint World Congress on Groundwater
17
age dating the input function of Porto Allegre is used, the not measured natural background was estimated in the range of 1.5-2 TU.
3.3 RESULTS OF AGE DATING First tritium data exist now from 5 selected karst springs (TAS2, ONS22, ATS3, ATS2 and ONS11) which were sampled in May 1997 after a longer dry season. Their tritium contents are near to those of the actual precipitation. But due to the mostly nearly negligible fluctuations in the stable isotope
18
O in the springs an extremely young age can
be excluded ((D. GIUSTI et al., 1998). For the simulation the exponential model after Y. YURTSEVER (1983) was used with mainly two uncertainties: •
Until now only one tritium value at the selected karst springs (the observation period is too short to recognise longer trends, therefore intensive monthly tritium sampling makes no sense)
•
Very low input concentrations
The results of simulations are represented in fig. 11. The error of estimation (difference between measured and simulated tritium content) was in all cases lower than the measuring error of tritium. These first results have to be verified by further analyses, which will be done during the last project year. But they are plausible taking into account the thick weathered layer where mean percolation velocities of 0.5 - 1 m/y can be estimated. Furthermore they has been checked using also a combined mode of Piston flow and exponential model they results giving only differences in the range of one to two years. Concerning future measures of protection of the karst aquifer it is important to mention, that also relatively old groundwater can include components with very short residence times (T. HARUM et al., 1998), which represent greater risks for sudden pollution of the wells. This could be the case mainly at some wells where connections with creeks are possible and has to be verified during the third project year.
st
1 Joint World Congress on Groundwater
18
Springs ONS22, TAS2
100 90 80 70 60 50 40 30 20 10 0
Output function %
40 30 20 10 0 1950
1960
1970
1980
Input
60
Spring ONS11 Output function
50
%
40 30 20 10 0 1950
1990
1960
1970
1980
year
100
60 50
80
Output function
70
%
60
40 TU
40
90
ATS2
50
70
%
100
Input
60
80
Output function
50
70
90
ATS3
%
Tritium Units
Mean transit time: 20 y
Input
60
1990
year
Mean transit time: 26 y 70
100 90 80 70 60 50 40 30 20 10 0
50
30
40
30
40
20
30
20
30
20 10
10
0 1950
0 1960
1970
1980
1990
year
%
50
70
%
Input
60
Tritium Units
70
Mean transit time: 36 y
%
Tritium Units
Mean transit time: 18 y
20 10 0 1950
10 0 1960
1970
1980
1990
year
Fig. 11: Input in precipitation (station Porto Allegre), simulated output function and measured tritium content at the springs TAS2, ONS22, ATS3, ATS2 and ONS11, calculated mean transit times and portions (%) of components with different age.
CONCLUSIONS The combined hydrological and isotope investigations in the compartment karst aquifer of Colombo-Fervida could give first hints on the water balance, recharge mechanisms and transit times on the basis of a conceptual model. They show that a more detailed description of such complex aquifer systems is only possible on the basis of hydrological long term observations and combined interdisciplinary research taking into consideration all processes of the water cycle on catchment scale.
st
1 Joint World Congress on Groundwater
19
REFERENCES BEHRENS, H., R. BENISCHKE, M. BRICELJ, T. HARUM, W. KAESS, G. KOSI, H.P. LEDITZKY, Ch. LEIBUNDGUT, P. MALOSZEWSKI, V. MAURIN, v. RAJNER, D. RANK, B. REICHERT, H. STADLER, W.STICHLER, P. TRIMBORN, H. ZOJER & M. ZUPAN (1992): Investigations with natural and artificial tracers in the karst aquifer of the Lurbach system (Peggau-Tanneben-Semriach, Austria).- Steir. Beitr. z. Hydrogeologie, 43, 9-158, Graz. BERGMANN, H., J. FANK, T. HARUM, W. PAPESCH, D. RANK, G. RICHTIG & H. ZOJER (1996): Abflusskomponenten und Speichereigenschaften, Konzeptionen und Auswertemethoden.- Oesterreichische Wasser- und Abfallwirtschaft, 48, H. 1 / 2, 27-45, Vienna. DONIZETTI, G., T. HARUM, A. LEIS, H.P. LEDITZKY, A.A. LISBOA, M.S. MONASTIER, S. REINSDORFF, P. SACCON, J.L. VAINE & H. ZOJER (1998): Projeto Karst, 2nd progress report.- Unpubl. Report, 85 p, Graz – Curitiba, December 1998. EMATER (1997): Estudo do quadro natural do „Karst“.- Unpubl. Report, 34 p, Curitiba, December 1997. FIORI, A. P. (1992): Tectônica e estratigrafia do Grupo Açungui – PR. Boletim do Instituto de Geociências. Série Científica, v. 23, p. 55-74. FIORI, A. P. (1994): Evolução geológica da bacia do Açungui. Boletim Paranaense de Geologia. n. 42, p. 7-27. FIORI, A. P.; GASPAR (1993): Considerações sobre a estratigrafia do Grupo Açungui (Proterozóico Superior), Paraná, Sul do Brasil. Boletim do Instituto de Geociências. Série Científica, v. 24, p. 1-19. FRITZ, P & R. J.CH. FONTES (1986): Handbook of environmental isotope geochemistry The terrestrial environment, A., vol. 1, 545 S, Amsterdam (Elsevier). FRITZ, P & R. J.CH. FONTES (1986): Handbook of environmental isotope geochemistry The terrestrial environment, B. vol. 2, 557 S, Amsterdam (Elsevier). GRASSI, C. & G. CHRISTIANSEN (1966): Evapotranspiración. Métodos para determinar las necesidadas de riego.- Buenos Aires (INTA). HARUM, T. J. FANK (1997): Determination of the recharge area of a spring in an alpine dolomite karst aquifer using the altitude effects of runoff yield and isotope content.Oral presentation at the EGS symposium, April 1997, Vienna.
st
1 Joint World Congress on Groundwater
20
HARUM, T., P. MALOSZEWSKI, B. REICHERT, W. STICHLER & P. TRIMBORN (1998): Mean transit times in karst aquifers? A discussion of flow dynamics in karst.- XXVIII IAH Congress: Gambling with Groundwater", Las Vegas, Nevada, USA, 27 September to 2 October 1998 (extended abstract). HARUM, T., E. HINDI, H.P. LEDITZKY, S. REINSDORFF, Ch. SCHMID, V. YEHDEGHO & H. ZOJER (1998): Projeto Karst – Progress Report, 88 p, Graz – Curitiba, March 1998. IAEA (1999): Tritium data in the world precipitation network (INTERNET). JENSEN, John R. (1996): Introductory Digital Image Processing: A Remote Sensing Perspective. Englewood Cliffs, New Jersey: Prentice-Hall. LISBOA, A. A. (1997): Proposta de metodologia para avaliação hidrogeológica do Aquífero Karst, Compartimento de São Miguel. UFPR. Depto. Geologia. Dissertação de Mestrado apresentado no Curso de Pós-graduação em Geologia Ambiental da UFPR. Curitiba 1997. MALOSZEWSKI, P., W. RAUERT, W. STICHLER & A. HERRMANN (1983): Application of flow models in na alpine catchment area using tritium and deuterium data.- J. of Hydrology, 319-330, Amsterdam (Elsevier). MALOSZEWSKI, P. & A. ZUBER (1996): Manual on mathematical models in isotope hydrology.-IAEA-TECDOC-910, 58 p, Vienna (IAEA). MAZOR, E (1991): Applied chemical and isotopic groundwater hydrology, 274 S Milton Keynes (Open University Press). MOSER, H., & W. RAUERT (1980): Isotopenmethode in der Hydrologie - Lehrbuch der Hydrogeologie Bd. 8, 400 S., Berlin (Gebrüder Borntraeger). PENMAN, H.L. (1956): Estimating evaporation.- Trans. Amer. Geophys. Union, 37, 43-46. ROUSE J.W., HAAS R.H., SCHELL J.A. and DEERING D.W. (1974): Monitoring vegetation systems in the Great Plains with ERTS. Proceedings of the Third Earth Resources Technology Satellite-1 Symposium, Goddard Space Flight, NASA SP351, Science and Technical Information Office, NASA, Washington, D.C., 309-317. UNESCO (1982): Guía metodológica para la elaboración del balance hídrico de América del Sur.- 131 p, Montevideo (Rostlac). YURTSEVER, Y. (1983): Guidebook on Nuclear Techniques in Hydrology.- Vienna. WUNDT, W. (1953): Gewaesserkunde.- 320 p, Berlin (Springer).
st
1 Joint World Congress on Groundwater
21
WUNDT, W. (1958): Die Kleinstwasserführung der Flüsse als Maß für die verfügbaren Grundwassermengen.- In GRAHMANN: Die Grundwässer in der Bundesrepublik Deutschland und ihre Nutzung.- Forsch. Dtsch. Landeskunde, 104, 47-54, Remagen. ZOJER, H., J. FANK, T. HARUM, D. RANK & W. PAPESCH (1996): Erfahrungen mit dem Einsatz von Umwelttracern.- Oesterreichische Wasser- und Abfallwirtschaft, 48, H. 3 / 4, Vienna.
st
1 Joint World Congress on Groundwater
22