1. Blindswitch 2017: Proposing A New Manual Blind Control. Algorithm for Daylight and Energy Simulation. Amir Nezamdoost 1, Kevin Van Den Wymelenberg 1.
2017 IES Annual Conference August 2017 Portland, OR.
Blindswitch 2017: Proposing A New Manual Blind Control Algorithm for Daylight and Energy Simulation Amir Nezamdoost 1, Kevin Van Den Wymelenberg 1 1
University of Oregon, Energy Studies in Buildings Laboratory, Eugene & Portland, OR, USA
ABSTRACT Blind use patterns are typically not included in energy simulation and until recently with the adoption of IES LM-83 by LEED-V4, often not considered in daylight simulation. However, blind use can have a substantial impact on annual daylight and energy performance. Current manual blind use algorithms are too active and not likely representative of actual manual user behavior. This paper describes a new manual blind use pattern for use in annual energy and daylight simulations. A longitudinal field study was conducted in six high-rise commercial buildings in Boise, Idaho to answer the question: what are the motivating factors that influence occupants’ decision to operate manual blinds? The results reveal that weighted average “annual” percent of blind occlusion and “annual” average rate of change equal 37.9% and 49.1% respectively, based on observations made of 7,080 unique window groups accumulating 92,480 blind position recordings. Windows with better view quality scores showed statistically lower blind occlusion; blinds were more often closed on the ground floor (44.8%) in comparison to the upper floors (37.6%) possibly due to privacy concerns; and private offices had lower blind occlusion (25.2%) compared to open offices (41.2%). The influences of orientation, cloud cover, window to wall ratio, blind type, exterior obstructions, and glazing system were also quantified. The results were used to develop a new algorithm for manual blinds – called Blindswitch 2017. The new algorithm can be used to estimate annual daylight and energy performance in buildings with manual blinds. Blindswitch 2017 operates far less frequently than previous manual blind algorithms, such as the 2% sunlight blind trigger in LM-83 2012 and LEED V4, and serves as a more realistic baseline against which to compare dynamic façade technologies. KEYWORDS: Manual Blind Use; Blindswitch; Blind Occlusion, Shade Occlusion; Blind Position, Shade Position; LM-83; Human Behavior; Daylight and Energy Simulation
Blindswitch 2017 | Annual IES Conference 2017 | Amir Nezamdoost and Kevin Van Den Wymelenberg
1
1. INTRODUCTION Blind position and operation affect the amount and distribution of daylight entering a building as well as all forms of thermal transfer through windows (Newsham, 1994; Reinhart, 2004; Bourgeois et al., 2006; Van Den Wymelenberg, 2012; Nezamdoost and Van Den Wymelenberg, 2017a, 2017b). Daylight-sensing lighting controls hold the potential to save significant energy, however, realized savings are reduced by 35% (Dyke et al. 2015) if window blinds are closed. When deployed, blinds have the potential to reduce cooling energy and peak cooling demand, especially if located outside of the thermal envelope. Effective daylight-sensing lighting controls can also reduce cooling loads by minimizing waste heat from lights (Van Den Wymelenberg, 2012). However, these potential impacts cannot be determined during design stages without accurate manual blind for use in simulations. Blind use patterns are typically not included in energy simulation and until recently with the adoption of IES LM-83 by LEED-V4, often not considered in daylight simulation. This is in part because of the complexity associated with research of blind us patterns and user motivations. Over last two years, there has been much debate in the USGBC technical committee working with Illuminating Engineering Society (IES) - Daylight Metrics Committee (DMC) and Attachment Energy Rating Council (AERC) over pursuing an improved manual blind use algorithm for commercial buildings to be included in annual daylight simulations. In recent years, a number of researchers have attempted to determine whether occupants use manual interior blinds according to predictable patterns or not. The IES published Lighting Measurement 83 (IES LM-83, 2012) for annual daylight simulation and this document includes a preliminary manual blind use algorithm. There has been concern that the trigger in LM-83 (IES, 2012) (2% of sensors in sunlight defined as a simulated zero bounce 1000 lux trigger) is too active and too close to an automated façade solution. A subsequent literature review proposed two alternate manual blind use algorithms, Blindswitch-A and Blindswitch-B (Van Den Wymelenberg, 2012). Blindswitch-A regulates the blind occlusion based upon sunlight penetration depth and whether exterior direct normal irradiance exceeds 120 W/m². Blindswitch-B adjusts occlusion according to the vertical exterior illuminance. Since publishing the two alternate manual blind use algorithms in 2012, several field studies were conducted to explore whether these algorithms respond similarly to the actual blind use patterns of real occupants (Van Den Wymelenberg, 2012; O'Brien et al., 2013; Nezamdoost et al., 2014; Dyke et al., 2015; Nezamdoost and Van Den Wymelenberg, 2015b). The current algorithms have encouraged increased simulation considering manual blind use, but there are identified gaps and limitations that requires further research to improve manual blind use algorithms: 1- The current manual blind use algorithms are too active and unlikely representative of actual user behavior. That said, the current patterns simulate the use of manual blinds in the software programs seem to behave like an automated shading system (Konis 2011; Nezamdoost and Van Den Wymelenberg 2015a). 2- Blinds in current manual blind use algorithms move during unoccupied hours, which is not likely to happen in reality. (Nezamdoost and Van Den Wymelenberg 2015a; Nezamdoost 2015). 3- There is a long list of additional factors that researchers believe may contribute to manual blind use behavior including (privacy, desire to maintain view, lack of sense of ownership,
Blindswitch 2017 | Annual IES Conference 2017 | Amir Nezamdoost and Kevin Van Den Wymelenberg
2
office type, floor level, window size, window-to-wall ratio, and etc.) that should be accounted for. Accordingly, this study attempted to develop a new manual blind use algorithm based on a human factors and post occupancy field study in real buildings, to improve the accuracy of predicting energy and daylighting simulation.
2. METHODS The research plan was developed to address one primary goal and several detailed objectives. The primary goal of this study was to understand the way people operate manual blinds, and thereby propose a new manual blind use pattern supported by original research. The detailed objectives were to address a number of questions posed by the IES Daylight Metrics committee and other researchers regarding the motivating factors that may influence occupants’ decisions to operate blinds. These include whether blinds are more closed on the ground floor in comparison to the upper floors (possibly due to privacy concerns); if the windows with better view quality on upper floors have lower blind occlusion (maybe due to a desire to maintain views); and if private offices have higher or lower blind occlusion compared to open offices (possibly due to a concept of a social construct) (Lindsay and Littlefair, 1992; Inkarojrit, 2005). There was also interest to examine the relationship between blind occlusion (window covering) and building orientation, sky condition, exterior vertical illuminance value, blind type, exterior shading systems, building obstructions, and glazing systems.
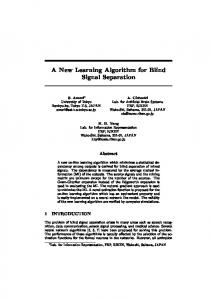
2.1. FIELD STUDY The field study was conducted in six multi-orientated mid-rise commercial buildings (five office buildings and one academic building) in downtown Boise, Idaho. Boise is a high desert climate (ASHRAE climate zone 5B) with approximately 206 sunny days per year. The position of blinds was recorded in 16 different observation days from May to February with various sky conditions. Data was collected five times per observation day, at 9am, 11am, 1pm, 3pm, and 5pm by taking high quality photographs from outside of the six case study buildings. Photographs were captured with a high-resolution digital camera with a wide-angle lens. The camera was mounted on a tripod and multiple shutter speed exposures were captured to ensure that all blind positions could be accurately recorded through the glazing.
Figure 1- Six commercial case study buildings in Boise, Idaho
Blindswitch 2017 | Annual IES Conference 2017 | Amir Nezamdoost and Kevin Van Den Wymelenberg
3
In order to increase generalizability, buildings were selected with diverse geometry, size, context, space type (38% open office, 52% private office, and 10% others such as meeting rooms, conference rooms, and etc.), number of floors, number of windows, windows size, window-towall ratio, window glazing characteristics, blind type (38.6% of windows with louver blinds, and 61.4% with roller shades), exterior shading devices (8% of total windows), and exterior obstructions (only building #5 had substantial built exterior obstruction on the southwest façade). Summary information for each case study building is presented in table 1. Table 1- Characteristics of case study buildings
Building Number
1
2
3
4
5
6
Number of Floors
11
8
9
2
4
6
Blind Type
Louver
Roller
Roller
Roller
Louver
Roller
WWR
30%
27%
48%
41%
17%
30%
Window VLT
54%
41%
50%
40%
38%
45%
Blind Openness Factor
5%
10%
10%
5%
10%
10%
Exterior Shading Device
No
No
No
No
Yes
Yes
Number of Windows
2,870
2,048
1,332
58
42
730
Number of Observation Days
4 days
4 days
6 days
2 days
6 days
1 day
Number of Window *Days
34,458
20,400
32,605
570
1,260
3,186
According to the diagonal downtown grid in Boise, case study buildings are rotated 32-degree clockwise from the true North axis. Therefore, blind operation data sets in this study were collected based on northeast, southeast, southwest, and northwest orientations. 2.2. DATA COLLECTION 2.2.1. Blind Occlusion As soon as the photographs were taken, the observed blinds position for each individual window were recorded. In order to record blind position and frequency of operation for each individual window with minimum error, building facades were broken into small portions as shown in figure Blindswitch 2017 | Annual IES Conference 2017 | Amir Nezamdoost and Kevin Van Den Wymelenberg
4
2 - left. Unique identification numbers were assigned to each window. Spreadsheets were created for each façade and organized following the façade shape and windows positions (Figure 2 – right). Each cell in the spreadsheets was representative of one individual window. The non-window area of façade (mullions, walls, and etc.) was coded. When a blind moved (either a change of blind position or slat angle) in the next observation time-span, the representative cell was highlighted. There were also some cases where windows were hidden behind trees or other obstructions. The entire process was completed manually and rechecked with spot check techniques to ensure data entry accuracy.
Figure 2- An example of data processing in building 1, showing how building façade was broken into small cells ( left) in order to record blinds position in an Excel Spreadsheet (right).
For each observation time the percentage of occluded area of the windows was recorded in the spreadsheets as two values: The first value was the percentage of the window covered with blinds and the second value was the blind tilt position (relevant for louver blinds). A value of 1 means that the blinds were down and tilted open (blind tilt = 0°) and you can see through them. A value of 2a means that the blinds were approximately halfway open (blind tilt = 45°) and turned up towards the sky. A value of 2b means that the blinds were approximately halfway open (blind tilt = 45°) and turned down towards the ground. A value of 3 means that the blinds were determined to be completely closed (blind tilt = 75°). In those buildings that roller shades were used, the blind closure number is equivalent to 3, being closed. Figure 3 provides examples of four different blind tilt positions (top), and how blinds closure percentages and tilt positions were recorded for every observation time (bottom).
Blindswitch 2017 | Annual IES Conference 2017 | Amir Nezamdoost and Kevin Van Den Wymelenberg
5
Figure 3- (Top) Different blind tilt positions. (Bottom) Examples showing how blinds closure percentages and tilt positions were recorded for every observation time.
In order to estimate and consistently apply the percent of blind occlusion based on the two recorded values of window covering percentages and blind tilt, an experiment was conducted in a northwestfacing room with 50% VLT window and a louver blind installed. First, interior vertical illuminance was measured ten feet from window without the blind. Then, the blind was operated in 10% increments for height and four tilt positions (open, halfway open and turned up towards the sky, halfway open and turned down towards the ground, and completely closed) for each height. The interior vertical illuminance was repeatedly measured for each iteration. The ratio between the initial illuminance reading and the recorded value for each blind position was directly translated into a percent of occlusion. Figure 4 illustrates the result of these tests for all blind scenarios, where the primary vertical axis (left) is the calculated percent of blind occlusion represented by the blue bars; and where, the secondary vertical axis (right) is the actual interior vertical illuminance value represented by the orange line. Percent occlusion for roller shades was estimated based on window covering percentages and blind closure number 3, being closed.
Blindswitch 2017 | Annual IES Conference 2017 | Amir Nezamdoost and Kevin Van Den Wymelenberg
6
Figure 4- Comparing the actual interior vertical illuminance readings to the calculated percent of blind occlusion in different blind operation scenarios.
2.2.2 Exterior Solar Measures In order to compare recorded blinds operation to external environmental parameters, a weather station containing six sensors was installed on the rooftop of building #1 (the tallest building in this field study in the downtown area) to provide more accurate continuous global solar irradiance, exterior horizontal illuminance and exterior vertical illuminance (in each orientation normal to the facades). Measurements of global irradiance and illuminance were performed during the period of study, covering a variety of sky conditions, from sunny, to partly cloudy, to overcast.
Figure 5- Location of exterior solar measures on the rooftop of building #1
The sky condition was recorded during the observations and rated as percentage of skydome covered with clouds from 1 (clear) to 10 (overcast), as shown in table 2. Hourly cloud cover data from National Oceanic & Atmospheric Administration (NOAA), covering the same period, were also considered to ensure sky condition accuracy. Table 2- Observed sky cover key
0
Sky Cover - Key (percentage of skydome covered with clouds as a % 1=10%, 9=90%) Clear Partly Cloudy - Mostly Cloudy Overcast 1 2 3 4 5 6 7 8 9 10
2.2.3. View Quality Ratings View quality values were derived for each window group by taking photographs through each window group looking at exterior views. Window groups were defined per façade in approximately two to three floor groupings for taller buildings, and assumed to be of similar view quality within the group.
Blindswitch 2017 | Annual IES Conference 2017 | Amir Nezamdoost and Kevin Van Den Wymelenberg
7
View photographs of all window groups were organized in a slide show (one slide for each window group) and presented to 10 participants with background in architecture and building science. Participants were asked to rate the quality of view on a scale of 1 to 7, where 1 corresponds to the lowest quality of view and 7 corresponds to the highest quality of view. Figure 6 shows two examples of view photographs with their corresponding mean scores.
Mean Score: 6
Mean Score: 2
Figure 6- View quality photographs with their corresponding mean scores – Left: West view from building #2, sixth floor – Right: North view from building #1, first floor
2.2.4. Other Variables Besides taking photographs for outside view, other variables were also recorded during interior tours of the buildings including, space type that each individual window belongs to (open office, private office, or others), blind type (louver or roller), and window size. Window VLT and blind openness factor were obtained from building owners or manufacturers. 2.3. DATA PROCESSING The collected data from interior and exterior photographs were used to calculate accurate blind occlusion and blind rate of change over the course of entire study period and for each study day. 7,080 window groups were observed in this study with 92,480 collected blinds position recordings. Blind occlusion and rate of change for each individual window was calculated and input into the spreadsheet. Time-series measures for predictor variables (e.g. global solar irradiance, exterior horizontal illuminance and exterior vertical illuminance) were then paired with blind position variables to perform statistical analyses. Data cleaning and sanity checks were conducted for the entire data set to ensure accuracy. Probability values (p-value) were employed to determine if the findings were statistically significant. Figure 7 shows the process used to create the required data sets for analysis of blind positioning, frequency of operation, and examination of blind operation in relation to physical, environmental, and human behavioral variables.
Blindswitch 2017 | Annual IES Conference 2017 | Amir Nezamdoost and Kevin Van Den Wymelenberg
8
Blind control data set
Capturing Exterior facade photographs
Weather Station (Exterior solar measures)
Global irradian ce
Percent of blind occlusion
Blind rate of change
Sky cover
Exterior vertical illum.
View
Exterior horiz illum.
Space type
Interior building tours
Owners & Manufacturers
Interior photos
Blind type
Window size
Window VLT
Blind openness factor
Figure 7- Diagram of sources of raw data used to create processed final data set for analysis of blind use behavior
3. RESULTS The overall results show that weighted average percent of blind occlusion using all processed data (92,480 window*days observations), equals 37.9%. Figure 8 compares the average percent of blind occlusion obtained from this study to the simulation results of previous work (Nezamdoost and Van Den Wymelenberg 2015a, 2016) on annual percent of blind occlusion in 10 unrelated spaces based on three current manual blind use algorithms. As shown in figure 8, each of the three current manual blind control algorithms considerably underestimated the average level of blind occlusion found within this study. However, it should be noted that the observed blind occlusion in this study is only limited to the 16 observation days throughout a year (data was not collected continuously), while the simulation blind occlusion results of 10 study spaces cover the occupied hours during the entire year.
Figure 8- Average percent of blind occlusion based on the field study during study period compared to simulation results of current proposed manual blind control algorithms
Blindswitch 2017 | Annual IES Conference 2017 | Amir Nezamdoost and Kevin Van Den Wymelenberg
9
Rate of change (ROC) is also calculated according to the observed frequency of blind operation. ROC means that a particular blind either engages or retracts at least once during a defined study period (Nezamdoost et al. 2014; Dyke et al. 2015). Figure 9 provides the weighted average percent of “daily” rate of change (average percent of blinds that changed at least one during each observation day), “seasonal” rate of change (average percent of blinds that changed once from one observation day to the next seasonal observation day), and “annual” blind rate of change (average percent of blind that changed once during the entire study period). All defined study periods (“daily”, “seasonal”, “annual”) are placed in quotation marks because they are limited by the fact that data were not recorded continuously. Rather, data were collected every two hours on intermittent days over a period of several months. In fact, “annual” in this case, should be understood as including data from the first to the last study day in the field study. Results, as illustrated in figure 9, reveal that 6.2% of monitored blinds were operated throughout the day (weighted average), meaning that only 6.2% of occupants could be considered to be ‘active users’ who adjust interior blinds on a daily basis. The average percent of blinds that were adjusted at least once from one season to the next season was determined to be 23.7%. Figure 9 also presents that 49.1% of occupants, on average adjusted blinds at least once during the entire study. The remaining 50.9% of occupants were not observed to change the blind position, even once, during monitored hours from May to February (“non-operators”). Again, it is important to stress that these findings are not conclusive proof that 50.9% of occupants never adjusted their blinds.
“Daily”
“Seasonal”
“Annual”
Figure 9- Average weighted percent of blind rate of change (ROC). Left: Daily ROC, Middle: Seasonal ROC, Right: Annual ROC
3.1. Determine if blinds are more closed on the ground floor (or spaces facing another building) in comparison to the upper floors, perhaps due to PRIVACY CONCERNS. In order to examine whether privacy is one of the motivating factors for the occupants to operate blinds, average weighted percent of blind occlusion on the ground floor (and spaces directly facing other buildings across a narrow street) was compared to the upper floors. Figure 10 shows that people who worked on the ground floor (or spaces facing other buildings) tended to close their blinds more than those on the upper floors (44.8% versus 37.6%). The two-sample t-test suggests that the findings are statistically significant.
Blindswitch 2017 | Annual IES Conference 2017 | Amir Nezamdoost and Kevin Van Den Wymelenberg
10
Figure 10- Comparing the annual average percent of blind occlusion on the ground floor and the upper floors
3.2. Determine if the windows with better view quality have lower blind occlusion due to a desire to MAINTAIN VIEWS. The weighted average annual percent of blind occlusion values of different view quality scores (17) were compared one another, to see how much outside view quality impacts occupants’ decisions to operate blinds. Figure 11 reveals that there is a logical relationship between view quality and blind occlusion. It seems that occupants show a higher probability for opening or leaving open the blinds when they enjoy the outside view of windows. The t-tests show that percent of blind occlusion values between different view quality scores are statistically significant, except the difference between view score 4 and 5 (p = 0.105).
Figure 11- Comparing the annual average percent of blind occlusion in different view quality scores (Likert scores 1-7).
Blindswitch 2017 | Annual IES Conference 2017 | Amir Nezamdoost and Kevin Van Den Wymelenberg
11
3.3. Determine if PRIVATE OFFICES have higher or lower blind occlusion compared to OPEN OFFICES. Observed blind occlusion behavior in different office space types was also analyzed and shown in figure 12. We found that blinds in open offices are more closed than private offices, and ‘others’ spaces (e.g. meeting rooms, break rooms, and etc.). The low blind occlusion values in private offices might be due to the lower occupancy rate (Mahdavi, 2009; Davis and Nutter, 2010; Duarte et al. 2013). Moreover, occupants at the private offices have the ability to change their position or task direction when the space is glaring, while it is not as easy for employees in open offices to modify their environment. The social contract concept is another possible explanation (Lindsay and Littlefair, 1992; Inkarojrit, 2005) for lower occlusion in private versus open offices. Finally, the difference may be due to the increased likelihood of finding at least one person within a larger open office space that is sensitive to brightness from daylight.
Figure 12- Comparing the annual average percent of blind occlusion in different office space types
3.4. Determine if blinds are more closed during SUNNY DAYS in comparison to the CLOUDY DAYS. Average blind occlusion percentages were compared to observed sky cloud cover ratings (see figure 13), where clear sky represents scores 1,2, and 3 (tenths of the sky covered with clouds); partly cloudy represents scores 4,5,6, and 7; and overcast sky represents scores 8,9, and 10. Looking at figure 13, although the blind occlusion values are close in different sky conditions, the highest number belongs to clear sky where the potential glare from excessive sunlight and sky brightness are more probable. The t-test reveals that the results of this comparison are statistically significant.
Blindswitch 2017 | Annual IES Conference 2017 | Amir Nezamdoost and Kevin Van Den Wymelenberg
12
Figure 13- Comparing the annual average percent of blind occlusion in different observed sky conditions
3.5. Determine if windows in different ORIENTATIONS have lower or higher blind occlusion The average percent of blind occlusion was found to be highly variable between different building orientations. Looking at figure 14, the highest percent of blind occlusion belongs to southeast and southwest orientations, except building #6. The east façade in building #6 includes classroom spaces, where it appears as though students prefer to close blinds during class time in the mornings (possibly to control glare on the computer screens). Those rooms, then, remain unoccupied after morning classes and blinds are left closed for the rest of the day. Conversely, the southwest façade in building #6 has only 0.43 percent (less than 1%) average blind occlusion, which is surprisingly low and is possibly due to the exterior shading devices installed on the southwest façade. In building #5, the blind occlusion value on southwest façade is considerably low in comparison to southeast (26.26% versus 55.7%). This result may be explained by shading from adjacent buildings as there are two mid-rise buildings located on the west side of building 5 that block a great deal of direct sunlight entering the southwest windows. Northwest windows across all buildings show the lowest occlusion values and this might be explained by the regular occupancy hours in commercial buildings being such that little solar exposure occurs during these times. However, there is an exception in building #1, where the percent of blind occlusion on northwest is slightly higher than northeast. This might happen due to better view quality on the northeast (includes mountains), but the view quality score for northeast is 7 while the view of northwest was rated 6, also very high.
Blindswitch 2017 | Annual IES Conference 2017 | Amir Nezamdoost and Kevin Van Den Wymelenberg
13
Figure 14- Comparing the annual average percent of blind occlusion in different orientations per building
3.6. Determine if BLIND TYPE impacts on percent of blind occlusion rates Blinds, themselves, might play an important role in blind use patterns and users motivations. Consequently, the annual average percent blind occlusion was compared between louver blinds and roller shades. Figure 15 reveals that occupants tend to close roller shades more than louver blinds, yet the occlusion values are rather close (33.8% versus 39.3%). The two-sample t-test suggests that the findings are statistically significant. It should be noted that the tests to calculate occlusion values (as mentioned in section 2.2.1) were more nuanced with louver blinds. Four blind tilt positions (open, closed, halfway open toward sky, and halfway open toward ground) were considered for louver blinds which considerably influence on the occlusion values, while shade openness factor was not considered for occlusion calculation of roller shades as there were not enough distinct openness factors in the study (5-10%).
Blindswitch 2017 | Annual IES Conference 2017 | Amir Nezamdoost and Kevin Van Den Wymelenberg
14
Figure 15- Comparing the annual average percent of blind occlusion in louver and roller blinds
3.7. Determine if how much exterior vertical illuminance influences percent of blind occlusion rates. Exterior vertical illuminance was measured every hour during the period of study. Figure 16 compares the average percent of blind occlusion and the measured exterior vertical illuminance in 20 klx intervals. Not surprisingly, occupants show a higher probability to deploy blinds in response to higher exterior vertical illuminance. While there is not a great deal of sensitivity between 0-80 klx, there is a substantial increase above 80 klx. The t-tests show that percent of blind occlusion values are statistically significant only between 40-60 klx, 60-80 klx and 80-100 klx exterior vertical illuminance intervals.
Figure 16- Comparing the annual average percent of blind occlusion and the measured exterior vertical illuminance in 20 klx intervals
Blindswitch 2017 | Annual IES Conference 2017 | Amir Nezamdoost and Kevin Van Den Wymelenberg
15
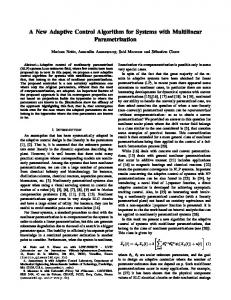
4. A SIMPLIFIED ALGORITHM FOR MANUAL BLINDS The processed results of the field study were also used to develop an algorithm for manuallyoperated blinds to be used in energy and daylighting simulations as a baseline. As shown and explained in the previous sections, the relationship between human behavior factors, external environmental parameters, and manual blind operation is non-linear and cannot be simply formulized. Consequently, the impact of these variables and their interactions require use of an empirical algorithm that addresses important variables. The blind occlusion data for the total number of blind operations observed (92,480 window observation) shows that 51.78% of the windows had blinds always open and 30.4% of the windows had blinds always closed. The remainder of blinds (~20%) was operated occasionally according to various psychological or environmental parameters. The single biggest change to current manual blind algorithms is an increase in the number of blinds that don't change position based upon a specified variable. An empirical model was extracted from the distribution of annual blind occlusion values to address this finding. Considering the need for a relatively simple format to be used in simulations, figure 17 presents a simplified algorithm for manually-operated blinds as a result of the overall distribution of blind positions: 50% always open and 30% always closed (representing passive users), and 20% operated (representing active users) based on environmental parameters.
Figure 17- Distribution of blind occlusion by total number of blind operations observed.
Following this approach, the distribution of blind occlusion for each orientation and office space type was also calculated (figure 18), in cases that more accurate simulation output is required.
Blindswitch 2017 | Annual IES Conference 2017 | Amir Nezamdoost and Kevin Van Den Wymelenberg
16
NE
SE
SW
NW
Figure 18- Distribution of blind occlusion for each orientation (top) and office space type (bottom).
Regarding the operated portion of blinds in the proposed algorithm, we found that exterior vertical illuminance shows relatively higher correlation with blind occlusion values (r2=0.19) among other exterior solar measures, where very low r2 values were reported for exterior horizontal illuminance and external global irradiance (r2=0.06 and r2=0.04, respectively). Accordingly, exterior vertical illuminance is suggested as the predictive variable for 20% blind operation by ‘active users’ as shown in figure 19, similar to Blindswitch-B algorithm that was proposed in the previous literature (Van Den Wymelenberg, 2012). As it was shown in figure 16, the percent of blind occlusion notably jumped when exterior vertical illuminance exceeded in 80 klx. This suggests that occupants feel uncomfortable above this threshold and accordingly increased blind closure. According to these findings and previous literature (Van Den Wymelenberg, 2012), a model for 20% of ‘active’ blind operation is provided in figure 19. It suggests that occlusion increases above 40 klx up to 100 klx and due to a hysteresis, decreases beginning at 50 klx down to 10 klx.
Blindswitch 2017 | Annual IES Conference 2017 | Amir Nezamdoost and Kevin Van Den Wymelenberg
17
Figure 19- Proposed model for 20% of ‘active’ blind operation in simulation
5. DISCUSSION This study analyzed the percent of blind occlusion and rate of change for interior manual blinds based on observations made of 7,080 window groups (5 times per day, during 16 study days between May and February), with 92,480 collected total blinds position recordings. The results from these observations lead to a number of questions regarding the motivating factors that can impact on occupants’ decisions to operate blinds. These questions were analyzed and addressed in the results section, and summarized as follow: (1) Blinds are more closed on the ground floor in comparison to the upper floors, (2) Private offices have lower blind occlusion compared to open offices, (3) Blinds are more closed during sunny days in comparison to the cloudy days, (4) Roller shades are more closed than louver blinds, (5) The highest percent of blind occlusion belongs to the windows facing southeast, while northwest windows show the lowest occlusion value, (6) Windows with external shading device have lower blind occlusion values. The paper also identifies the significant relationship between view quality scores and the percent of blind occlusion. Results revealed that people tend to leave blinds open longer, or reopen them sooner, when they enjoy the outside view from the window. This confirms the previous studies (Tuaycharoen and Tregenza 2005, 2007) that showed the discomfort of glare from daylight appears to be tolerated to a much higher degree if there is also a pleasant view from the window. Other variables of interest (e.g. blind openness factor, window VLT, window-to-wall ratio, window size, and number of floors) were also tested in this study to determine their effects on blind occlusion rates, however, their relationships were not statistically significant. Notably, about 93.8% of the monitored blinds were not operated at all throughout a given average day, and 50.9% of blinds were note observed to have moved during the entire period of study. Observed blind control behavior was revealed that occupants generally do not operate interior manual blinds/shades on a daily basis in response to the direct beam sunlight (as used in LM-83 algorithm), or the presence of direct sun on interior workspaces (as used in Blindswitch-A), or exterior vertical illuminance (as used in Blindswitch-B). Results showed that the majority of occupants operated blinds far less frequently or not at all, which supports findings in previous field studies using external monitoring (Rubin et al., 1978; Rea, 1984; and Inoue et al., 1988).
Blindswitch 2017 | Annual IES Conference 2017 | Amir Nezamdoost and Kevin Van Den Wymelenberg
18
The authors believe that the proposed algorithm is much more representative of actual user behavior in real buildings, since the findings reveal that large portion of occupants behave like “non-operators” (50.9%), not “active users” (6.2%). Blindswitch-2017 algorithm is considered to be a better basis for predicting the state of blinds than the relatively “active user” algorithms (IES LM-83 2012, Blindswitch-A 2012 and Blindswitch-B 2012). However, future case studies are needed to compare performance of proposed algorithm to confirm this assumption, especially in additional climate zones and buildings types. The developed algorithm is proposed based on our observations in one climate zone. Future studies is necessary to test its applicability in other climate zones with different sky luminance distributions and sociocultural factors. Blindswitch-2017 is developed for use with whole building simulations (or larger areas that could logically be divided into ten window groups). In order to reconcile it for spaces with only one or just a few windows, some rules and refinements are required to be established in the future.
6. CONCLUSION This paper presents original manual blind use field study data and proposes a new manual blind use baseline for use in commercial building energy and daylight simulation. Six commercial buildings in Boise, Idaho were observed during 16 study days between May and February. Data from 92,480 total observed blinds positions, were collected and processed to find the motivating factors that impacts occupants’ decisions to operate manual blinds. The results revealed that occupants’ use of blinds is dictated by a combination of human behavior factors (privacy, desire to maintain view, lack of sense of ownership); external environmental parameters (sky condition, exterior vertical illuminance); and building characteristics (window orientation, blind type). This broad range of effective variables reaffirms the complexity associated with research of blind use patterns. The processed data were also used to determine the overall distribution of observed blinds positions, which were the basis of developing a new manual blind algorithm, Blindswitch-2017. In most monitored blinds, occupants rarely (or never) adjusted the blind position throughout the day - 51.8% of the windows had blinds always open and 30.4% of the windows had blinds always closed. The remainder of blinds were operated occasionally according to environmental or psychological parameters. Finally, the results of the field study were used to develop an empirical algorithm for manual blinds that can be used as a baseline to estimate overall performance of manual blinds in energy and daylight simulation. The biggest improvement of this study was to increase the percentage of manual blinds that are in fixed open or fixed closed positions, and reducing the percentage of blinds that are set to be adjusted based upon the environmental variable of exterior vertical illuminance with a hysteresis phenomenon included. The new manual blind use algorithm and the experimental methodology that led to it can be improved through future studies with more case study buildings, climate zones, and cultures.
Blindswitch 2017 | Annual IES Conference 2017 | Amir Nezamdoost and Kevin Van Den Wymelenberg
19
7. ACKNOWLEDGMENT This research was partially supported by Richard Kelly Grant. The authors would like to thank Brad Acker, Bryce Boehler, Ty Caldwell, Ery Djunaedy, Caty Foye, Dakota Gullickson, Lauren Hemley, Will Krahn, Troy Lachich, Eric Lind, and Alen Mahic, who helped us in data collection.
8. REFERENCE [1]
Bourgeois, D., Reinhart, C. & Macdonald, I. (2006). Adding advanced behavioural models in whole building energy simulation: A study on the total energy impact of manual and automated lighting control. Energy and Buildings, 38(7), pp.814–823.
[2]
Davis, J.A., D.W. Nutter, D.W. (2010). Occupancy diversity factors for common university building types. Energy and Buildings, 42 (9), 1543–1551.
[3]
Duarte, C., Van Den Wymelenberg, K., & Rieger, C. (2013). Revealing occupancy patterns in an office building through the use of occupancy sensor data. Energy and Buildings, 67, 587–595.
[4]
Dyke, C., Van Den Wymelenberg, K., Djunaedy, E. and Steciak, J. (2015). Comparing Whole Building Energy Implications of Sidelighting Systems with Alternate Manual Blind Control Algorithms,” Buildings, vol. 5, no. 2, pp. 467–496.
[5]
IESNA-Daylight Metrics Committee. (2012). Lighting Measurement #83, Spatial Daylight Autonomy (sDA) and Annual Sunlight Exposure (ASE).
[6]
Inkarojrit, V. (2005). Balancing Comfort: Occupants’ Control of Window Blinds in Private Offices, University of California, Berkeley.
[7]
Inoue T, Kawase T, Ibamoto T, Takakusa S, and Matsuo Y, 1988. The development of an optimal control system for window shading devices based on investigations in office buildings. ASHRAE Transactions 104, 1034-1049.
[8]
Konis, K. (2011). Effective Daylighting: Evaluating Daylighting Performance in the San Francisco Federal Building from the Perspective of Building Occupants. Doctoral dissertation at University of California, Berkeley.
[9]
Lindsay, C.R.T., Littlefair, P.J. (1992). Occupant Use of Venetian Blinds in Offices, vol. PD 233/92, Watford Building Research Establishment.
[10]
Mahdavi, A. (2009). Patterns and implications of user control actions in buildings. Indoor and Built Environment, 18 (5), pp. 440–446.
[11]
Nezamdoost, A., Mahic, A., & Van Den Wymelenberg, K. (2014). Annual energy and daylight impacts of three manual blind control algorithms. In 2014 IES Annual Conference Proceedings. Pittsburg, PA.
[12]
Nezamdoost A. (2015). Development of annual daylight performance metrics: Sensitivity analyses of illuminance thresholds and blind use, and examinations of energy use implications
Blindswitch 2017 | Annual IES Conference 2017 | Amir Nezamdoost and Kevin Van Den Wymelenberg
20
(M.S.). University of Idaho, United States. 239 p. Retrieved from http://search.proquest.com/docview/1751057612 [13]
Nezamdoost, A., & Van Den Wymelenberg, K. G. (2015a). Daylit area revisited: A comparative sensitivity study of daylit area drawings with daylight results from point-in-time and annual simulations. In 2015 IES Annual Conference Proceedings. Indianapolis, IN.
[14]
Nezamdoost, A., & Van Den Wymelenberg, K. (2015b). A Comparative Study of Spatial Daylit Area Drawings with Annual Climate-based Simulation Using Multiple Manual Blind Control Patterns, and Point-in-time Simulation. In 2015 ASHRAE Energy Modeling Conference: Tools for Designing High Performance Buildings, ASHRAE.
[15]
Nezamdoost, A., & Van Den Wymelenberg, K. (2016). Sensitivity study of annual and point-intime daylight performance metrics: A 24 space multi-year field study. IBPSA-USA Journal, 6(1).
[16]
Nezamdoost, A., & Van Den Wymelenberg, K. G. (2017a). Revisiting the Daylit Area: Examining Daylighting Performance Using Subjective Human Evaluations and Simulated Compliance with the LEED Version 4 Daylight Credit. LEUKOS, 13(2), 107-123.
[17]
Nezamdoost, A., & Van Den Wymelenberg, K. (2017b). A daylighting field study using human feedback and simulations to test and improve recently adopted annual daylight performance metrics. Journal of Building Performance Simulation. https://doi.org/10.1080/19401493.2017.1334090
[18]
Newsham, G.R. (1994). Manual Control of Window Blinds and Electric Lighting: Implications for Comfort and Energy Consumption. Indoor and Built Environment, 3(3), pp.135–144.
[19]
O'Brien, W., Kapsis, K., & Athienitis, A. K. (2013). Manually-operated window shade patterns in office buildings: A critical review. Building and Environment, 60, 319-338.
[20]
Rea, M. (1984). Window blind occlusion: a pilot study. Building and Environment, 19(2), 133137.
[21]
Reinhart, C.F. (2004). Lightswitch-2002: a model for manual and automated control of electric lighting and blinds. Solar Energy, 77(1), pp.15–28.
[22]
Rubin, A. I., Collins, B.L. & Tibbott, R.L. (1978). Window blinds as a potential energy saver - A case study (NBS Building Science Series 112). Washington, DC: U.S. Department of Commerce, National Bureau of Standards.
[23]
Tuaycharoen, N. & Tregenza, P.R. (2005). Discomfort Glare from Interesting Images. Lighting Research & Technology. 329–341.
[24]
Tuaycharoen, N. & Tregenza, P.R. (2007). View and Discomfort Glare from Windows.” Lighting Research & Technology. 185–200.
[25]
Van Den Wymelenberg, K.G. (2012). Patterns of occupant interaction with window blinds: a literature review. Energy and Buildings, 51(0), pp.165–176.
Blindswitch 2017 | Annual IES Conference 2017 | Amir Nezamdoost and Kevin Van Den Wymelenberg
21