Computational and Structural Biotechnology Journal 11 (2014) 73–90
Contents lists available at ScienceDirect
journal homepage: www.elsevier.com/locate/csbj
Mini Review
Proteomics for systems toxicology Bjoern Titz ⁎,1, Ashraf Elamin 1, Florian Martin, Thomas Schneider, Sophie Dijon, Nikolai V. Ivanov, Julia Hoeng, Manuel C. Peitsch Philip Morris International R&D, Philip Morris Products S.A., Quai Jeanrenaud 5, 2000 Neuchâtel, Switzerland
a r t i c l e
i n f o
Available online 27 August 2014 Keywords: Systems toxicology Quantitative proteomics Computational analysis
a b s t r a c t Current toxicology studies frequently lack measurements at molecular resolution to enable a more mechanismbased and predictive toxicological assessment. Recently, a systems toxicology assessment framework has been proposed, which combines conventional toxicological assessment strategies with system-wide measurement methods and computational analysis approaches from the field of systems biology. Proteomic measurements are an integral component of this integrative strategy because protein alterations closely mirror biological effects, such as biological stress responses or global tissue alterations. Here, we provide an overview of the technical foundations and highlight select applications of proteomics for systems toxicology studies. With a focus on mass spectrometry-based proteomics, we summarize the experimental methods for quantitative proteomics and describe the computational approaches used to derive biological/mechanistic insights from these datasets. To illustrate how proteomics has been successfully employed to address mechanistic questions in toxicology, we summarized several case studies. Overall, we provide the technical and conceptual foundation for the integration of proteomic measurements in a more comprehensive systems toxicology assessment framework. We conclude that, owing to the critical importance of protein-level measurements and recent technological advances, proteomics will be an integral part of integrative systems toxicology approaches in the future. © 2014 Titz et al. Published by Elsevier B.V. on behalf of the Research Network of Computational and Structural Biotechnology.
Contents 1.
Introduction . . . . . . . . . . . . . . . . . . . . . . . . . . . . . . . . . . . . . . . . . . . . . . . . . . . . . . . . . . . . . . 1.1. Experimental and computational approaches for the quantitative analysis of proteomic alterations . . . . . . . . . . . . . . . . . . 1.1.1. Experimental approaches for quantitative proteomics . . . . . . . . . . . . . . . . . . . . . . . . . . . . . . . . . . . . 1.1.2. Computational approaches for quantitative proteomics . . . . . . . . . . . . . . . . . . . . . . . . . . . . . . . . . . . 1.2. How to derive biological insights from proteomic data . . . . . . . . . . . . . . . . . . . . . . . . . . . . . . . . . . . . . . . . 1.2.1. Deriving insights protein-by-protein . . . . . . . . . . . . . . . . . . . . . . . . . . . . . . . . . . . . . . . . . . . . 1.2.2. Deriving insights through functional modules . . . . . . . . . . . . . . . . . . . . . . . . . . . . . . . . . . . . . . . . 1.2.3. Deriving insights through network analyses . . . . . . . . . . . . . . . . . . . . . . . . . . . . . . . . . . . . . . . . 1.2.4. Deriving insights through data integration . . . . . . . . . . . . . . . . . . . . . . . . . . . . . . . . . . . . . . . . . 1.3. Applying proteomics for systems toxicology . . . . . . . . . . . . . . . . . . . . . . . . . . . . . . . . . . . . . . . . . . . . . 1.3.1. Proteomics in the EU framework 6 project . . . . . . . . . . . . . . . . . . . . . . . . . . . . . . . . . . . . . . . . . 1.3.2. Proteomics for liver toxicity determinations . . . . . . . . . . . . . . . . . . . . . . . . . . . . . . . . . . . . . . . . 1.3.3. Proteomics in pulmonary toxicology: 90-day rat inhalation study to assess the effects of cigarette smoke exposure on the lung proteome 1.3.4. Phosphoproteomics for toxicological assessment . . . . . . . . . . . . . . . . . . . . . . . . . . . . . . . . . . . . . . 1.4. General discussion and future prospects . . . . . . . . . . . . . . . . . . . . . . . . . . . . . . . . . . . . . . . . . . . . . . 1.4.1. The future of systems toxicology . . . . . . . . . . . . . . . . . . . . . . . . . . . . . . . . . . . . . . . . . . . . . . 1.4.2. The future of proteomics in systems toxicology . . . . . . . . . . . . . . . . . . . . . . . . . . . . . . . . . . . . . . . 2. Conclusions . . . . . . . . . . . . . . . . . . . . . . . . . . . . . . . . . . . . . . . . . . . . . . . . . . . . . . . . . . . . . . . References . . . . . . . . . . . . . . . . . . . . . . . . . . . . . . . . . . . . . . . . . . . . . . . . . . . . . . . . . . . . . . . . . .
⁎ Corresponding author. E-mail address:
[email protected] (B. Titz). 1 Contributed equally.
http://dx.doi.org/10.1016/j.csbj.2014.08.004 2001-0370/© 2014 Titz et al. Published by Elsevier B.V. on behalf of the Research Network of Computational and Structural Biotechnology.
74 74 74 76 78 78 78 80 81 83 83 83 83 86 86 86 86 87 87
74
B. Titz et al. / Computational and Structural Biotechnology Journal 11 (2014) 73–90
1. Introduction Conventional toxicological assessment of chemical substances relies heavily on in vitro assays and animal studies to test and identify exposure doses at which relevant apical endpoints are adversely affected. These apical endpoints measure major effects on animal physiology including gross developmental defects or reduction of body weight. Based on these results, recommendations for human exposure limits are derived. Although this conventional toxicological approach has clearly proven its value, more recent discussions on the future requirements for toxicological assessment have highlighted some of its shortcomings and emphasized the need to further evolve toxicology assessment with new tools and approaches (e.g., through the Tox21 and EPA ToxCast™ initiatives) [1,2]. The challenges faced by the current toxicological assessment approach include the recent explosive growth of required tests (e.g., for approximately 300 new chemicals per year in the U.S. alone), the need for new endpoints such as endocrine modulation, and the need to evaluate the effect of chemical mixtures [1]. Most important, however, is the urgent need for deeper insights into toxicological mechanisms as the basis for improved toxicity predictions for different human exposure scenarios. An important challenge in this endeavor is the selection of the right assay systems to conduct predictive studies. While we are witnessing the development of in vitro systems of increasing relevance and complexity, they can still not fully replace animal studies. This is a second reason to focus our attention on mechanistic understanding of toxicity as this opens two routes for developing more predictive assessment tools. First, mechanistic understanding allows for the identification of key events which can be replicated as discrete assays in vitro. Second, mechanistic understanding allows identifying which portion of animal biology translates to human biology and is thus adequate for toxicology testing. Related to this is the notion that the quantitative analysis of a discrete number of toxicological pathways that are causally linked to the apical endpoints could improve predictions (Pathways of Toxicity, POT) [3]. These concepts were recently summarized in a systems toxicology framework [4] where the systems biology approach with its large-scale measurements and computational modeling approaches is combined with the requirements of toxicological studies. Specifically, this integrative approach relies on extensive measurements of exposure effects at the molecular level (e.g., proteins and RNAs), at different levels of biological complexity (e.g., cells, tissues, animals), and across species (e.g., human, rat, mouse). These measurements are subsequently integrated and analyzed computationally to understand the causal chain of molecular events that leads from toxin exposure to an adverse outcome and to facilitate reliable predictive modeling of these effects. Importantly, to capture the full complexity of toxicological responses, systems toxicology relies heavily on the integration of different data modalities to measure changes at different biological levels—ranging from changes in mRNAs (transcriptomics) to changes in proteins and protein states (proteomics) to changes in phenotypes (phenomics). Owing to the availability of well-established measurement methods, transcriptomics is often the first choice for systems-level investigations. However, protein changes can be considered to be closer to the relevant functional impact of a studied stimulus. Although mRNA and protein expression are tightly linked through translation, their correlation is limited, and mRNA transcript levels only explain about 50% of the variation of protein levels [5]. This is because of the additional levels of protein regulation including their rate of translation and degradation. Moreover, the regulation of protein activity does not stop at its expression level but is often further controlled through posttranslational modification such as phosphorylation; examples for the relevance of post-transcriptional regulation for toxicological responses include: the tight regulation of p53 and hypoxia-inducible factor (HIF) protein-levels and their rapid post-transcriptional stabilization, e.g., upon DNA damage and hypoxic conditions [6,7]; the regulation of several cellular stress responses (e.g., oxidative stress) at the level of protein translation [8]; and the
extensive regulation of cellular stress response programs through protein phosphorylation cascades [9–11]. This review is intended as a practical, high-level overview on the analysis of proteomic data with a special emphasis on systems toxicology applications. It provides a general overview of possible analysis approaches and lessons that can be learned. We start with a background on the experimental aspect of proteomics and introduce common computational analyses approaches. We then present several examples of the application of proteomics for systems toxicology, including lung proteomics results from a subchronic 90-day inhalation toxicity study with mainstream smoke from the reference research cigarette 3R4F. Finally, we provide an outlook and discuss future challenges. 1.1. Experimental and computational approaches for the quantitative analysis of proteomic alterations 1.1.1. Experimental approaches for quantitative proteomics 1.1.1.1. Gel-based liquid chromatography mass spectrometry (LC MS/MS) approaches. Two-dimensional polyacrylamide gel electrophoresis (2DGE) is used to assess perturbations on the proteome based on changes in protein expression (Fig. 1A). The 2DGE workflow relies on the separation of proteins based on their pH (charge) as well as their size and has the capability to separate and visualize up to 2000 proteins in one gel. The first dimension, which is known as isoelectric focusing (IEF) separates the proteins by their isoelectric point (pI), i.e. the pH at which they exhibit a neutral charge. The second dimension further separates the proteins by their mass. State-of-the-art image acquisition and analysis software such as SamSpots (TotalLab) allow the simultaneous comparison of control and treated samples to identify the differentially regulated proteins by their relative intensity in a label-free approach. A variant of 2DGE is difference gel electrophoresis (DIGE) which is based on labeling of proteins with fluorescent cyanine dyes (Cy2, Cy3 and Cy5) of different samples resulting from e.g. different treatments. The characteristics of these dyes allow for the analysis of up to three pools of protein samples simultaneously on a single 2D gel to detect differential variances in proteins between samples [12]. The most challenging aspect of this approach has been the development of algorithms that can address gel distortion (warping). Investigators now account for gel warping by running several gels per sample and analyzing gels by principal component analysis to determine which should be excluded from further analysis [12]. Although 2DGE is a powerful tool to identify many proteins using well-established protocols and detection of posttranslational modifications (PTMs) in proteins, the approach has its limitations. The major limitation is that not all proteins can be separated by IEF, such as membrane, basic, small (b 10 kDa) and large (N100 kDa) proteins. Hence, they cannot be detected by 2DGE and require a separate approach based on membrane protein purification protocols and one-dimensional gel electrophoresis. The second limitation is that less abundant proteins are often masked by the abundant proteins in the mixture [13,14]. 1.1.1.2. Gel-free liquid chromatography mass spectrometry (LC MS/MS) approaches. Protein fractionation is crucial to simplify mixtures before analysis by mass spectrometry (MS). Liquid chromatography (LC) is the most commonly used method for protein fractionations in this context (Fig. 1A). The LC approach takes advantage of differences in the physiochemical properties of proteins and peptides, i.e., size, charge, and hydrophobicity. 2D-LC can be used to fractionate protein mixtures on two columns with different physiochemical properties and thereby maximize the separation of proteins and peptides in complex mixtures [15]. Mass spectrometry is widely considered to be the central technology platform for toxicoproteomics. MS has brought many advantages to the advancement of toxicoproteomics including unsurpassed sensitivity, improved speed and the ability to produce high throughput datasets. Owing to the high accuracy of MS, peptides in the femtomolar (10−15)
B. Titz et al. / Computational and Structural Biotechnology Journal 11 (2014) 73–90
75
Gel-based Workflow
A
In-gel digestion
2DGE Image
Data Analysis and Bioinformatics
MS Analysis
Protein Mixture
In-solution digestion
Gel-free LC MS/MS Workflow
B
PRM and SRM Targeted Approaches
SRM
Q1
q2
Q3
3
1
4 2
PRM
Q1
q2
Orbitrap 1 2
C
5
3 4
5
Phosphorylation Enrichment Workflow Cell Line/Tissue/Biological Match
Protein Extract Trypsin Digestion
Tryptic Tryptic Peptides Peptides Enrichment using TiO2 resin
Enriched phosphopeptides
Analysis using LC-MS/MS
Fig. 1. Experimental methods for analysis of proteomic alterations. (A) Gel-based and gel-free proteomics workflows. (B) Methods for targeted mass spectrometry analysis. Selected reaction monitoring (SRM) commonly relies on a triple-quadruple mass spectrometry-instrument. Specific peptide/fragment mass pairs (transitions) are selected and generated with quadrupole mass filters (Q1–Q3). During a targeted experiment the mass-spectrometer can cycle though several transitions to allow for multiplexing. Parallel reaction monitoring (PRM) is a related technology, which relies on a high resolution fragment mass-analyzer such as an Orbitrap rather than a quadruple. With this, all fragment ions of the selected peptides can be identified and quantified in parallel. (C) Mass spectrometry-based phospho-profiling workflow.
to attomolar (10−18) range can be detected in tissues and biological matrices with an accuracy level of less than 10 ppm [16]. This is greatly beneficial in comparative analysis where simultaneous comparisons between control and treated samples are a key to increasing understanding
of how stimuli affect the proteome and the subsequent identification of potential biomarkers [15]. The two approaches that are widely used for differential protein quantification are label-free and label-based quantitation. In the label-
76
B. Titz et al. / Computational and Structural Biotechnology Journal 11 (2014) 73–90
free approach, proteins or peptides of each sample are separated by LC and subsequently analyzed by MS. The main advantages of this approach are: 1) comparison of multiple samples is possible (no restriction in sample number), 2) it covers a broad dynamic range of concentrations, and 3) no further sample treatment is required. This approach is, however, error-prone and requires long analysis time and large computational power to perform the data analysis. In the label-based approach, samples are modified prior to analysis. One of the most common label-based techniques is the use of isobaric tags with the iTRAQ or TMT method. The main advantages of isobaric-tag based quantification are: 1) simultaneous comparison of large numbers of samples (up to eight for iTRAQ, up to ten for TMT) 2) reduction of required MS runs (reduction of analysis time) as samples are pooled before MS analysis, and 3) low probability of introducing experimental errors during analysis due to pooling. The limitations of the technique are the limited dynamic range and the fact that the protein profiles must be similar [17]. In summary, the major advantages of the gel-free approaches are: 1) lower sample volumes can be analyzed, 2) less abundant proteins can be detected, 3) high-throughput sample analysis and data generation are possible, and 4) different classes of the proteins can be analyzed.
important to the biochemical understanding of the PTM pathways and to provide deeper insights into the possible regulation of the cellular physiology induced by PTM. Examples of PTMs include phosphorylation, glycosylation, ubiquitination, nitrosylation, methylation, acetylation, lipidation and proteolysis [22]. During the past decade, MS-based proteomics has demonstrated that it is a powerful technique for the identification and mapping of PTMs that replaces the traditional biochemical techniques such as Western blots, using radioactive isotope-labeled substrates and protein microarrays. The MS-based approaches took great advantage from the advancement in MS instrumentation that allow for higher sensitivity, accuracy and resolution for the detection of less abundant proteins. For the scope of this review, only 2 PTMs will be discussed, which are the most commonly studied in disease research.
1.1.1.3. Targeted mass spectrometry (LC MS/MS) approaches. Because system biology requires accurate quantification of a specified set of peptides/proteins across multiple samples, targeted approaches have been developed for biomarker quantification (Fig. 1B). Selected reaction monitoring (SRM) was developed to reliably deliver precise quantitative data for defined sets of proteins, across multiple samples using the unique properties of MS. SRM measures peptides produced by the enzymatic digestion of the proteome as surrogates to their corresponding proteins in triple quadrupole MS. An SRM-based proteomic experiment workflow begins with the selection of a list of target proteins, derived from previous experimental datasets and/or prior knowledge such as a pathway map or literature. This step is followed by: 1) selection of the proteotypic target peptides (at least two) that optimally and uniquely represent the protein target (e.g., using the SRMAtlas [18]), 2) selection of a set of suitable SRM transitions for each target peptide, 3) detection of the selected peptide transitions in a sample, 4) optimization of SRM assay parameters if some of the transitions cannot be detected, and 5) application of the assays to the detection and quantification of the proteins/peptides [19]. The major advantages of the SRM technique are: 1) multiplexing of tens to hundreds of proteins that can be monitored during the same run, 2) absolute and relative quantification is possible, 3) the method is highly reproducible, and 4) the method yields absolute molecular specificity. The limitations of this technique include: 1) only a limited number of measurable proteins can be included in the same run (the system cannot monitor thousands of proteins per run or analysis) and 2) even with its high sensitivity it cannot reach all the proteins present in an organism (limit of detection is at the attomolar level) [20]. A new MS-based targeted approach called parallel reaction monitoring (PRM) has been developed that is centered on the use of nextgeneration, quadrupole-equipped high-resolution and accurate mass instruments (mainly the Orbitrap MS system) (Fig. 1B). This approach is closely related to SRM, but allows for the measurement of all fragmentation products of a given peptide in parallel. The major advantages over SRM are: 1) the generated data can be easily interpreted, and the analysis can be automated, 2) higher dynamic range, and 3) quantitative information can be determined from datasets of complex samples resulting in extraction of high-quality data [21].
1. Analysis of phosphorylation changes Phosphorylation represents an important posttranslational modification of proteins; in eukaryotes, approximately 30% of cellular proteins contain covalently bound phosphate. It is involved in most cellular events in which the complex interplay between protein kinases and phosphatases strictly controls biological processes such as proliferation, differentiation, and apoptosis. Phosphorylation is a key mode of signal transduction, a central mechanism in the modulation of protein function that is capable of regulating almost all aspects of cell life. Defective or altered signaling pathways often result in abnormalities leading to various diseases including cancer [23,24], emphasizing the importance of understanding protein phosphorylation. The importance of protein phosphorylation is illustrated by the hundreds of protein kinases and phosphatases present in eukaryotic genomes [25]. 2DGE was commonly used for assessing wide-scale changes in phosphorylation. However, because of the many limitations of the approach, MS approaches were developed as an alternative to 2DGE to overcome the limitations and increase the sensitivity of the detection of phospho-proteins. Today, most phospho-proteomic studies are conducted by MS strategies in combination with phospho-specific enrichment (Fig. 1C). Because of sensitivity issues phospho-peptides need to be separated from non-phosphorylated peptides before analysis. A commonly used phospho-peptide enrichment strategy is using TiO2, which is highly selective for phospho-peptides. It is extremely tolerant toward most buffers and salts, and thus is a robust method for the enrichment of phospho-peptides. The enriched peptides are then analyzed using MS for identification and phosphorylation site determinations [26]. 2. Analysis of ubiquitylation changes Modification of proteins by ubiquitylation is a reversible regulatory mechanism that is well conserved in eukaryotic organisms. The role of ubiquitylation is extensively studied in the ubiquitin proteasome system (UPS) as well as in cellular process such as DNA damage repair, DNA replication, cell surface receptor endocytosis, and innate immune system [27–29]. The clinical use of the proteasome inhibitor bortezomib, and the ongoing clinical trials of several other inhibitors illustrate the importance of ubiquitylation for human health [30,31]. The experimental procedure is similar to the phospho-proteomics approach (Fig. 1C). The major difference is that for the enrichment step di-Gly-lysine-specific antibodies are used [32]. Direct immunoenrichment of ubiquitylated peptides, together with high resolution LC MS/MS allows for the in-depth analysis of putative ubiquitylation sites.
1.1.1.4. Posttranslational modifications. Posttranslational modifications (PTMs) represents an important mechanism for diversifying and regulating the cellular proteome. PTMs are chemical modifications that play a role in functional proteomics, by regulating activity, localization and interactions with other cellular biomolecules. The identification and characterization of protein substrates and their PTM sites are very
1.1.2. Computational approaches for quantitative proteomics Following the acquisition of the mass spectrometry data, the first goal of a quantitative proteomics experiment is to derive a protein expression matrix (proteins vs. samples) and identify differentially expressed proteins between selected sample groups. The path to achieve this goal can be divided into three steps: 1) peptide/protein
B. Titz et al. / Computational and Structural Biotechnology Journal 11 (2014) 73–90
identification, 2) peptide/protein quantification, and 3) identification of differentially expressed proteins. 1.1.2.1. Software for processing mass spectrometry data. Several software packages support these tasks including the freely available TransProteomic Pipeline [33], the CPAS system [34], the OpenMS framework [35], and MaxQuant [36] (Table 1). Each of these packages has their advantages and shortcomings, and a detailed discussion goes beyond the scope of this review. For example, MaxQuant is limited to data files from a specific MS manufacturer (raw files, Thermo Scientific), whereas the other software solutions work directly or after conversion with data from all manufacturers. An important consideration is also how well the employed quantification approach is supported by the software (for example, see Nahnsen et al. for label-free quantification software [37] and Leemer et al. for both label-free and label-based quantification tools [38]). Another important consideration is the adaptability of the selected software because processing approaches of proteomic datasets are still rapidly evolving (see examples below). While most of these software packages require the user to rely on the implemented functionality, OpenMS is different. It offers a modular approach that allows for the creation of personal processing workflows and processing modules thanks to its python scripting language interface, and can be integrated with other data processing modules within the KNIME data analysis system [39,40]. In addition, the open-source R statistical environment is very well suited for the creation of custom data processing solutions [41]. 1.1.2.2. Identification of peptides and proteins. The first step for the analysis of a proteomic MS dataset is the identification of peptides and proteins. Three general approaches exist: 1) matching of measured to theoretical peptide fragmentation spectra, 2) matching to pre-existing spectral libraries, and 3) de novo peptide sequencing. The first approach is the most commonly used. For this, a relevant protein database is selected (e.g., all predicted human proteins based on the genome sequence), the proteins are digested in silico using the cleavage specificity of the protease used during the actual sample digestion step (e.g., trypsin), and for each computationally derived peptide, a theoretic MS2 fragmentation spectrum is calculated. Taking the measured (MS1) precursor mass into account, each measured spectrum in the datasets is then compared with the theoretical spectra of the proteome, and the best match is identified. The most commonly used tools for this step include Sequest [42], Mascot [43], X!Tandem [44], and OMSSA [45]. The identified spectrum to peptide matches provided by these tools are associated with scores that reflect the match quality (e.g., a crosscorrelation score [46]), which do not necessarily have an absolute meaning. Thus, it is critically important to convert these scores into probability p-values. After multiple testing correction, these probabilities are then used to control for the false discovery rate (FDR) of the identifications (often at the 1% or 5% level). For this statistical assessment, a commonly used approach is to compare the obtained identification scores for the actual analysis with results obtained for a randomized (decoy) protein database [47]. For example, this approach is taken by Percolator [48,49] combined with machine learning to best separate true from false hits based on the scores of the search algorithm. Although the estimation of false-discovery rates is generally well established for peptide identification [50], protein FDR estimates are less mature [51,52] and constantly evolving (e.g., [53,54]). Another question is how the results from different search engines can be effectively combined toward higher sensitivity, while maintaining the specificity of the identifications (e.g., [51,55]). The second group of algorithms, spectral library matching (e.g., using the SpectralST algorithm), relies on the availability of high-quality spectrum libraries for the biological system of interest [56–58]. Here, the identified spectra are directly matched to the spectra in these libraries, which allows for a high processing speed and improved identification sensitivity, especially for lower-quality spectra [59]. The major limitation of spectralibrary matching is that it is limited by the spectra in the library.
77
The third identification approach, de novo sequencing [60], does not use any predefined spectrum library but makes direct use of the MS2 peak pattern to derive partial peptide sequences [61,62]. For example, the PEAKS software was developed around the idea of de novo sequencing [63] and has generated more spectrum matches at the same FDRcutoff level than the classical Mascot and Sequest algorithms [64]. Eventually an integrated search approaches that combine these three different methods could be beneficial [51]. 1.1.2.3. Quantification of mass spectrometry data. Following peptide/ protein identification, quantification of the MS data is the next step. As seen above, we can select from several quantification approaches (either label-dependent or label-free), which pose both method-specific and generic challenges for computational analysis. Here, we will only highlight some of these challenges. Data analysis of quantitative proteomic data is still rapidly evolving, which is an important fact to keep in mind when using standard processing software or deriving personal processing workflows. An important general consideration is which normalization method to use [65]. For example, Callister et al. and Kultima et al. compared several normalization methods for label-free quantification and identified intensity-dependent linear regression normalization as a generally good option [66,67]. However, the optimal normalization method is dataset specific, and a tool called Normalizer for the rapid evaluation of normalization methods has been published recently [68]. Computational considerations specific to quantification with isobaric tags (iTRAQ, TMT) include the question how to cope with the ratio compression effect and whether to use a common reference mix. The term ratio compression refers to the observation that protein expression ratios measured by isobaric approaches are generally lower than expected. This effect has been explained by the co-isolation of other labeled peptide ions with similar parental mass for the MS2 fragmentation and reporter ion quantification step. Because these co-isolated peptides tend to be not differentially regulated, they generate a common reporter ion background signal that decreases the ratios calculated for any pair of reporter ions. Approaches to cope with this phenomenon computationally include filtering out spectra with a high percentage of co-isolated peptides (e.g., above 30%) [69] or an approach that attempts to directly correct for the measured co-isolation percentage [70]. The inclusion of a common reference sample is a standard procedure for isobaric-tag quantification. The central idea is to express all measured values as ratios to the common reference sample to cancel out differences in ionization efficiencies and between sample runs. However, recently it has been demonstrated that this reliance on a single sample can increase the overall variance and that alternatively, it is beneficial to use the median of all measured reporter ions for spectrum normalization [71]. Importantly, when applying this approach to diverse sample sets (e.g., human patient samples) the comparability of these median values need to be ensured. Similarly, other quantification methods come with their own challenges, e.g., label-free approaches based on peak integration are dependent on a reliable run-to-run alignment and consistent integrations (e.g., [72,73]). 1.1.2.4. Identification of differentially expressed proteins. The results of these efforts are a protein-by-sample expression matrix, and the next analysis step often aims to identify differentially expressed proteins. Here, important considerations involve the selection of the proteinlevel statistics for differential abundance and how multiple hypothesis testing is taken into account. For example, Ting et al. tested a fold change approach, Student's t-test, and empirical Bayes moderated t-test as the protein-level statistics [74]. The authors also used the common approach in RNA microarray experiments to construct linear models that captured the relevant experimental factors. They concluded that applying the empirical Bayes moderated t-test in the linear model framework resulted in a high-quality list of statistically significant differentially abundant proteins. A summary of the essential multiple hypothesis correction methods to control the FDR is given in [75]. Of these, the most commonly used method is likely the Benjamini–Hochberg approach [76].
78
B. Titz et al. / Computational and Structural Biotechnology Journal 11 (2014) 73–90
1.1.2.5. Comparison of methods. As we have observed, many software and processing options are available for the analysis of MS data. As argued by Yates et al., it is vital to define benchmarking standards and more extensively compare the available tools [77] to allow for an evidencebased selection of the available software tools. A few comparative studies for quantitative proteomics are already available. For example, Altelaar et al. compared SILAC, dimethyl and (isobaric tag) TMT labeling strategies and found that all methods reach a similar analysis depth; TMT resulted in the highest ratio of quantified-to-identified proteins and the highest measurement precision, but ratios were most affected by ratio compression [78]. Similarly, Li et al. compared label-free (spectral counting), metabolic labeling (14N/15N), and isobaric tag labeling (TMT and iTRAQ) and found the isobaric tag-based approaches to be the most precise and reproducible [79]. 1.1.2.6. Computational resources for data processing. All steps of proteomics computational analysis, including protein identification, protein quantification and identification of differentially expressed proteins, require an access to high performance computational resources [80]. Software tools that match peptide masses to genome-based protein databases or spectra to spectral libraries directly can often be run in a parallelized mode to accelerate the data analysis. Classical parallelization solutions such as computing clusters are widely used and more cutting edge implementations such as cloud computing [81] or graphics processing unit (GPU) servers [82] are on the rise. The latter work demonstrated acceleration of the peptide searches within proteome database up to 60-fold compared to conventional CPU-based architecture and reflects a recent trend of using GPU-based clusters in computational systems biology. After generation of a reliable quantitative proteomic dataset, the main challenge is to turn the data into biological knowledge. In the next section, we focus on four categories of computational approaches (protein-by-protein, functional module-based, biological networkbased, and through data integration), which taken together support a comprehensive biological interpretation of the results (Fig. 2). 1.2. How to derive biological insights from proteomic data 1.2.1. Deriving insights protein-by-protein In many cases, the first result obtained when analyzing a quantitative proteomics dataset is a list of differentially expressed proteins in the condition of interest. Initially, these proteins are often only sparsely annotated, and expansion of this annotation is a helpful first step for biological interpretation and filtering. Protein annotations can be directly derived from databases (e.g., UniProtKB) or dynamically generated for a specific biological question through text-mining approaches. 1.2.1.1. Protein databases. The UniProt Knowledgebase (UniProtKB) is the central resource for protein-centric information [83]. It consists of a high-quality, manually reviewed section (UniProtKB/Swiss-Prot) and an automatically generated, unreviewed section (UniProtKB/TrEMBL). The available data include protein functions, catalytic activity, pathway information, and associated phenotypes and diseases. UniProt facilitates the annotation of protein lists through its own ID mapping service, batch retrieval tools, and by supporting more extensive and automated queries through BioMart [84]. For human proteins, UniProt is extended by the neXtProt knowledgebase, which is still under development [85], which provides an extended view of the proteins by incorporating additional data sources such as high-throughput protein expression and protein localization experiments. Although these databases offer extensive coverage of overall protein function, the functional information for specific protein modifications is sparse. Thus, more dedicated databases are advantageous when analyzing proteomic datasets of posttranslational modifications such as phosphorylation. For example, the PhosphoSite database offers extensive annotations of phosphorylation sites for human, mouse, and rat [86], and NetPhorest allows for predictions of
potential upstream kinases [87]. In addition, for toxicological assessments it can be revealing to investigate the links between the identified proteins and chemicals and chemical toxins. The STITCH database is an extensive database of protein–chemical interactions and provides convenient data access through downloadable files and an application programming interface [88]. The toxin and toxin target database (T3DB) is specifically focused on mechanisms of toxicity and targets and currently contains information for approximately 3000 toxins [89]. 1.2.1.2. Text-mining approaches. The annotations derived from these sources depend on the specific scope and curation depth of these databases. To associate the identified protein list with the most up-to-date information and with specific biology/disease concepts (e.g., the disease under investigation), text-mining approaches are worth considering [90,91]. The iHOP database provides a precomputed network of protein–protein and protein-concept interactions, and is derived through automated text mining of the scientific literature [92]. Its main strength is to comprehensively and concisely collect up-to-date information on a given protein. However, it does not allow querying specific concepts and biological contexts. This is supported by specific text-mining tools such as EBIMed [93], SciMiner [94], and PolySearch [95]. EBIMed and SciMiner accept free literature queries as the input and automatically identify and associate the proteins, functions, and drugs reported in the identified literature. PolySearch more specifically handles associative queries such as “given a disease/protein/drug, find all associated diseases/proteins/drugs”. For example, PolySearch was used to support the identification and annotation of toxin-target relationships in the T3DB [89]. All three tools are especially useful when evaluating the discovered differentially regulated proteins in the context of what is already known about the process under study. 1.2.2. Deriving insights through functional modules Although these protein-level annotations support the manual systematic interpretation of a dataset, they do not allow for a direct statistical assessment of the affected biological functions. Given a list of differentially expressed proteins, we often ask, “What are the functional categories/modules/pathways that are significantly enriched for differentially expressed proteins?” The basis for these analyses is the modular organization and regulation of biological systems [96–98]. For example, upon a certain cellular stress such as oxidative stress, we can expect to observe the coordinated up-regulation of a specific stress response protein module or the activation of a particular signaling pathway [99]. Three main components are needed to identify functional modules that are significantly enriched for affected proteins: 1) a metric to score the level of perturbation for each protein (protein-level statistic), 2) a database of relevant protein modules/sets, and 3) an algorithm to score and evaluate the statistical significance of the module enrichment (module-level statistic). 1.2.2.1. Protein-level statistics. Threshold-based approaches can, for example, be based on a multiple testing corrected t-test p-value (see above). Threshold-free approaches rely on continuous protein-level statistics such as the fold-change, a t-score, or the signal-to-noise ratio. An important consideration for the selection of the protein-level statistics is, whether up- and down-regulation of module components are considered together or as distinct effects [100]. 1.2.2.2. Gene/protein set databases. Several functional module (gene/ protein set) databases are available. The most prominent is the mSigDB database from the Broad Institute [101]. Here, the functional sets are grouped in different categories that range from canonical pathways (e.g., the KEGG and Reactome database [102,103]) to gene ontologies [104]. Other functional module databases include GeneSigDB [105], which contains manually extracted signatures/modules from the literature, and PAGED [106], which combines these and other functional module databases. However, depending on the analyzed biological context,
B. Titz et al. / Computational and Structural Biotechnology Journal 11 (2014) 73–90
79
Computational Approaches Quantitative proteomics
Computational analysis Protein-by-protein
Data integration
MS analysis databases
text mining
protein/gene sets
p-values
modules
networks
functions activities pathways expression
TP0658 FliW
interactions domains
data 1 data 2 data 3
Treponema pallidium interact
m/z
MS raw data
Functional modules
module A module B module C
Biological networks
Gene/protein sets database
RT
Activated sub-networks
Known effect of toxin 1
+
Known effect of toxin 2
=
Raw data processing
metabolism
Inflammation
Xenobiotic Oxidative stress
P -t
0
Enrichment map
Enrichment algorithm
Biological network
1 networkihdsp 2 tetworkihdsi 3 oetworkihdsy
Functional context networks
t
Holistic interpretation in context of studied biology
Fig. 2. Workflow for computational analysis of proteomics data. Most crucial is the generation of a high-quality quantitative proteomics dataset (left panel). The generated quantitative proteomics data include the expression matrix and lists of differentially expressed proteins. To derive biological insights from this data, a multitude of analysis approaches can be employed (right panel).
more specialized gene set databases—such as the liver-cancer related database, Liverome [107], or even self-defined databases—can be beneficial. 1.2.2.3. Three classes of enrichment algorithms. Finally, algorithms to evaluate module enrichment are needed. These can be grouped into three categories: 1) over-representation analysis (ORA) approaches, 2) functional class scoring (FCS) approaches, and 3) pathway topology (PT) approaches [108]. ORA approaches depend on a threshold to select a list of differentially expressed proteins for the conditions of interest. Subsequently, the overlap between this protein list and each functional module in the database is calculated and statistically assessed (e.g., using the Fisher exact test and multiple hypothesis correction). The advantages of ORA are simplicity, relatively quick run times, and availability (e.g., through the DAVID Bioinformatics Resources [109] or Enricher tool [110]). Because these methods rely on a fixed threshold, they disregard differences in the extent of differential regulation and do not consider weakly, but consistently regulated proteins/genes. The second class of algorithms are FCS approaches. The most prominent of these methods is the traditional and still commonly used gene set enrichment analysis (GSEA) [111]. Here, the proteins are ranked based on a continuous protein-level metric (such as fold-change or SNR), and the enrichment of the functional modules in the database at the top or the bottom of the ranked list is statistically evaluated.
Beyond the classical assessment of enrichment by the GSEA algorithm, several alternative module-level statistics have been employed (e.g., Kolmogorov–Smirnov statistic, sum, mean, or median, and the maxmean statistic) [108]. The advantages of FCS methodologies are that they do not rely on fixed thresholds and the correlation structure (between genes) can be taken into account by the employed permutationbased significance tests, depending on the null hypothesis under consideration. The third type of approach, PT, goes beyond the FCS approach by taking the actual topology of the pathways/modules into account. For example, the signaling pathway impact analysis (SPIA) combines two types of evidence to assess the perturbation of a signaling pathway: a classical overrepresentation measure and a topology-dependent measure of the abnormal perturbation of the pathway, which takes the actual wiring of the pathway into account. A second PT algorithm, the network perturbation amplitude (NPA) approach scores the activation of a given causal biological network model [112]. Here, the employed causal network models consist of two tiers. The upper tier (backbone) is similar to a classical pathway diagram causally describing a specific biological process (e.g., NF-kB activation). The nodes in this network are causally linked to downstream gene expression nodes in the lower tier. These links describe the causal effect (positive/negative) of a given backbone node on the gene expression of a lower tier node. For the actual calculation of NPA scores, the observed gene expression changes are mapped
80
B. Titz et al. / Computational and Structural Biotechnology Journal 11 (2014) 73–90
onto the lower tier. The topology of the backbone network is then considered together with the direction of the links between the tiers to quantitatively summarize whether the expression changes of the downstream nodes are overall consistent with pathway activation, inactivation, or no change. For example, this approach could closely recapitulate the experimentally measured activation of NF-kB in TNFα-stimulated human bronchial epithelial cells. The increased availability of high-quality, context-specific network models will broaden the applicability of these PT approaches in the future [108]. 1.2.2.4. Application to proteomic data. Although all these methods have been initially devised for gene expression data, proteomic datasets can be analyzed with the same algorithms and functional gene/protein module databases. For example, Gharib et al. used GO-term enrichment to compare the BALF proteomes of human and mice and identified shared (e.g., protease inhibitor activity) and distinct (e.g., antioxidant activity) functional processes [113]; Chin et al. used GSEA to identify proteome alteration in mouse models of Parkinson's disease [114]. 1.2.2.5. Interpretation of results. The main challenge for the interpretation of results from these methods is often the high overlap (and partial redundancy) of the protein modules. Enrichment maps have been presented as a solution to better visualize enriched gene sets/modules and their relationships (Fig. 2, right panel) [115]. Here, the enrichment results are presented as a similarity network, where the nodes represent gene sets, the links the overlap between sets, and the node color encodes the enrichment strength. The usefulness of this approach for the analysis of a proteomic dataset is highlighted by a recent study on dilated cardiomyopathy by Isserlin et al. [116]. In this study, the enrichment maps supported the interpretation of proteomic changes at an early- and mid-stage time point of the cardiomyopathy model and identified a strong up-regulation of apoptosis, proteasome and RNA processing/splicing apparatus at the mid-stage time point. In another example, Meierhofer et al. demonstrated the power of protein set analysis to gain insights into the regulation of cell and tissue homeostasis during high-fat diet feeding and medication with two anti-diabetic compounds [117]. GSEA allowed for more sensitive detection of lowlevel but coordinated protein expression changes, and the functional modules showed a higher correlation than individual genes/proteins when comparing proteomics and transcriptomics data. 1.2.3. Deriving insights through network analyses As discussed in the previous section, the functional categorization of genes/proteins into functional classes is an effective approach to systematically and functionally understand effects in biological systems [118]. An even more holistic viewpoint is taken by network biology approaches [119]. Here, the biological entities (e.g., transcripts, proteins) are viewed as the nodes of complex, interconnected networks. The links between these nodes can represent actual physical associations (e.g., protein– protein interactions) or functional interactions (e.g., proteins involved in the same biological process). For example, network biology approaches can highlight highly perturbed protein subnetworks that warrant further investigation [120]; they help to understand the modular organization of the cell [119], and can be applied for improved diagnostics and therapies [121,122]. 1.2.3.1. Biological network models. Comprehensive and high-quality biological network models are the basis for these analyses. The available resources for network models differ in their scope, quality, and availability. The STRING database is one of the most comprehensive, freely available databases for functional protein–protein links for a broad range of species [123]. It is based on a probabilistic model that scores each link based on its experimental or predicted support from diverse sources such as physical protein interaction databases, text mining, and genomic associations. The Reactome database is a manually curated database with a narrower scope
of human canonical pathways [124]. Recently, however, Reactome data have been supplemented with predicted functional protein associations from several sources including protein–protein interaction databases and co-expression data (Reactome Functional Interaction network) [125]. Several commercial curated network databases exist including KEGG, the Ingenuity® Knowledge Base and MetaCore®. At its core, the KEGG database provides metabolic pathway maps but more recently has added pathways of other biological processes (e.g., signaling pathways) [126]. The Ingenuity® Knowledge Base and MetaCore® are comprehensive resources for expert curated functional links from the literature, and are also often employed for the analysis of proteomic datasets [127–129]. These databases are well suited for generic network analyses. However, currently, their coverage of relevant mechanisms is often insufficient for tissue- and biological context-specific modeling approaches. For this, specific mechanistic network models curated by experts of the specific field of study are required. Very detailed NfKB models are examples that recapitulate complex signaling and drug treatment responses [130]. For systems toxicology applications, we have developed and published a collection of mechanistic network models [131]. These models range from xenobiotic, to oxidative stress, to inflammationrelated, and to cell cycle models [132–135]. The networks are described in the Biological Expression Language (BEL), which enables the development of computable network models based on cause and effect relationships [136]. Ensuring high-quality and independent validation of these network models is especially important when these models are used within a systems toxicology assessment framework. An effective approach that has been used for these networks for systems toxicology makes use of the wisdom of the crowd [137–139]. Here, within the sbv IMPROVER validation process, the derived networks are presented to the crowd on a web platform (bionet.sbvimprover.com), and classical incentives and gamification principles are used to motivate the participants to challenge and improve the presented network models. The results of this challenge are further discussed in a jamboree session with select participants, and finally the improved network models are disseminated for public use. 1.2.3.2. The Cytoscape platform. Although the approaches for possible network analyses can be overwhelming, they are facilitated by the availability of the common network analysis software platform Cytoscape [140]. At its core, Cytoscape allows for import, annotation, visualization, and basic analysis of molecular interaction networks. However, its functionality is expanded by many plugins/apps for extended data visualization, handling, and analysis capabilities. Saito et al. provided a “travel guide” to Cytoscape plugins [141]. Common analysis workflows involve the identification of functional protein networks for differentially expressed proteins or the identification of especially strongly perturbed regions (modules) in biological networks. 1.2.3.3. Functional context networks. To understand the biology altered under a specific condition, it is often helpful to visualize and analyze how the differentially expressed proteins are functionally connected and whether they form specific functional clusters. Several Cytoscape® apps support this integration of protein lists with different functional network resources. The Reactome Functional Interaction (FI) app (Reactome FIs) allows construction of a subnetwork of the extensive Reactome FI network for a given set of genes/proteins [125]. For example, Chen et al. used Reactome FI for data interpretation of an integrative personal omics profile from a single individual over a 14-month period [142]. The Agilent Literature Search plugin generates biological networks for protein lists based on queries of the scientific literature [143]. Outside the Cytoscape environment, the String database directly allows network generation of protein sets and provides basic analysis tools of the generated networks including clustering and functional enrichment analyses. Similar functional network analyses are also a central component of the commercial Ingenuity and MetaCore analysis tools [127–129]. For example, Chang et al. used Ingenuity Pathway
B. Titz et al. / Computational and Structural Biotechnology Journal 11 (2014) 73–90
Analysis (IPA) to identify central network components among protein changed during the course of acute respiratory syndrome [144]. Muller et al. attempted to compare how good IPA and the String database are at recovering well known pathways such as Wnt and insulin signaling [145]. Using manually defined protein input lists, both tools performed equally well, but it should be noted that only well studied and single pathways were tested, which does not necessarily reflect a real-life complex biological response. 1.2.3.4. Activated sub-networks. These functional context network approaches can be referred to as bottom-up strategies to construct networks for protein lists. Another set of approaches employs top-down strategies. These approaches start with the entire biological network and aim at identifying network regions (sub graphs) with a significant enrichment of differentially expressed proteins. The benefit of these methods is that they do not necessarily rely on strict cutoffs (e.g., of p-values) for the definition of protein lists; they can take more of the global topology of the network into account and be more globally evaluated for statistical significance. The first such algorithm, which is still in common use and available as a Cytoscape plugin (jActiveModules), was published by Ideker et al. [120]. Here, p-values for differentially expressed genes/proteins are transformed into z-scores, and these are integrated into a subnetwork score. Then a simulated annealing algorithm is applied to identify high-scoring subnetworks. In the original publication, this allowed identification of several high scoring subnetworks with good correspondence to known regulatory mechanisms in yeast. In a more recent example, this algorithm has been applied to identify activated subnetworks upon early life exposure to mitochondrial genotoxicants [146]. Chuang et al. extended this approach by defining sample-wide subnetwork activity values, which are compared across sample classes to derive a discriminative potential for the subnetwork [147]. Subnetworks that maximize this measure are identified with a greedy search and their significance assessed based on permutated subnetworks. Strikingly, these subnetworks were more predictive for the classification of the metastatic potential of cancer samples than classical individual gene markers. Owing to the heuristic search component of these algorithms, finding the optimal solution is not guaranteed. In contrast, the algorithm by Dittrich et al. uses an integer linear programming approach to identify subnetworks with optimal scores (available through the BioNet package for the R statistical environment) [148,149]. More recent approaches include an approach optimized for large-scale weighted networks (available as a Cytoscape plugin, GeNA) [150], a Markov random field-based method [151], the Walktrap random walk-based algorithm [152], and the DEGAS method. Finally, NetWeAvers is a recently developed algorithm specifically for the analysis of differentially regulated proteins in a network context [153]. As for the other discussed methods, although primary method publications commonly report a limited comparison between the new and established methods, more systematic and independent comparisons are often lacking. With this, it is difficult to select the best method for a certain analysis task, and we recommend evaluating a few of these methods against case-specific performance metrics. 1.2.4. Deriving insights through data integration Even the most comprehensive omics dataset represents only one viewpoint of the complex biology under study. Integration of different datasets and data modalities (e.g., transcriptomics and proteomics data) can yield a more comprehensive picture and build up confidence in the obtained results. 1.2.4.1. Data repositories. One basic question is how to obtain data to integrate. Data repositories and integration approaches are much more evolved for transcriptomics than proteomics data. Published transcriptomics data are routinely deposited into the GEO repository of the NCBI [154] or the ArrayExpress database of the EBI [155]. These repositories allow for convenient searches, data download or even basic web-based
81
data analyses of the deposited data. In contrast, data repositories for proteomics data went through a long period of instability, which included the closure of major sites such as NCBI Peptidome and Proteome Commons Tranche [156]. Only recently, the PRIDE database has emerged as the central, commonly supported repository for proteomics data [157]. PRIDE provides a convenient search interface, basic data visualization and analysis capabilities, and allows the user to download MS files for further analyses. However, currently quantitative data are not fully supported by the PRIDE database. This gap is partly filled by the MOPED database [158], which has a smaller scope, but provides access to consistently processed proteomics datasets including absolute and relative quantitation values. 1.2.4.2. Proteomic vs. transcriptomic data. The first integrative studies evaluated the direct correlation of protein and mRNA expression levels within the same experimental system. As expected, owing to the additional levels of regulation acting on proteins, only a limited correlation between transcriptomic and proteomic data was commonly observed [5]. For example, relative steady-state protein and mRNA abundances correlated only partially in three human cell lines (Spearman correlation = 0.63) [159]. Overall, it has been found that regulation of posttranscription, translation, and protein degradation contribute as much to protein variation as the regulation of the transcript level does [160, 161]. In this context, another finding is noteworthy: comparing the conservation of transcript and protein levels across species showed a stronger conservation of protein levels [162,163]. This partial uncoupling of transcript and protein levels further emphasizes the need for an integrative analysis of transcriptomics and proteomics data. Moreover, the stronger conservation of protein levels suggests a higher translatability between species. 1.2.4.3. Integration approaches. Transcriptomics and proteomics data can be integrated at different biological levels ranging from individual molecules (proteins/transcripts) to functional modules to biological networks (Fig. 3, right panel). The most basic, but reasonable first data integration approach is the intersection of differentially expressed gene/ protein lists (e.g., [164,165]). However, p-values of differential expression can also be integrated directly. The advantage of this approach is that consistently, but weakly regulated molecules across datasets can be identified. Traditional approaches for the integration of p-values (or z-scores) are Fisher's [166] and Stouffer's [167] method and Brown's method for the integration of dependent p-values [168]. Integration at the functional module- (pathway-, gene set-) level can reveal similarities that are not apparent at the level of individual biomolecules. For example, Buschow et al. conducted an integrated transcriptomics/proteomics analysis to study the activation of dendritic cells (DC). While only limited correlation at the level of individual transcripts and proteins was observed, the correlation for relevant DC activation pathways was significantly higher [165]. Kaever et al. presented a general framework for the meta analysis of p-values obtained from pathway enrichment analyses for transcriptomics and metabolomics data [169]. Moreover, data can be integrated at the biological network level. For example, Nibbe et al. used a proteomics-first approach to integrate proteomics and transcriptomics data for the identification of functional subnetworks in colorectal cancer (CRC) [170]. First, candidate subnetworks were identified by mapping differentially expressed proteins in CRC samples onto a human protein interaction network. Subsequently, independent transcriptomics datasets were employed to identify those (proteomics-defined) subnetworks that were significantly associated with the tumor/normal classification. Finally, different integration approaches can be combined. For example, Balbin et al. generated transcriptomics, proteomics, and phosphoproteomics profiles for KRAS-mutated non-small cell lung cancer cell lines [171]. These three data sources were first integrated using an approach based on Stouffer's method. Subsequently, a network-based approach was used to identify a novel targetable subnetwork in KRASdependent CRC cell lines centered on LCK kinase.
82
B. Titz et al. / Computational and Structural Biotechnology Journal 11 (2014) 73–90
A lung tissue fresh air 3R4F, low 3R4F high
0 days
90 days
exposure
B
90 days low high
90+42 days
quantitative proteomics
recovery
C
90 + 42 days low high 3R4F conc.
90 days
90 + 42 days
low high
low high
3R4F conc.
Sod2: Superoxide dismutase 2
GSEA: perturbed gene/protein sets
Ctsd: Cathepsin D
signed -log10 (adj. p-value)
Chia: Acidic mammalian chitinase
D
4 2 0
Oxidative phoshorylation Respiratory electron transport Tumour field effect Mast cell Acute lung injury up Neutrophil granule constituents
signed -log10 (adj. p-value)
differentially expressed proteins
Nqo1: NAD(P)H dehydrogenase 1
-2 -4
0 -2 -4
protein 90 days
unfolded protein response
low
functional protein clusters
metabolism
metabolism oxidative phosphorylation
3R4F vs. fresh air
node colour
fatty acid oxidation
90 + 42 days
high low
90 days
high low
90 + 42 days
high low
high 3R4F conc.
1x
3x
response to oxidative stress xenobiotic metabolism
inflammatory response
unfolded response fatty acid oxidation translation
signed -log10 adj. p-value
xenobiotic metabolism
mRNA
metabolism
translation
response to oxidative stress
2
E
up-regulated by 3R4F, high
inflammatory response
Fatty acid metabolism Myeloid cell development
4
4
2
oxidative phosphorylation
0
−2
−4
0 20 40 60 80 % mRNA up-regulated [q-value < 0.05]
B. Titz et al. / Computational and Structural Biotechnology Journal 11 (2014) 73–90
1.3. Applying proteomics for systems toxicology
83
1.3.1. Proteomics in the EU framework 6 project Suter et al. characterized the effect of 16 test compounds using conventional toxicological parameters in the integrated EU Framework 6 Project: Predictive Toxicology (PredTox) [172]. The project, partly funded by the EU, was performed by a consortium of 15 pharmaceutical companies, 2 private companies, and 3 universities. The three major observed toxicities, liver hypertrophy, bile duct necrosis and/or cholestasis, and kidney proximal tubular damage, were analyzed in detail. The outcome of this program indicates that omics technologies can help toxicologists make better-informed decisions during exploratory toxicological studies. The compounds included 14 proprietary drug candidates from participating companies and 2 reference toxic compounds: gentamicin and troglitazone. Following 2-week exposure in rats, conventional toxicological endpoints were collected, and transcriptomics, proteomics, and metabolomics profiles were evaluated. Most of the proteomics data that were supportive of the mechanistic hypothesis were based on tissue proteomics (2D-DIGE). This technology, despite offering relatively low throughput, provided valuable information that was complementary to other data sources. The authors concluded that the main changes that led to a mechanistic interpretation of the findings were similarly interpreted using different statistical and pathway mapping tools, highlighting the robustness of the outcome. With this, the authors strongly supported the use of these data for confirmation of mechanistic hypotheses and discovery of putative biomarkers as very tangible outcomes of integrated omics analysis.
represent a powerful step forward in using a systems toxicology approach to advance the understanding of the risk factors of idiosyncratic toxic drugs. Overall, as discussed by Van Summeren et al., many studies within the last 5 years have successfully employed proteomic approaches to identify mechanisms and biomarkers of drug-induced hepatotoxicity [174] (see Table. 2). These studies performed proteomic analysis on different subsets of proteins such as whole tissue; cellular fractions, such as mitochondria, endoplasmic reticulum, microsomes, and serum/plasma; and also employed in vitro systems for proteomic analysis. Van Summeren et al. are generally optimistic that proteomic analysis will aid in the description of toxicity mechanisms. Proteomics investigations revealed promising results upon the classification of hepatotoxic compounds and showed opportunities for the identification of protein biomarkers underlying this classification. However, the detection of idiosyncratic hepatotoxicants with the currently available in vitro methods will remain challenging because these reactions are unpredictable and mostly immune mediated. For non-idiosyncratic hepatotoxicants, proteomics can be used to gain insight into the mechanistic processes underlying drug-induced hepatotoxicity. Despite these promising results with a toxicoproteomics approach, the development of a panel of biomarkers will require the testing of several well-characterized model hepatotoxicants. The authors state that by testing classified compounds, common patterns of toxicity can be distinguished from compound-specific mechanisms. Importantly, in their opinion, the value of proteome data can be increased by comparison with data from complementary transcriptomics and metabolomics experiments using a systems biology approach.
1.3.2. Proteomics for liver toxicity determinations Drug-induced liver injury is a leading cause of acute liver failure, thus constituting a major reason for drug candidate failure during development or withdrawal from the market. Because of drug-related toxicity, many drug candidates that may otherwise be potentially efficacious in the treatment of diseases have been discontinued; this represents a major setback to a larger population, which may benefit from further development of these drug candidates. In addition, from the pharmaceutical industry's perspective, the resultant regulatory actions have increased development costs to meet acceptable safety requirements. Troglitazone, a once-marketed first-generation thiazolidinedione used for the treatment of type-II diabetes mellitus, was withdrawn from the market owing to unacceptable idiosyncratic hepatotoxicity risks even though troglitazone did not cause hepatotoxicity in normal healthy rodents and monkeys in preclinical drug safety assessments and long-term studies. To understand idiosyncratic hepatotoxicity mechanistically, Lee et al. used MS-based proteomics to characterize mitochondrial protein changes to track the involvement of specific mitochondrial proteins in troglitazone-induced hepatotoxicity in a mouse model [173]. By combining high-throughput MS-based mitoproteome-wide profiling, biochemical endpoints, and network biology, the authors demonstrated that the hepatic mitochondrial proteome followed a two-phase response to repeated troglitazone administration that culminated in liver injuries by the fourth week. This integrative approach identified the combined deterioration of key fragile nodes and a dysfunctional mitochondrial GSH transport system that lead to the eventual toxicity of troglitazone. They concluded that this approach might
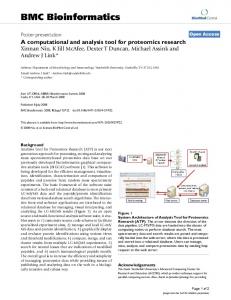
1.3.3. Proteomics in pulmonary toxicology: 90-day rat inhalation study to assess the effects of cigarette smoke exposure on the lung proteome Proteomic analyses are an important component of our overall systems toxicology framework for the assessment of smoke exposure effects. Within our comprehensive assessment framework, both proteomics and transcriptomics analyses complement the more traditional toxicological parameters such as gross pathology and pulmonary histopathology as required by the OECD test guideline 413 (OECD TG 413) for a 90-day subchronic inhalation toxicity study. These systems-level measurements constitute the “OECD plus” part of the study [175] and provide the basis for deeper insights into toxicological mechanisms, which enable the identification of causal links between exposure and observed toxic effects as well as the translation between different test systems and species (see Introduction). Here, we report on the high-level results for the proteomic component of a 90-day rat smoke inhalation study. Sprague Dawley rats were exposed to fresh air or two concentrations of a reference cigarette (3R4F) aerosol [8 μg/L (low) and 23 μg/L (high) nicotine] for 90 days (5 days per week, 6 h per day) (Fig. 3A). This exposure period was followed by a 42-day recovery period with fresh air exposure. Lung tissue was collected and analyzed by quantitative MS using a multiplexed iTRAQ approach (6 animals per group). At the level of individual differentially expressed proteins, the 90-day cigarette exposure clearly induced major alterations in the rat lung proteome compared with fresh air exposure (Fig. 3B). These alterations were significantly attenuated after the 42-day recovery period. The high 3R4F dose showed an overall higher impact and remaining perturbations after the recovery period than the
Fig. 3. Impact of cigarette smoke exposure on the rat lung proteome. (A) Summary of rat exposure study. (B) Tobacco smoke exposure showed strong overall impact on the lung proteome. Heatmap shows significantly altered proteins (FDR-adjusted p-value b 0.05) in at least one cigarette smoke exposure condition. Each row represents a protein, each column a sample (six biological replicates), and the log2 fold-change expression values compared with sham (fresh air) exposure is color-coded. (C) Gene set enrichment analysis (GSEA) shows a concentration-dependent gene set perturbation by cigarette smoke and a partial recovery after 42 days of fresh air exposure. The heatmap shows the significance of association (−log10 adjusted p-value) of up- (red) and down- (blue) regulated proteins with gene sets. Select gene sets enriched for up-regulated proteins by cigarette smoke exposure are highlighted for three different clusters. (D) Functional interaction network of significantly up-regulated proteins upon cigarette smoke exposure shows affected functional clusters including xenobiotic metabolism, response to oxidative stress, and inflammatory response. (E) Overall, the identified functional clusters show corresponding mRNA upregulation. mRNA expression changes were measured for the same lung tissue samples and compared with the protein expression changes. The heatmap compares differential protein (left) and mRNA (right) regulation (signed −log10 q-value) for the identified protein clusters and exposure conditions. The bar plot indicates the percent of the genes that show consistent, statistically significant upregulation of the mRNA transcript upon 90-day smoke exposure (q-value b 0.05). Note that—while overall consistent—the “translation” and “unfolded protein response” clusters show less mRNA up-regulation. (For interpretation of the references to color in this figure legend, the reader is referred to the web version of this article.)
84
B. Titz et al. / Computational and Structural Biotechnology Journal 11 (2014) 73–90
Table 1 Resources for the analysis of proteomics datasets. Tool MS raw data processing Trans-Proteomic Pipeline
Protein-by-protein
Functional modules
Network analyses
Data integration
Comment Flexible workflows for MS raw data processing
References/links
tools.proteomecenter.org/software.php [33] CPAS MS raw data processing www.labkey.org [34] OpenMS Flexible workflows for MS raw www.openms.de data processing [35] MaxQuant Integrated package for quantitative www.maxquant.org proteomics analysis [36] Sequest Spectra to peptide matching [42] Mascot Spectra to peptide matching [43] X!Tandem Spectra to peptide matching [44] OMSSA Spectra to peptide matching [45] Normalizer Evaluation of data normalization procedures quantitativeproteomics.org/normalyzer [68] UniProt KB Comprehensive protein database www.uniprot.org [83] BioMart Open source database system for www.biomart.org unified access to biological data [84] neXtProt Database for human proteins www.nextprot.org [85] PhosphoSite Comprehensive phospho-protein database www.phosphosite.org [86] NetPhorest Database of phosphorylation-specific netphorest.info sequence-based classifiers [87] STITCH Database of chemical–protein interactions stitch.embl.de [88] T3DB Database of toxins and toxin-target links www.t3db.org [89]. iHOP Database of text-mined protein–protein and www.ihop-net.org protein–concept links [92] EBIMed Text-mining tool www.ebi.ac.uk/Rebholz-srv/ebimed/ [93] SciMiner Text-mining tool jdrf.neurology.med.umich.edu/SciMiner [94] PolySearch Text-mining tool wishart.biology.ualberta.ca/polysearch/ [95] DAVID Comprehensive functional classification david.abcc.ncifcrf.gov resource (ORA method) [109] Enricher Comprehensive functional classification amp.pharm.mssm.edu/Enrichr resource (ORA method) [110] TOPPGene Comprehensive functional classification toppgene.cchmc.org resource (ORA method) [209] GSEA Classical FCS module enrichment method www.broadinstitute.org/gsea [111] SPIA Topology-based pathway enrichment method [210] Piano Module enrichment package for the R environment www.sysbio.se/piano [100] Comprehensive gene set database www.broadinstitute.org/gsea mSigDB [101] GeneSigDB Database of gene sets manually curated from the literature www.genesigdb.org [105] PAGED Integrated gene set database bio.informatics.iupui.edu/PAGED [106] String DB Database of confidence scored functional string.embl.de protein interactions [123] KEGG DB Pathway database www.genome.jp/kegg [102] Ingenuity Pathway Analysis Commercial knowledgebase and functional www.ingenuity.com analysis system Metacore Commercial knowledgebase and functional thomsonreuters.com/metacore analysis system Reactome FI Extended Reactome functional interaction www.reactome.org database (Cytoscape plugin available) [103,125] Agilent Literature Search tool Cytoscape plugin for text-mining analysis www.agilent.com/labs/research/litsearch.html jActiveModule Cytoscape plugin for the identification of apps.cytoscape.org/apps/jactivemodules[120] network modules Pride Repository for MS data www.ebi.ac.uk/pride [157] MOPED Repository for MS data www.kolkerlab.org/projects/statistics-bioinformatics/moped [158] POINTILLIST Integration of p-values magnet.systemsbiology.net/software/Pointillist/ [211]
B. Titz et al. / Computational and Structural Biotechnology Journal 11 (2014) 73–90
85
Table 2 Hepatotoxic studies using proteomic endpoints. Species Compound
Cells/organelles
Technique
Observations
Reference
Rat
In vivo Troglitazone
Total liver
DIGE
Boitier et al. (2011) [212]
Mouse
Troglitazone
Liver/mitochondria iTRAQ/MALDI-TOF
Rat
Z24
Plasma
2DGE
Differential expression of proteins from fatty acid metabolism, PPARa/RXR activation, oxidative stress and cholesterol biosynthesis Mitochondrial proteome shift from an early compensatory response to an eventual phase of intolerable oxidative stress. Differential expression of proteins from biotransformation, apoptosis, carbohydrate, lipid amino acid and energy metabolism
Primary hepatocytes HepG2
2D-LC/MALDI-TOF BEZA treatment modulated lipid and fatty acid metabolism/transport Alvergnas et al. (2011) [214] and cellular stress DIGE Differential expression of secreted proteins and ER-Golgi transport proteins van Summeren et al. (2011) [215]
In vitro Human Bezafibrate Human Acetaminophen Amiodarone Cyclosporin A Human Ethanol
Secretome of HepG2/C3A Human Di(2-ethylhexyl) Secretome of phthalate HepG2
LC–MS 2DGE
Differential expression of proteins from apoptosis, inflammation and cell leakage Differential expression of proteins from cell structure, apoptosis and tumor progression
Lee et al. (2013) [173] Wang et al. (2010) [213]
Lewis et al. (2010) [216] Choi et al. (2010) [217]
Abbreviations: DIGE, difference gel electrophoresis; 2DGE, two-dimensional gel electrophoresis; LC, liquid chromatography; MALDI, matrix-assisted laser desorption ionization; TOF, timeof-flight; MS, mass spectrometry.
low 3R4F dose. GSEA can support the identification of affected biological functions and potentially allows for the more sensitive detection of low, but concerted alterations. Applying GSEA to this dataset overall recapitulated the results observed for individual differentially expressed proteins: an increase in the number of significantly affected gene sets from low to high 3R4F exposure and an overall decrease after the 42-day recovery period. Visually the recovery for the high 3R4F exposure appears more pronounced on the protein- than gene-set level. However, one functional class cluster remained significantly (positively) altered even after the 42-day recovery period. Gene sets in this cluster include neutrophil granule constituents and up-regulated genes in acute lung injury, which indicate a less reversible perturbation of these processes. Two other gene-set clusters were strongly up-regulated by 3R4F exposure at 90 days, but reverted back after the recovery period. These clusters contained gene sets related to both metabolic and inflammatory processes including oxidative phosphorylation, electron transport chain, fatty acid metabolism, mast cell, and myeloid cell development gene sets. In this context, the complexities of the interpretation of GSEA results are worth noting. Often gene sets describe an unrelated biological process, and the observed enrichment is based on a common shared component of the biological response. For example, in these clusters an up-regulated tumor field effect gene set is enriched. Although the name implies a cancer-specific process, this gene set is dominated by a macrophage signature in the tumor stroma, which further supports the activation of inflammatory processes upon smoke exposure in our system. With this, GSEA can both capture the overall global response to an exposure and specifically highlight affected biological functions (here, inflammation- and metabolism-related processes). The detailed interpretation of GSEA results is challenging owing to the large number of affected, overlapping gene sets that are not necessarily specific to the process under investigation. As discussed above, methods such as enrichment maps have been developed [115] that facilitate the interpretation of complex GSEA result sets. Here, we complement GSEA with a functional network approach, which supports the identification and interpretation of perturbed functional modules (Fig. 3D). The main idea is to reduce the complexity of data interpretation by first linking the selected proteins by their functional protein interactions and then identifying and functionally interpreting the emerging functional clusters. Specifically, we make use of the STRING database, which is a comprehensive resource of confidence-scored functional protein interactions based on a range of evidence including pathway databases, text-mining, and co-expression (see above) [123]. From the functional interaction network derived for the proteins significantly up-regulated upon 90-day high 3R4F exposure, several functional clusters clearly emerge (Fig. 3D). These include the
expected up-regulation of xenobiotic metabolism and oxidative stress response proteins and of proteins associated with an inflammatory response [135,132]. Another component of the stress response is the up-regulation of proteins related to the unfolded protein response (UPR). This response has been previously reported and is thought to reflect a compensatory mechanism to cope with the adverse impact of oxidative stress on protein folding in the endoplasmatic reticulum [176, 177]. Finally, several metabolism clusters are up-regulated including oxidative phosphorylation and fatty acid oxidation, which is in line with the GSEA results. This likely reflects the major metabolic alterations that are triggered in response to smoke exposure, e.g., to cope with the altered oxidative balance. For example, Agarwal has recently investigated metabolic changes in mouse lungs upon short-term cigarette smoke exposure and also found up-regulation of oxidative phosphorylation [178]. Here, the authors suggested that this is part of an overall metabolic switch, which involves down-regulation of glycolysis, up-regulation of the pentose-phosphate pathway for increased NADPH generation, and a compensatory increase in the mitochondrial energy-transducing capacity. Interestingly, in this context the observed up-regulation of fatty acid oxidation could play a similar role. Finally, we compared the differential expression response of the proteins in the identified clusters and their corresponding mRNA transcripts (Fig. 3E). Overall, these functional clusters demonstrate consistent upregulation of the mRNA transcripts. While this is generally in line with the remark by Lefebvre et al. that in equilibrium the proteome generally reflects the transcriptome [179], clear differences between mRNA and protein expression exist. For example, we observe differences in the regulation of the functional clusters: whereas protein up-regulation of the xenobiotic cluster is well reflected on the mRNA level, no significant mRNA up-regulation is detected for the translation and unfolded protein response cluster. For example, among the proteins in the latter clusters are TPT1 (Tumor Protein, Translationally-Controlled 1) and Grp78 (Hspa5) – two proteins known to be posttranscriptionally regulated [180,181]. In summary, we have conducted a 90-day rat smoke exposure study including a 42-day recovery period. Although the quantitative proteomic analysis of lung tissue is only one component of our comprehensive assessment strategy within an overarching systems toxicology framework, it already provides an extensive view of the biological impact of cigarette smoke exposure. Globally, the impact of cigarette smoke on the protein and gene set level and the extent of recovery after subsequent 42-day fresh air exposure are apparent. Here, we especially highlight the inflammatory, xenobiotic metabolism, and oxidative stress response. Importantly, these results complement the conclusions from our recent transcriptomic analysis for a 28-day rat cigarette smoke inhalation
86
B. Titz et al. / Computational and Structural Biotechnology Journal 11 (2014) 73–90
study [175]. Moreover, the direct comparison with transcriptomic data for the 90-day rat study revealed overall consistency between the mRNA and protein response, but also highlighted relevant differences likely due to posttranscriptional regulation. In addition, we provide further evidence for the complex compensatory metabolic switch in response to cigarette smoke exposure, which involves the up-regulation of oxidative phosphorylation and fatty acid oxidation enzymes, possibly to cope with the changing cellular energy requirements [178]. 1.3.4. Phosphoproteomics for toxicological assessment Global expression proteomics mainly captures the alterations in effector functions that cope with a specific cellular stress (e.g., up-regulation of xenobiotic enzymes) and gross alterations in the tissue composition (e.g., invasion of immune cells). Cells use a sophisticated signaling network to sense and process cellular stresses and changes in this network can be considered early indicators of a toxicological stress. Of the methods for the analysis of signaling networks, phosphoproteomics can be considered the most established (see above), but only a few studies have already used this technique to assess toxicological mechanisms. Caruso et al. employed a systems toxicology approach to assess the impact of mercury on a B lymphocyte cell model [182]. Mercury is a potent neurotoxin, but has also been found to contribute to autoimmune diseases at low concentrations, which do not invoke neurotoxicity. To further understand this phenomenon, the authors exposed WEHI-231 cells, a murine B-cell line, for 10 min with mercury and conducted a mass-spectrometry based phospho-proteome analysis. Interestingly, the B cell receptor pathway with the Lyn kinase as the key node was identified as the most affected signaling pathway. This finding was followed up with a targeted mass-spectrometry assay and the involvement of Lyn was confirmed. From this, the authors concluded that Lyn could represent an important contributor to mercury induced autoimmune diseases. Chen et al. used quantitative expression and phospho-proteomics to analyze the cellular response to the alkylating model chemical MNNG (N-methyl-N′-nitro-N-nitrosoguanidine) [183]. They focused on the nuclear (phospho-) proteome and compared the response of a labgenerated cell line pair. Both cell lines had a defect in a direct detoxification enzyme for MNNG (MGMT), but in addition one cell line was deficient in the mismatch repair system (MMR). Chen et al. and found a larger phosphorylation response in the MMR proficient cell line and identified a signaling response network that involved ATM/ATR, CDK2, Casein kinase II, and MAP kinases. Pan et al. employed a phospho-proteomic strategy to analyze and better understand the impact of deoxynivalenol (DON) on the mouse spleen [184]. The mycotoxin DON is frequently found in human an animal food and shows immunotoxic effects that are associated with a ribotoxic stress response. Quantitative phospho-profiling revealed 90 differentially regulated phosho-proteins upon DON exposure. Both the MAP-kinase and PI3K/AKT signaling axes were affected and several additional pathways that likely contribute to immune dysregulation were identified. From this, the authors concluded that phospho-proteomics helped to further unravel the complex effect of DON on the immune system and their study will serve as a template to better understand the toxic effects of DON in the future. 1.4. General discussion and future prospects 1.4.1. The future of systems toxicology Framed in a systems analysis context, physiological homeostasis is maintained by a hierarchy of functional domains (genetic sequence, gene transcription, transcriptional regulation, protein function and interaction, organelles, cells, and organs) that are interconnected at each level of functional organization and across levels [185]. Exposure to chemicals and xenobiotics may simply be viewed as a perturbation that alters this system. Thus, an advanced mechanistic understanding of exposure effects requires systems toxicology approaches that capture
these effects on different levels of this hierarchy and eventual integrate them into quantitative (and predictive) mathematical models [4]. This perspective is already a central element of the EU framework 6 program to further aid the understanding of the mechanisms of drugs actions and drug-mediated toxicities [186]. An example is the creation of joint data repositories for the complex datasets generated by a number of EU projects, which include aging- or toxicology-related projects assembling genomic, transcriptomic, proteomic, and functional data from a variety of models. In the context of chemical risk assessment, Wilson et al. especially emphasize the need for integrative systems-level studies (e.g., proteomics, metabolomics, transcriptomics) to generate hypotheses and test mechanisms of action, which are then used as supporting information for a particular mode of action in EPA risk assessment [187]. Overall, such integrative approaches will be instrumental in understanding the complexities of toxicokinetic and toxicodynamic steps in multiple, and possibly interacting, pathways affected by a single chemical or mixtures of chemicals in human health risk assessment. 1.4.2. The future of proteomics in systems toxicology Mass spectrometry-based proteomics methods are evolving rapidly toward higher sensitivity, higher throughput, higher coverage, and highly accurate quantification, and thus will constitute a central component of future integrative systems toxicology approaches [188]. Specifically, these advances include new highly accurate and fast mass spectrometer instruments [189–191]; improved methods and much expanded resources for targeted proteomic measurements (SRM, PRM) [192] [193] [194]; the novel (still exploratory) SWATH technology, which combines the strengths of targeted (sensitivity, dynamic range) and untargeted measurement principles (coverage) [195]; and advances in label-free quantification approaches [196]. Considering these advances, it has recently been suggested by Aebersold et al. that—at least for the analysis of proteins—it is “time to turn the tables” [197]: MS-based measurements are now more reliable than classical antibody-based western blot methods and should be considered the gold standard method of the field. With MS instrumentation becoming more and more mature, Van Vliet especially emphasized the need to further develop computational analysis tools for toxicoproteomic data including data integration and interpretation methods [198]. Analysis methods developed for transcriptomic data such as GSEA [111] have already been successfully used in several proteomic studies. However, when developing (or applying) analysis methods for proteomic data, it is important to keep the main differences between transcriptomic and proteomic data in mind. These include sampling differences (sampling biases, missing values) [199,200], differences in the coverage of proteomic and transcriptomic measurements [199], and the fundamentally different functional roles and modes of regulation of proteins and mRNAs. For example, improving the integration of transcriptomic and proteomics data for toxicological risk assessment has been identified as an important topic for future computational method development [198, 201]. In this review, we have presented several possible data integration approaches including some that have already been successfully applied for the integration of transcriptomic and proteomic data (see Fig. 2 and “Deriving insights through data integration” section) [170,171]. Overall, the question is still open how to best integrate these different data modalities to reliably summarize the biological impact of a potential toxicant. However, the concept of Pathways of Toxicity (PoT) [3] combined with a rigorous quantitative framework could guide a solution. Recently, we have published on a computational method that uses transcriptomics data to predict the activity state of causal biological networks that fall under the PoT category [202]. It can be imagined that such an approach can be further expanded by directly utilizing data on (phospho-) protein nodes in these networks/PoTs measured with proteomic techniques. While proteomic and transcriptomic data can already be considered as complementary for toxicological assessement (e.g., Fig. 3E),
B. Titz et al. / Computational and Structural Biotechnology Journal 11 (2014) 73–90
such integrative models would yield truly synergistic results on the biological impact across biological levels. In addition, most current toxicoproteomics studies focus on the measurement of whole protein expression. However, the relevance of posttranslational modifications such as protein phosphorylation for toxicological mechanisms is well appreciated and especially the analysis of phospho-proteomes has matured (see above) [203,204]. With this, phosphoproteomics (and the measurement of other PTMs) has great potential to significantly contribute to integrative toxicological assessment strategies in the future. When using model systems, the crucial question is how the measured molecular effects translate between species; most importantly, from animal models to human. For example, Black et al. compared the transcriptomic response of rat and human hepatocytes to 2,3,7,8Tetrachlorodibenzo-p-dioxin (TCDD) and found similarities, but also significant differences in the response of the two species [205]. Recently, we have co-organized the species translation challenge. For this, we generated a cross-species data set, which captures the exposure response of both human and rat epithelial cells to 52 different stimuli [206]. The molecular response was measured both by transcriptomics and by targeted phospho-proteomics. Within the sbv IMPROVER framework, different computational groups were engaged to assess the predictability of exposure effects within and between the two species (Rhrissorrakrai et al., submitted) [207]. Again, while overall translatability was demonstrated, the accuracy of translation was stimulus and biological process dependent. Interestingly, however, for this dataset the phosphoproteomics measurements demonstrated higher translatability than the transcriptomics results. For future toxicological applications, it will be important to further assess the translatability of transcriptomics and (phospho-) proteomics responses. Especially, it will be interesting to further evaluate, whether the reported higher conservation of the proteome vs. the transcriptome holds for relevant toxic challenges [5]. 2. Conclusions Toxicology is increasingly moving beyond the sole measurement of apical endpoints, and in the future it will be crucial to gain a better understanding of the causal chain of molecular events linking exposures with adverse outcomes (i.e., apical endpoints) toward improved predictive risk assessment [4]. Toward this overall goal, systems toxicology combines large-scale measurements (e.g., transcriptomics and proteomics) with mathematical modeling. As discussed in this review, MS-based proteomics is maturing into a robust technology for the measurement of proteome-wide exposure effects. The benefits of including proteomic data to understand exposure effects have already been demonstrated in several case studies. Although some challenges still exist to make full use of the richness of proteomic datasets [198,201,208], there is overall a great opportunity for proteomics to contribute to an improved understanding of toxicant action, the linkages to accompanying dysfunction and pathology, and the development of predictive biomarkers and signatures of toxicity. Assembling a generally accepted, robust, and integrative systems toxicology assessment framework will benefit from collaborative efforts with the active participation of industry, academia, research institutes, and regulatory bodies. References [1] Rowlands JC, Sander M, Bus JS. FutureTox: building the road for 21st century toxicology and risk assessment practices. Toxicol Sci 2014;137:269–77. [2] National Research Council. Committee on Toxicity T, Assessment of Environmental A. Toxicity testing in the 21st century: a vision and a strategy. National Academies Press; 2007. [3] Kleensang A, et al. t4 workshop report: pathways of toxicity. Altex 2014;31:53. [4] Sturla SJ, et al. Systems toxicology: from basic research to risk assessment. Chem Res Toxicol 2014;27:314–29. [5] Vogel C, Marcotte EM. Insights into the regulation of protein abundance from proteomic and transcriptomic analyses. Nat Rev Genet 2012;13:227–32. [6] Kruse J-P, Gu W. Modes of p53 regulation. Cell 2009;137:609–22.
87
[7] Majmundar AJ, Wong WJ, Simon MC. Hypoxia-inducible factors and the response to hypoxic stress. Mol Cell 2010;40:294–309. [8] Spriggs KA, Bushell M, Willis AE. Translational regulation of gene expression during conditions of cell stress. Mol Cell 2010;40:228–37. [9] Hardie DG, Ross FA, Hawley SA. AMPK: a nutrient and energy sensor that maintains energy homeostasis. Nat Rev Mol Cell Biol 2012;13:251–62. [10] Shiloh Y, Ziv Y. The ATM protein kinase: regulating the cellular response to genotoxic stress, and more. Nat Rev Mol Cell Biol 2013;14:197–210. [11] Runchel C, Matsuzawa A, Ichijo H. Mitogen-activated protein kinases in mammalian oxidative stress responses. Antioxid Redox Signal 2011;15:205–18. [12] Kolkman A, Dirksen EH, Slijper M, Heck AJ. Double standards in quantitative proteomics: direct comparative assessment of difference in gel electrophoresis and metabolic stable isotope labeling. Mol Cell Proteomics 2005;4:255–66. [13] Bouwman FG, et al. 2D-electrophoresis and multiplex immunoassay proteomic analysis of different body fluids and cellular components reveal known and novel markers for extended fasting. BMC Med Genomics 2011;4:24. [14] de Roos B, et al. Proteomic methodological recommendations for studies involving human plasma, platelets, and peripheral blood mononuclear cells. J Proteome Res 2008;7:2280–90. [15] Mallick P, Kuster B. Proteomics: a pragmatic perspective. Nat Biotechnol 2010;28: 695–709. [16] Mann M, Kelleher NL. Precision proteomics: the case for high resolution and high mass accuracy. Proc Natl Acad Sci 2008;105:18132–8. [17] Zieske LR. A perspective on the use of iTRAQ reagent technology for protein complex and profiling studies. J Exp Bot 2006;57:1501–8. [18] Kusebauch U, et al. Using PeptideAtlas, SRMAtlas, and PASSEL: comprehensive resources for discovery and targeted proteomics. Curr Protoc Bioinformatics 2014; 46 [13 25 11-13 25 28]. [19] Lange V, Picotti P, Domon B, Aebersold R. Selected reaction monitoring for quantitative proteomics: a tutorial. Mol Syst Biol 2008;4. [20] Picotti P, Aebersold R. Selected reaction monitoring-based proteomics: workflows, potential, pitfalls and future directions. Nat Methods 2012;9:555–66. [21] Peterson AC, Russell JD, Bailey DJ, Westphall MS, Coon JJ. Parallel reaction monitoring for high resolution and high mass accuracy quantitative, targeted proteomics. Mol Cell Proteomics 2012;11:1475–88. [22] Zhao Y, Jensen ON. Modification‐specific proteomics: strategies for characterization of post‐translational modifications using enrichment techniques. Proteomics 2009; 9:4632–41. [23] Rubbi L, et al. Global phosphoproteomics reveals crosstalk between Bcr–Abl and negative feedback mechanisms controlling Src signaling. Sci Signal 2011;4:ra18. [24] Drake JM, et al. Metastatic castration-resistant prostate cancer reveals intrapatient similarity and interpatient heterogeneity of therapeutic kinase targets. Proc Natl Acad Sci 2013;110:E4762–9. [25] Heintz D, et al. An efficient protocol for the identification of protein phosphorylation in a seedless plant, sensitive enough to detect members of signalling cascades. Electrophoresis 2004;25:1149–59. [26] Thingholm TE, Jensen ON, Larsen MR. Analytical strategies for phosphoproteomics. Proteomics 2009;9:1451–68. [27] Xu P, et al. Quantitative proteomics reveals the function of unconventional ubiquitin chains in proteasomal degradation. Cell 2009;137:133–45. [28] Grabbe C, Husnjak K, Dikic I. The spatial and temporal organization of ubiquitin networks. Nat Rev Mol Cell Biol 2011;12:295–307. [29] Hochstrasser M. Ubiquitin, proteasomes, and the regulation of intracellular protein degradation. Curr Opin Cell Biol 1995;7:215–23. [30] Bedford L, Lowe J, Dick LR, Mayer RJ, Brownell JE. Ubiquitin-like protein conjugation and the ubiquitin–proteasome system as drug targets. Nat Rev Drug Discov 2011;10:29–46. [31] Hoeller D, Dikic I. Targeting the ubiquitin system in cancer therapy. Nature 2009; 458:438–44. [32] Wagner SA, et al. A proteome-wide, quantitative survey of in vivo ubiquitylation sites reveals widespread regulatory roles. Mol Cell Proteomics 2011;10(M111):013284. [33] Deutsch EW, et al. A guided tour of the trans‐proteomic pipeline. Proteomics 2010; 10:1150–9. [34] Rauch A, et al. Computational Proteomics Analysis System (CPAS): an extensible, open-source analytic system for evaluating and publishing proteomic data and high throughput biological experiments. J Proteome Res 2006;5:112–21. [35] Sturm M, et al. OpenMS—an open-source software framework for mass spectrometry. BMC Bioinforma 2008;9:163. [36] Cox J, Mann M. MaxQuant enables high peptide identification rates, individualized ppb-range mass accuracies and proteome-wide protein quantification. Nat Biotechnol 2008;26:1367–72. [37] Nahnsen S, Bielow C, Reinert K, Kohlbacher O. Tools for label-free peptide quantification. Mol Cell Proteomics 2013;12:549–56. [38] Lemeer S, Hahne H, Pachl F, Kuster B. Software tools for MS-based quantitative proteomics: a brief overview. Quantitative Methods in Proteomics. Springer; 2012 489–99. [39] Röst HL, Schmitt U, Aebersold R, Malmström L. pyOpenMS: a Python‐based interface to the OpenMS mass‐spectrometry algorithm library. Proteomics 2014;14:74–7. [40] Berthold MR, et al. KNIME: the Konstanz information miner. Springer; 2008. [41] RC Team. R: a language and environment for statistical computing. R foundation for Statistical Computing; 2005. [42] Eng JK, McCormack AL, Yates JR. An approach to correlate tandem mass spectral data of peptides with amino acid sequences in a protein database. J Am Soc Mass Spectrom 1994;5:976–89. [43] Cottrell JS, London U. Probability-based protein identification by searching sequence databases using mass spectrometry data. Electrophoresis 1999;20: 3551–67.
88
B. Titz et al. / Computational and Structural Biotechnology Journal 11 (2014) 73–90
[44] Craig R, Beavis RC. TANDEM: matching proteins with tandem mass spectra. Bioinformatics 2004;20:1466–7. [45] Geer LY, et al. Open mass spectrometry search algorithm. J Proteome Res 2004;3: 958–64. [46] MacCoss MJ, Wu CC, Yates JR. Probability-based validation of protein identifications using a modified SEQUEST algorithm. Anal Chem 2002;74:5593–9. [47] Elias JE, Gygi SP. Target–decoy search strategy for increased confidence in largescale protein identifications by mass spectrometry. Nat Methods 2007;4:207–14. [48] Käll L, Storey JD, MacCoss MJ, Noble WS. Assigning significance to peptides identified by tandem mass spectrometry using decoy databases. J Proteome Res 2007;7: 29–34. [49] Spivak M, Weston J, Bottou L, Käll L, Noble WS. Improvements to the percolator algorithm for peptide identification from shotgun proteomics data sets. J Proteome Res 2009;8:3737–45. [50] Chalkley RJ. When target–decoy false discovery rate estimations are inaccurate and how to spot instances. J Proteome Res 2013;12:1062–4. [51] Perez-Riverol Y, et al. Computational proteomics pitfalls and challenges: HavanaBioinfo 2012 Workshop report. J Proteomics 2013;87:134–8. [52] Claassen M, Reiter L, Hengartner MO, Buhmann JM, Aebersold R. Generic comparison of protein inference engines. Mol Cell Proteomics 2012;11 [O110. 007088]. [53] Shteynberg D, et al. iProphet: multi-level integrative analysis of shotgun proteomic data improves peptide and protein identification rates and error estimates. Mol Cell Proteomics 2011;10 [M111. 007690]. [54] Serang O, Paulo J, Steen H, Steen JA. A non-parametric cutout index for robust evaluation of identified proteins. Mol Cell Proteomics 2013;12:807–12. [55] Jones AR, Siepen JA, Hubbard SJ, Paton NW. Improving sensitivity in proteome studies by analysis of false discovery rates for multiple search engines. Proteomics 2009;9:1220–9. [56] Lam H, et al. Development and validation of a spectral library searching method for peptide identification from MS/MS. Proteomics 2007;7:655–67. [57] Craig R, Cortens J, Fenyo D, Beavis RC. Using annotated peptide mass spectrum libraries for protein identification. J Proteome Res 2006;5:1843–9. [58] Lam H, et al. Building consensus spectral libraries for peptide identification in proteomics. Nat Methods 2008;5:873–5. [59] Zhang X, Li Y, Shao W, Lam H. Understanding the improved sensitivity of spectral library searching over sequence database searching in proteomics data analysis. Proteomics 2011;11:1075–85. [60] Allmer J. Algorithms for the de novo sequencing of peptides from tandem mass spectra. Expert Rev Proteomics 2011;8:645–57. [61] Dancik V, Addona TA, Clauser KR, Vath JE, Pevzner PA. De novo peptide sequencing via tandem mass spectrometry. J Comput Biol 1999;6:327–42. [62] Chen T, Kao M-Y, Tepel M, Rush J, Church GM. A dynamic programming approach to de novo peptide sequencing via tandem mass spectrometry. J Comput Biol 2001; 8:325–37. [63] Ma B, et al. PEAKS: powerful software for peptide de novo sequencing by tandem mass spectrometry. Rapid Commun Mass Spectrom 2003;17:2337–42. [64] Zhang J, et al. PEAKS DB: de novo sequencing assisted database search for sensitive and accurate peptide identification. Mol Cell Proteomics 2012;11 [M111. 010587]. [65] Cappadona S, Baker PR, Cutillas PR, Heck AJ, van Breukelen B. Current challenges in software solutions for mass spectrometry-based quantitative proteomics. Amino Acids 2012;43:1087–108. [66] Callister SJ, et al. Normalization approaches for removing systematic biases associated with mass spectrometry and label-free proteomics. J Proteome Res 2006;5:277–86. [67] Kultima K, et al. Development and evaluation of normalization methods for labelfree relative quantification of endogenous peptides. Mol Cell Proteomics 2009;8: 2285–95. [68] Chawade A, Alexandersson E, Levander F. Normalyzer: a tool for rapid evaluation of normalization methods for omics datasets. J Proteome Res 2014;13(6):3114–20. [69] Sandberg A, Branca RM, Lehtio J, Forshed J. Quantitative accuracy in mass spectrometry based proteomics of complex samples: the impact of labeling and precursor interference. J Proteomics 2013;96C:133–44. [70] Savitski MM, et al. Measuring and managing ratio compression for accurate iTRAQ/ TMT quantification. J Proteome Res 2013;12(8):3586–98. [71] Herbrich SM, et al. Statistical inference from multiple iTRAQ experiments without using common reference standards. J Proteome Res 2013;12:594–604. [72] Sandin M, et al. An adaptive alignment algorithm for quality-controlled label-free LC–MS. Mol Cell Proteomics 2013;12:1407–20. [73] Sandin M, Teleman J, Malmström J, Levander F. Data processing methods and quality control strategies for label-free LC–MS protein quantification. Biochim Biophys Acta (BBA)-Protein Proteomics 2014;1844:29–41. [74] Ting L, et al. Normalization and statistical analysis of quantitative proteomics data generated by metabolic labeling. Mol Cell Proteomics 2009;8:2227–42. [75] Diz AP, Carvajal-Rodríguez A, Skibinski DO. Multiple hypothesis testing in proteomics: a strategy for experimental work. Mol Cell Proteomics 2011;10 [M110. 004374]. [76] Benjamini Y, Hochberg Y. Controlling the false discovery rate: a practical and powerful approach to multiple testing. J R Stat Soc Ser B Methodol 1995:289–300. [77] Yates III JR, et al. Toward objective evaluation of proteomic algorithms. Nat Methods 2012;9:455. [78] Altelaar A, et al. Benchmarking stable isotope labeling based quantitative proteomics. J Proteomics 2013;88:14–26. [79] Li Z, et al. Systematic comparison of label-free, metabolic labeling, and isobaric chemical labeling for quantitative proteomics on LTQ Orbitrap Velos. J Proteome Res 2012;11:1582–90. [80] Neuhauser N, et al. High performance computational analysis of large-scale proteome data sets to assess incremental contribution to coverage of the human genome. J Proteome Res 2013;12:2858–68.
[81] Halligan BD, Geiger JF, Vallejos AK, Greene AS, Twigger SN. Low cost, scalable proteomics data analysis using Amazon's cloud computing services and open source search algorithms. J Proteome Res 2009;8:3148–53. [82] Li Y, Chi H, Xia L, Chu X. Accelerating the scoring module of mass spectrometrybased peptide identification using GPUs. BMC Bioinforma 2014;15:121. [83] Consortium U. Activities at the Universal Protein Resource (UniProt). Nucleic Acids Res 2014;42:D191–8. [84] Kasprzyk A. BioMart: driving a paradigm change in biological data management. Database 2011: bar049; 2011. [85] Lane L, et al. neXtProt: a knowledge platform for human proteins. Nucleic Acids Res 2012;40:D76–83. [86] Hornbeck PV, Chabra I, Kornhauser JM, Skrzypek E, Zhang B. PhosphoSite: a bioinformatics resource dedicated to physiological protein phosphorylation. Proteomics 2004;4:1551–61. [87] Miller ML, et al. Linear motif atlas for phosphorylation-dependent signaling. Sci Signal 2008;1:ra2. [88] Kuhn M, et al. STITCH 3: zooming in on protein–chemical interactions. Nucleic Acids Res 2012;40:D876–80. [89] Lim E, et al. T3DB: a comprehensively annotated database of common toxins and their targets. Nucleic Acids Res 2010;38:D781–6. [90] Rebholz-Schuhmann D, Oellrich A, Hoehndorf R. Text-mining solutions for biomedical research: enabling integrative biology. Nat Rev Genet 2012;13:829–39. [91] Faro A, Giordano D, Spampinato C. Combining literature text mining with microarray data: advances for system biology modeling. Brief Bioinform 2012;13:61–82. [92] Hoffmann R, Valencia A. A gene network for navigating the literature. Nat Genet 2004;36:664. [93] Rebholz-Schuhmann D, et al. EBIMed—text crunching to gather facts for proteins from Medline. Bioinformatics 2007;23:e237–44. [94] Hur J, Schuyler AD, Feldman EL. SciMiner: web-based literature mining tool for target identification and functional enrichment analysis. Bioinformatics 2009;25: 838–40. [95] Cheng D, et al. PolySearch: a web-based text mining system for extracting relationships between human diseases, genes, mutations, drugs and metabolites. Nucleic Acids Res 2008;36:W399–405. [96] Ravasz E, Somera AL, Mongru DA, Oltvai ZN, Barabási A-L. Hierarchical organization of modularity in metabolic networks. Science 2002;297:1551–5. [97] Gavin A-C, et al. Proteome survey reveals modularity of the yeast cell machinery. Nature 2006;440:631–6. [98] Titz B, et al. The proximal signaling network of the BCR–ABL1 oncogene shows a modular organization. Oncogene 2010;29:5895–910. [99] Martindale JL, Holbrook NJ. Cellular response to oxidative stress: signaling for suicide and survival. J Cell Physiol 2002;192:1–15. [100] Väremo L, Nielsen J, Nookaew I. Enriching the gene set analysis of genome-wide data by incorporating directionality of gene expression and combining statistical hypotheses and methods. Nucleic Acids Res 2013;41:4378–91. [101] Liberzon A, et al. Molecular signatures database (MSigDB) 3.0. Bioinformatics 2011; 27:1739–40. [102] Kanehisa M, et al. Data, information, knowledge and principle: back to metabolism in KEGG. Nucleic Acids Res 2014;42:D199–205. [103] Croft D, et al. The Reactome pathway knowledgebase. Nucleic Acids Res 2014;42: D472–7. [104] Consortium GO. Gene Ontology annotations and resources. Nucleic Acids Res 2013; 41:D530–5. [105] Culhane AC, et al. GeneSigDB: a manually curated database and resource for analysis of gene expression signatures. Nucleic Acids Res 2012;40:D1060–6. [106] Huang H, et al. PAGED: a pathway and gene-set enrichment database to enable molecular phenotype discoveries. BMC Bioinforma 2012;13:S2. [107] Lee L, et al. Liverome: a curated database of liver cancer-related gene signatures with self-contained context information. BMC Genomics 2011;12(Suppl. 3):S3. [108] Khatri P, Sirota M, Butte AJ. Ten years of pathway analysis: current approaches and outstanding challenges. PLoS Comput Biol 2012;8:e1002375. [109] Huang DW, Sherman BT, Lempicki RA. Systematic and integrative analysis of large gene lists using DAVID bioinformatics resources. Nat Protoc 2008;4:44–57. [110] Chen EY, et al. Enrichr: interactive and collaborative HTML5 gene list enrichment analysis tool. BMC Bioinforma 2013;14:128. [111] Subramanian A, et al. Gene set enrichment analysis: a knowledge-based approach for interpreting genome-wide expression profiles. Proc Natl Acad Sci U S A 2005; 102:15545–50. [112] Martin F, et al. Assessment of network perturbation amplitudes by applying highthroughput data to causal biological networks. BMC Syst Biol 2012;6:54. [113] Gharib SA, et al. Of mice and men: comparative proteomics of bronchoalveolar fluid. Eur Respir J 2010;35:1388–95. [114] Chin M, et al. Mitochondrial dysfunction, oxidative stress, and apoptosis revealed by proteomic and transcriptomic analyses of the striata in two mouse models of Parkinson's disease. J Proteome Res 2008;7:666–77. [115] Merico D, Isserlin R, Stueker O, Emili A, Bader GD. Enrichment map: a networkbased method for gene-set enrichment visualization and interpretation. PLoS One 2010;5:e13984. [116] Isserlin R, et al. Pathway analysis of dilated cardiomyopathy using global proteomic profiling and enrichment maps. Proteomics 2010;10:1316–27. [117] Meierhofer D, et al. Protein sets define disease states and predict in vivo effects of drug treatment. Molecular & Cellular: Proteomics; 2013. [118] Barabasi A-L, Oltvai ZN. Network biology: understanding the cell's functional organization. Nat Rev Genet 2004;5:101–13. [119] Mitra K, Carvunis A-R, Ramesh SK, Ideker T. Integrative approaches for finding modular structure in biological networks. Nat Rev Genet 2013;14:719–32.
B. Titz et al. / Computational and Structural Biotechnology Journal 11 (2014) 73–90 [120] Ideker T, Ozier O, Schwikowski B, Siegel AF. Discovering regulatory and signalling circuits in molecular interaction networks. Bioinformatics 2002;18:S233–40. [121] Iorio F, Saez-Rodriguez J, Di Bernardo D. Network based elucidation of drug response: from modulators to targets. BMC Syst Biol 2013;7:139. [122] Vidal M, Cusick ME, Barabasi A-L. Interactome networks and human disease. Cell 2011;144:986–98. [123] Franceschini A, et al. STRING v9.1: protein–protein interaction networks, with increased coverage and integration. Nucleic Acids Res 2013;41:D808–15. [124] Croft D, et al. Reactome: a database of reactions, pathways and biological processes. Nucleic Acids Res 2011;39:D691–7. [125] Wu G, Feng X, Stein L. A human functional protein interaction network and its application to cancer data analysis. Genome Biol 2010;11:R53. [126] Kanehisa M, Goto S. KEGG: kyoto encyclopedia of genes and genomes. Nucleic Acids Res 2000;28(1):27–30. [127] Calvano SE, et al. A network-based analysis of systemic inflammation in humans. Nature 2005;437:1032–7. [128] Racine J, et al. Comparison of genomic and proteomic data in recurrent airway obstruction affected horses using ingenuity pathway analysis®. BMC Vet Res 2011;7:48. [129] Go Y-M, Roede JR, Orr M, Liang Y, Jones DP. Integrated redox proteomics and metabolomics of mitochondria to identify mechanisms of Cd toxicity. Toxicol Sci 2014; 139:059–73. [130] Basak S, Behar M, Hoffmann A. Lessons from mathematically modeling the NF‐κB pathway. Immunol Rev 2012;246:221–38. [131] Hoeng J, et al. Case study: the role of mechanistic network models in systems toxicology. Drug Discov Today 2014;19(2):183–92. [132] Schlage WK, et al. A computable cellular stress network model for non-diseased pulmonary and cardiovascular tissue. BMC Syst Biol 2011;5:168. [133] Gebel S, et al. Construction of a computable network model for DNA damage, autophagy, cell death, and senescence. Bioinforma Biol Insights 2013;7:97. [134] Westra JW, et al. Construction of a computable cell proliferation network focused on non-diseased lung cells. BMC Syst Biol 2011;5:105. [135] Westra JW, et al. A modular cell-type focused inflammatory process network model for non-diseased pulmonary tissue. Bioinform Biol Insights 2013;7:167. [136] Slater T. Recent advances in modeling languages for pathway maps and computable biological networks. Drug Discov Today 2014;19(2):193–8. [137] Ansari S, et al. On crowd-verification of biological networks. Bioinforma Biol Insights 2013;7:307. [138] Meyer P, et al. Verification of systems biology research in the age of collaborative competition. Nat Biotechnol 2011;29:811. [139] Meyer P, et al. Industrial methodology for process verification in research (IMPROVER): toward systems biology verification. Bioinformatics 2012;28:1193–201. [140] Smoot ME, Ono K, Ruscheinski J, Wang PL, Ideker T. Cytoscape 2.8: new features for data integration and network visualization. Bioinformatics 2011;27:431–2. [141] Saito R, et al. A travel guide to Cytoscape plugins. Nat Methods 2012;9:1069–76. [142] Chen R, et al. Personal omics profiling reveals dynamic molecular and medical phenotypes. Cell 2012;148:1293–307. [143] Ashley EA, et al. Network analysis of human in-stent restenosis. Circulation 2006; 114:2644–54. [144] Chang DW, et al. Proteomic and computational analysis of bronchoalveolar proteins during the course of the acute respiratory distress syndrome. Am J Respir Crit Care Med 2008;178:701. [145] Müller T, et al. Sense and nonsense of pathway analysis software in proteomics. J Proteome Res 2011;10:5398–408. [146] Leung MC, et al. Effects of early life exposure to ultraviolet C radiation on mitochondrial DNA content, transcription, ATP production, and oxygen consumption in developing Caenorhabditis elegans. BMC Pharmacol Toxicol 2013;14:9. [147] Chuang HY, Lee E, Liu YT, Lee D, Ideker T. Network-based classification of breast cancer metastasis. Mol Syst Biol 2007;3:140. [148] Dittrich MT, Klau GW, Rosenwald A, Dandekar T, Muller T. Identifying functional modules in protein–protein interaction networks: an integrated exact approach. Bioinformatics 2008;24:i223–31. [149] Beisser D, Klau GW, Dandekar T, Müller T, Dittrich MT. BioNet: an R-Package for the functional analysis of biological networks. Bioinformatics 2010;26:1129–30. [150] Aluru M, Zola J, Nettleton D, Aluru S. Reverse engineering and analysis of large genome-scale gene networks. Nucleic Acids Res 2013;41:e24. [151] Chen L, Xuan J, Riggins RB, Wang Y, Clarke R. Identifying protein interaction subnetworks by a bagging Markov random field-based method. Nucleic Acids Res 2013;41:e42. [152] Petrochilos D, Shojaie A, Gennari J, Abernethy N. Using random walks to identify cancer-associated modules in expression data. BioData Min 2013;6. [153] McClellan EA, Moerland PD, van der Spek PJ, Stubbs AP. NetWeAvers: an R package for integrative biological network analysis with mass spectrometry data. Bioinformatics 2013;29:2946–7. [154] Edgar R, Domrachev M, Lash AE. Gene Expression Omnibus: NCBI gene expression and hybridization array data repository. Nucleic Acids Res 2002;30:207–10. [155] Brazma A, et al. ArrayExpress—a public repository for microarray gene expression data at the EBI. Nucleic Acids Res 2003;31:68–71. [156] Martens L. Resilience in the proteomics data ecosystem: how the field cares for its data. Proteomics 2013;13:1548–50. [157] Vizcaino JA, et al. The PRoteomics IDEntifications (PRIDE) database and associated tools: status in 2013. Nucleic Acids Res 2013;41:D1063–9. [158] Higdon R, et al. MOPED enables discoveries through consistently processed proteomics data. J Proteome Res 2014;13:107–13. [159] Lundberg E, et al. Defining the transcriptome and proteome in three functionally different human cell lines. Mol Syst Biol 2010;6.
89
[160] Schwanhäusser B, et al. Global quantification of mammalian gene expression control. Nature 2011;473:337–42. [161] Vogel C, et al. Sequence signatures and mRNA concentration can explain two‐thirds of protein abundance variation in a human cell line. Mol Syst Biol 2010;6. [162] Schrimpf SP, et al. Comparative functional analysis of the Caenorhabditis elegans and Drosophila melanogaster proteomes. PLoS Biol 2009;7:e1000048. [163] Laurent JM, et al. Protein abundances are more conserved than mRNA abundances across diverse taxa. Proteomics 2010;10:4209–12. [164] McRedmond JP, et al. Integration of proteomics and genomics in platelets: a profile of platelet proteins and platelet-specific genes. Mol Cell Proteomics 2004;3: 133–44. [165] Buschow SI, et al. Dominant processes during human dendritic cell maturation revealed by integration of proteome and transcriptome at the pathway level. J Proteome Res 2010;9:1727–37. [166] Fisher RA. Statistical methods for research workers. Genesis Publishing Pvt Ltd; 1925. [167] Stouffer SA, Suchman EA, DeVinney LC, Star SA, Williams Jr RM. The American soldier: adjustment during army life. Studies in social psychology in World War II, Vol. 1; 1949. [168] Brown MB. 400: a method for combining non-independent, one-sided tests of significance. Biometrics 1975;987–992. [169] Kaever A, et al. Meta-analysis of pathway enrichment: combining independent and dependent omics data sets. PLoS One 2014;9:e89297. [170] Nibbe RK, Koyutürk M, Chance MR. An integrative-omics approach to identify functional sub-networks in human colorectal cancer. PLoS Comput Biol 2010;6:e1000639. [171] Balbin OA, et al. Reconstructing targetable pathways in lung cancer by integrating diverse omics data. Nat Commun 2013;4. [172] Suter L, et al. EU framework 6 project: predictive toxicology (PredTox)—overview and outcome. Toxicol Appl Pharmacol 2011;252:73–84. [173] Lee YH, et al. Integrative toxicoproteomics implicates impaired mitochondrial glutathione import as an off-target effect of troglitazone. J Proteome Res 2013;12: 2933–45. [174] Van Summeren A, Renes J, van Delft JH, Kleinjans JC, Mariman EC. Proteomics in the search for mechanisms and biomarkers of drug-induced hepatotoxicity. Toxicol In Vitro 2012;26:373–85. [175] Kogel U, et al. A 28-day rat inhalation study with an integrated molecular toxicology endpoint demonstrates reduced exposure effects for a prototypic modified risk tobacco product compared with conventional cigarettes. Food Chem Toxicol 2014;68C: 204–17. [176] Kelsen SG, et al. Cigarette smoke induces an unfolded protein response in the human lung: a proteomic approach. Am J Respir Cell Mol Biol 2008;38:541–50. [177] Jorgensen E, et al. Cigarette smoke induces endoplasmic reticulum stress and the unfolded protein response in normal and malignant human lung cells. BMC Cancer 2008;8:229. [178] Agarwal A, et al. Short-term cigarette smoke exposure induces reversible changes in energy metabolism and cellular redox status independent of inflammatory responses in mouse lungs. Am J Physiol Lung Cell Mol Physiol 2012;303:L889. [179] Lefebvre C, Rieckhof G, Califano A. Reverse‐engineering human regulatory networks. Wiley Interdiscip Rev Syst Biol Med 2012;4:311–25. [180] Bommer U-A. Cellular function and regulation of the translationally controlled tumour protein TCTP. Open Allergy J 2012;5:19–32. [181] Roué G, et al. The Hsp90 inhibitor IPI-504 overcomes bortezomib resistance in mantle cell lymphoma in vitro and in vivo by down-regulation of the prosurvival ER chaperone BiP/Grp78. Blood 2011;117:1270–9. [182] Caruso JA, et al. A systems toxicology approach identifies Lyn as a key signaling phosphoprotein modulated by mercury in a B lymphocyte cell model. Toxicol Appl Pharmacol 2014;276:47–54. [183] Chen X, Zhao Y, Li GM, Guo L. Proteomic analysis of mismatch repair-mediated alkylating agent-induced DNA damage response. Cell Biosci 2013;3:37. [184] Pan X, et al. Early phosphoproteomic changes in the mouse spleen during deoxynivalenol-induced ribotoxic stress. Toxicol Sci 2013;135(1):129–43. [185] Bai JP, Abernethy DR. Systems pharmacology to predict drug toxicity: integration across levels of biological organization. Annu Rev Pharmacol Toxicol 2013;53:451–73. [186] Schrattenholz A, Groebe K, Soskic V. Systems biology approaches and tools for analysis of interactomes and multi-target drugs. Methods Mol Biol 2010;662:29–58. [187] Wilson VS, et al. Utilizing toxicogenomic data to understand chemical mechanism of action in risk assessment. Toxicol Appl Pharmacol 2013;271:299–308. [188] Hood LE, et al. New and improved proteomics technologies for understanding complex biological systems: addressing a grand challenge in the life sciences. Proteomics 2012;12:2773–83. [189] Kelstrup CD, Young C, Lavallee R, Nielsen ML, Olsen JV. Optimized fast and sensitive acquisition methods for shotgun proteomics on a quadrupole orbitrap mass spectrometer. J Proteome Res 2012;11:3487–97. [190] Michalski A, et al. Mass spectrometry-based proteomics using Q Exactive, a highperformance benchtop quadrupole Orbitrap mass spectrometer. Mol Cell Proteomics 2011;10 [M111. 011015]. [191] Beck M, et al. The quantitative proteome of a human cell line. Mol Syst Biol 2011;7. [192] Gallien S, et al. Targeted proteomic quantification on quadrupole-orbitrap mass spectrometer. Mol Cell Proteomics 2012;11:1709–23. [193] Picotti P, et al. High-throughput generation of selected reaction-monitoring assays for proteins and proteomes. Nat Methods 2010;7:43–6. [194] Gillette MA, Carr SA. Quantitative analysis of peptides and proteins in biomedicine by targeted mass spectrometry. Nat Methods 2013;10(1):28–34. [195] Gillet LC, et al. Targeted data extraction of the MS/MS spectra generated by dataindependent acquisition: a new concept for consistent and accurate proteome analysis. Mol Cell Proteomics 2012;11(O111):016717.
90
B. Titz et al. / Computational and Structural Biotechnology Journal 11 (2014) 73–90
[196] Neilson KA, et al. Less label, more free: approaches in label‐free quantitative mass spectrometry. Proteomics 2011;11:535–53. [197] Aebersold R, Burlingame AL, Bradshaw RA. Western blots versus selected reaction monitoring assays: time to turn the tables? Mol Cell Proteomics 2013;12: 2381–2. [198] van Vliet E. Current standing and future prospects for the technologies proposed to transform toxicity testing in the 21st century. Altex-Altern Anim Exp 2011;28: 17. [199] Nagaraj N, et al. Deep proteome and transcriptome mapping of a human cancer cell line. Mol Syst Biol 2011;7. [200] Drexler HC, et al. On marathons and Sprints: an integrated quantitative proteomics and transcriptomics analysis of differences between slow and fast muscle fibers. Mol Cell Proteomics 2012;11(M111):010801. [201] Merrick BA, Witzmann FA. The role of toxicoproteomics in assessing organ specific toxicity. EXS 2009;99:367–400. [202] Martin F, et al. Quantification of biological network perturbations for mechanistic insight and diagnostics using two-layer causal models. BMC Bioinforma 2014;15: 238. [203] Roux PP, Thibault P. The coming of age of phosphoproteomics—from large data sets to inference of protein functions. Mol Cell Proteomics 2013;12:3453–64. [204] Yates III JR, Mohammed S, Heck AJ. Phosphoproteomics. Anal Chem 2014;86:13131313. [205] Black MB, et al. Cross-species comparisons of transcriptomic alterations in human and rat primary hepatocytes exposed to 2, 3, 7, 8-tetrachlorodibenzo-p-dioxin. Toxicol Sci 2012;127(1):199–215. [206] Poussin C, et al. The species translation challenge—a systems biology perspective on human and rat bronchial epithelial cells. Sci Data 2014;1.
[207] Biehl M, et al. Inter-species prediction of protein phosphorylation in the sbv IMPROVER species translation challenge. Bioinformatics 2014 (http://www.ncbi. nlm.nih.gov/pubmed/?term=24994890). [208] Martin SF, et al. PROTEINCHALLENGE: crowd sourcing in proteomics analysis and software development. J Proteomics 2013;88:41–6. [209] Chen J, Bardes EE, Aronow BJ, Jegga AG. ToppGene Suite for gene list enrichment analysis and candidate gene prioritization. Nucleic Acids Res 2009;37:W305–11. [210] Tarca AL, et al. A novel signaling pathway impact analysis. Bioinformatics 2009;25: 75–82. [211] Hwang D, et al. A data integration methodology for systems biology. Proc Natl Acad Sci U S A 2005;102:17296–301. [212] Boitier E, et al. A comparative integrated transcript analysis and functional characterization of differential mechanisms for induction of liver hypertrophy in the rat. Toxicol Appl Pharmacol 2011;252:85–96. [213] Wang Y, et al. Plasma and liver proteomic analysis of 3Z‐3‐[(1H‐pyrrol‐2‐yl)‐ methylidene]‐1‐(1‐piperidinylmethyl)‐1, 3‐2H‐indol‐2‐one‐induced hepatotoxicity in Wistar rats. Proteomics 2010;10:2927–41. [214] Alvergnas M, et al. Proteomic mapping of bezafibrate-treated human hepatocytes in primary culture using two-dimensional liquid chromatography. Toxicol Lett 2011;201:123–9. [215] Van Summeren A, et al. Proteomics investigations of drug-induced hepatotoxicity in HepG2 cells. Toxicol Sci 2011;120:109–22. [216] Lewis JA, Dennis WE, Hadix J, Jackson DA. Analysis of secreted proteins as an in vitro model for discovery of liver toxicity markers. J Proteome Res 2010;9:5794–802. [217] Choi S, et al. Identification of toxicological biomarkers of di (2‐ethylhexyl) phthalate in proteins secreted by HepG2 cells using proteomic analysis. Proteomics 2010;10: 1831–46.