Prototypes in the Wild: Lessons Learned from Evaluating Three Ubicomp Systems Scott Carter EECS Department UC Berkeley Berkeley, CA 94720
[email protected]
Jennifer Mankoff Human Computer Interaction Insitutute Carnegie Mellon Univeristy Pittsburgh, PA 15213
[email protected] July 12, 2005 Abstract
The study of Ubicomp is concerned with enabling a future in which the most useful Ubicomp applications are feasible to build and pleasing to use. But what is useful? What is usable? What do people actually need? These questions are only beginning to be answered partly because Ubicomp systems more difficult to evaluate than desktop applications. This difficulty is due to issues like scale and a tendency to apply Ubicomp in ongoing, daily life settings unlike task and work oriented desktop systems. This paper presents a case study of three Ubicomp systems that were evaluated at multiple stages of their design. In each case, we describe the application and evaluation. We then present a set of lessons that we learned regarding the evaluation techniques we used. Our goal is to better understand how evaluation techniques need to evolve for the Ubicomp domain.
Keywords: H.5.2.k Prototyping, H.5.2.e , Evaluation/methodology
1
Introduction
Technology in different forms is available ubiquitously through much of the world. The study of ubiquitous computing is concerned with enabling a future in which the most useful applications of such technology are feasible to build, and pleasing to use. Feasibility depends on the availability of network connectivity and data, of sensors and algorithms for interpreting the data they produce, and of tools with which to ease the building of applications. The degree to which an application is pleasing and useful depends on the ability of application designers to understand and meet the needs of the users of ubiquitous computing (Ubicomp) applications. User needs are best understood with the help of evaluation techniques. One of the hardest problems that application developers face today is evaluating ubiquitous computing applications, such as those that adjust output based on complicated contextual cues or use natural input technologies such as gesture and speech. In this paper, we concentrate on evaluations beginning to be explored by Ubicomp researchers including field studies that drive invention, early-stage requirements gathering, and prototype iteration. For example, Consolvo et al. recently published an evaluation of an enhanced biology lab which they evaluated using Lag Sequential Analysis (the first time that technique had been applied to a Ubicomp system) (2002). Mankoff et al. have developed modifications to Heuristic Evaluation that enhance its applicability to a sub-domain of Ubicomp, ambient displays (2003). Evaluation is crucial at all stages of design, and the best designs include evaluations that involve users in the design process repeatedly throughout a series of design iterations. Evaluation research can help us develop a suite of techniques applicable to finished systems (such as Consolvo et al.’s work) and early stage design (such as Mankoff et al.’s work).
1
2
Case Studies
We present three case studies of evaluations we did ourselves of Ubicomp systems. The first, PALplates, was developed in 1996. The second, a nutritional tracking system, was designed and evaluated between 2001 and 2004. The third, Hebb, our keystone study, was developed and evaluated from 2002 through 2004. Our goal in presenting these evaluations is to show by example some of the difficulties that stand in the way of Ubicomp evaluation.
2.1
PALplates
PALplates (Mankoff and Schilit, 1997) was intended to support office workers in doing everyday tasks by presenting key information and services at locations where they were most likely to be needed. The goal of the project was to create a Ubicomp system that could provide location-based services without requiring users to carry around a mobile computing platform. For example, suppose a user goes to the printer room to pick up a print job, and notices that the printer is almost out of paper. She might use the print room PALplate to request extra paper or resubmit her print job to a different printer. In contrast, the meeting room PALplate might be used to make reservations for that room for a follow up meeting to one just completed. PALplates were interactive computing platforms, deployed around the work place at places of need. Each PALplate provided unique services, based on its location in the office place. Our goal was to create a system that, although only available at certain places, would feel ubiquitous to a user. We hoped to do this by placing a system at each place the user was likely to be doing a task that might require computational support. This could free a user from the need to constantly carry a device with herself. Because this was a novel approach to ubiquitous computing, we wanted to get feedback from users as soon as possible about the effectiveness of such a system. We wanted to know if people would use the devices, and whether the way that devices were used were location specific. We also wanted to know whether users wanted additional services and whether they found the services in our initial set useful. Our goal was to generate requirements for our next iteration. It was best to let users experience this novel approach to providing “ubiquitous” computational support. Yet implementing even a prototype of our system ubiquitously would have required installing infrastructure in many locations. Instead, we decided to evaluate a paper prototype of the system in the field. 2.1.1
Evaluation
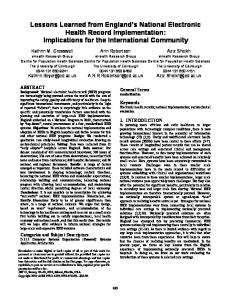
Paper prototyping is traditionally done by sketching all of the dialog boxes, screens, and other interactive elements of a graphical user interface on paper. An evaluator then simulates a computer’s reactions as users execute pre-defined tasks using the paper interface (Rettig, 1994). This technique is effective and quick to apply, in part because it requires no coding. It can also be used to involve end users in design. For example, M¨ uller presented end users with a kit of user interface elements and asked for feedback about layout (1992). Because PALplates needed to be available in many places, and at all times of day, to be perceived as ubiquitous, we were not able to apply the technique in its classic form. Instead, we created an interface that users could manipulate even when experimenters were not present. We posted notebooks decorated with icons around the office place (on office doors, in common rooms, and in conference rooms), along with instruction, pens, and post-it notes that users could interact with. An example of one of these “Paper Plates” is shown in Figure 1. Users could write notes, or make requests on any of these interfaces. They could also make suggestions and reservations and see local news. To make the system “interactive,” rather than updating the interface in real time, we asked five volunteers (friends and employees in our workplace) to play the part of a network that we nicknamed sneakernet by responding to user requests. Sneakernet, which ran once per day, would schedule meetings, fetch supplies, and deliver post-it notes to other PALplates based on the requests of users. For example, a note might be picked up and delivered to the display for which it was addressed. We deployed 16 Paper Plates around our office place. Most were on personal office doors, one was in the copy/printer room, one was in the kitchen, which opens onto a lounge were people can congregate, and
Figure 1: A paper prototype of the PALPlates system one was in a meeting room that also functioned as a conference room and the location of our weekly casual Kaffee-Klatsch. This covered the most used public spaces in our small office place, as well as the office doors of many of our researchers and staff. Because anyone could interact with the public displays, we don’t know exactly how many people made use of the Paper Plates, but we believe that most of the 20 or so employees in our office place made use of the system at least once. Our analysis was mostly qualitative. We monitored how different Paper Plates were used in different places. We asked members of sneakernet to report interesting uses or comments. And we interviewed users to ask them about their experiences using the system, and what they would like to see changed. We found that even though the Paper Plates were missing important features that would be present in a full-fledged application, people used them. Paper plates in different locations were used for different tasks. For example, the display located in the kitchen was used mostly for discussion and ordering kitchen supplies. Although we expected functions to be closely tied to location, we also found “remote access” activity. For example, people reserved the meeting room from a Paper Plate located in the hallway sometimes. In addition, people were interested in using the PALplates to access their own private information such as Web documents and calendars. 2.1.2
Summary
Overall, paper prototyping worked for us in this case. It allowed us to explore whether providing computing services at a point of need was a viable idea, and it helped us to test four services, and generate new requirements for additional services such a system would need to support.
2.2
Nutrition Tracking
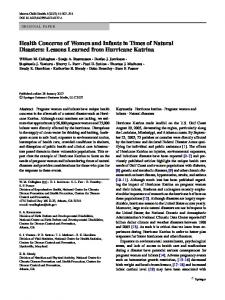
We built an application, shown in Figure 2, that uses inexpensive, low-impact sensing to collect data about what household members are purchasing and consuming, and used simple yet persuasive techniques to suggest potential changes. Healthy eating can help to reduce obesity, and consequently the chance of developing chronic diseases such as diabetes (Hankinson et al., 2001). Yet many people do not know exactly how many servings of fruits, grains, vegetables, and fats they are eating, or which nutrients are missing in their diet. The proposed system gathered data about purchasing habits when receipts were scanned in with a handheld scanner (e.g. when bills are being sorted at the end of the week). A shopping list, printed at the user’s
Friday ... May 8, 2002
Grocery List
$/oz. [Reason > Original] B H NH Item Name Grain [][][] Bread, pita, whole-w... $0.13 [VITE]->(BREAD) [][][] Rice, white, short-g... $0.05 [PANTAC]->(PASTA) $0.07 [VITE]->(BREAD) [][][] Pancakes, buckwheat _____________________________________ _____________________________________ Vegetable [][][] Beans, snap, green, raw $0.13 [VITE]->(ONIONS) [VITC]->(LETTUCE) [][][] Kohlrabi, raw [][][] Potatoes, boiled, co... $0.08 [PANTAC]->(ONIONS) _____________________________________ _____________________________________ Fruit [][][] Apples, dehydrated (low $0.14 [VITE] [VITC] [][][] Acerola juice, raw [][][] Avocados, raw, Calif... $0.18 [PANTAC] _____________________________________ _____________________________________ Meat and Beans $0.06 [VITC]->(BLACK BEANS) [][][] Beans, kidney, royal Honey roll sausage, ... $0.33 [VITD-]->(CORNED BEEF)[][][] [][][] Beef, round, eye of ... $0.31 [PANTAC]->(GROUND BEEF) _____________________________________ _____________________________________ Dairy [][][] Egg, quail, whole, f... $0.13 [VITE]->(CHEESE) [][][] Milk, dry, nonfat, r... $0.09 [VITC]->(MILK) [PANTAC]->(CHEESE) [][][] Milk, buttermilk, dried _____________________________________ _____________________________________ Fats, Oils, Sweets, and Snacks [VITE]->(ICE CREAM) [][][] Toppings, NESTLE, Ra... [VITC]->(ICE CREAM) [][][] Frozen desserts, ice [PANTAC]->(ICE CREAM) [][][] Frozen desserts, yogurt _____________________________________ _____________________________________ B = Bought; H = Helpful; NH = Not Helpful
(a)
(b)
Figure 2: (a) A receipt from a local grocery store. (b) A shopping list generated by our system, based on that receipt. request, provided annotated suggestions for slight changes in purchases. This portable piece of paper provided suggestions for a more balanced diet (based on USDA guidelines) at the most pertinent moment: when the user was making purchasing decisions. It could encourage healthier purchases such as baked tortillas instead of chips, or wheat bread instead of white. The system also displayed a food pyramid skewed to indicate the relative amounts of different foods a user was purchasing, enabling him to easily identify areas needing change. As with PALplates, our goal was to provide users with a computational service without requiring them to constantly carry a computer with them. Again, we wanted to know if people would use our device: was the printed shopping list sufficient to meet a person’s needs while shopping, and were our recommendations useful? We also questioned whether the process of using our device fit well into a person’s everyday shopping patterns. Lastly, we questioned whether people could easily interpret the information displayed by the food pyramid. Answering these questions was challenging. Because the system needed to integrate into a person’s shopping pattern, we had to deploy a working prototype in a field setting, a home. Additionally, our recommendation system required historical information and used a complex algorithm. This could not easily be simulated. Despite this, we wanted to test out as many aspects of the system as possible ahead of time, before we put too much effort into prototyping.
2.2.1
Evaluation
We began our evaluation by conducting a survey of 57 shoppers at a local supermarket (Mankoff et al., 2002), and interviews with five people to guide the early stages of our design. In our interviews, we began by asking people about their shopping habits, their use of shopping lists, and so on, and demonstrated paper prototypes of our planned interface. For our qualitative analysis, we looked for patterns in the shopping habits of our participants that could guide system placement (people preferred the kitchen), guide our design for motivating change (discounted prices were the strongest motivator), and other system features. Based on our results, we added the capability to base recommendations on dynamically downloaded sales data to our system. We next deployed the system to three users (ages 23-38). Our participants lived alone or with one other adult, shopped frequently (weekly to daily), ate out infrequently, and reported using a shopping list. Each participant was interviewed, asked to complete a home inventory and send us receipts for two weeks before deployment began (to build up a historical picture of their purchases habits), and then given a system to use for three weeks. During those three weeks, each participant completed weekly surveys, and the deployment ended with another interview. Participants felt the process of using the system was straightforward, although they were frustrated by it’s instability. However, we learned that our recommendation algorithm had serious flaws: Our suggestions included foods unliked by or unfamiliar to participants; and did not appear to vary much as new shopping was done. Also, the modified food pyramid was too hard to understand, and did not seem to users to reflect their diets. The problems uncovered during the deployment were not particularly surprising for a first iteration of a new system, but the development effort and high overhead of the study were totally out of proportion with this. We decided to address one issue, the problems with the food pyramid, using paper prototyping. We created several iterations of our modified food pyramid in an attempt to create something that was intuitive and easy to read at a glance, with a low learning curve. This allowed us to successfully address the very specific issue of “readability.” Lastly, we conducted a second deployment, after updating our algorithms, and attempting to increase our system robustness. This study was structured like the previous deployment, except that we extended the system use phase from three weeks to five to address a complaint that three weeks was not enough time. Also, we used log files combined with weekly reports filed by our subjects to construct a timeline of system use, which became a basis for our final interview, allowing us to more easily gather specific data about use experience. The three participants in this study were all in the age group of 27-33, single, shopped for groceries at least once per week and ate out rarely (less than once a month for all three). Our analysis of the final study was limited by the fact that, once again, instabilities in our technology caused daunting problems. Despite significant development effort over three years by a group of five students, the system still had major bugs, and at the end of five weeks, only one of our systems was still up and running. Luckily, where the systems worked, we got rich feedback. In fact, the quality of our feedback suggests that simulation, even with it’s unavoidable gaps in service, might have been just as effective at testing our ideas. We found that participants were motivated both by the wish to see the nutritional balance of their purchases reflected in the food pyramid. We also found that the shopping list was viewed more as a source of ideas than a tool to use while shopping. For example, one participant remarked “I just reviewed them and kept the suggestions in mind.” Along those lines, participants were very quick to either toss away, or pick up suggestions. Bad suggestions were ignored, while intriguing ones (such as those diversifying the participant’s diet) were considered. Our attempts to augment the shopping process failed, because our printout didn’t exactly fit existing habits. 2.2.2
Summary
In retrospect, we had to spend a lot of time and effort on this system before learning which aspects of it were truly useful, and which were not. The initial interviews we conducted had limited value when compared to what we learned when we actually deployed the system. The paper prototyping was very successful, but only allowed us to answer a very narrowly defined question. The deployments were highly informative, despite
(a)
(b)
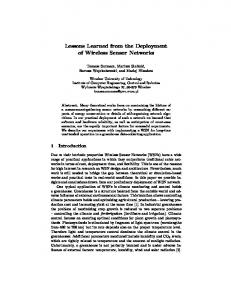
Figure 3: Hebb (a) interest sensor and (b) public display. The interest sensor scans participant’s e-mail for topics of interest. The public display collects topics and displays those likely to encourage communication and collaboration between groups.
being crippled by problems with placing a very early prototype in the field. However, the cost of doing them was unduly high. Simulation appears to be a viable alternative that should be considered.
2.3
Hebb
It is not uncommon for multiple small working groups in a large organization to overlap in the problems they are trying to solve, interests, or hobbies. Yet often such shared interests go undiscovered even among loosely coupled groups that share common spaces or are located in the same building. Better awareness could lead to fruitful collaborations, friendships, and other positive social change. Our approach is Hebb, a system designed to capture and convey shared interests (Carter et al., 2004). This system arose from a series of formative interviews that we conducted with members of six small working groups. From these interviews, we found that the benefits of collocation (awareness of shared interests) often do not extend beyond the group. In response to this issue, we designed a system that senses group member’s interests via e-mail analysis software and displays relationships between members on public and private displays to encourage conversation about those topics. The Hebb system includes interest sensors, presence sensors and public and private displays (see Figure 3). The interest sensor generates name and keyword event pairs. Keywords are generated from user e-mail. The interest sensor also makes available encrypted full document data for use on personal PDAs. The presence sensor generates unique user identifiers (UIDs) based on users sensed in the space via either RFID badging or presence of the user’s PDA on the local wireless network. The public display generates events indicating from which document keywords were recently displayed. Servers on each component and a remote discovery server handle subscription and networking. We built Hebb because we wanted to know if it was possible to help loosely-coupled small groups build a better awareness of cross-group shared interests. Although we could test portions of the system in the lab, the only way to know if it really changed group dynamics was to deploy it in the field, over a long period of time. Additionally, the complexity of the system and the interaction of multiple devices distributed across both time and space and within the context of other activities made it next to impossible to design a lab study that would give us useful feedback. 2.3.1
Evaluation
Although our early work with Hebb included focused paper prototype work (similar to that in the nutrition study) and interviews, the most important component of our evaluation was a series of field studies. After attempting to recruit several different groups to use the system, we deployed it with two research groups in
the same department. We were able to install the system with one group immediately, but the installation with the other group stalled and we eventually redeployed that installation with the author’s research group. Our first attempts to recruit groups to use the system were met with an unexpected resistance. We gave multiple presentations for multiple work groups but found it difficult both to find support for the system and to convey an appropriate conceptual model of the system. Some groups rejected the system outright because they felt it would “increase e-mail spam” and that the public displays would “end up showing random ads.” Further interviews with these groups showed that these responses seemed to reflect more an accepted ideology about technology, combined with little previous experience with novel technologies. Thus, we faced a chicken and egg problem: It was difficult to convince someone who had not used our system or other novel technology to use Hebb, even though once deployed it was quickly accepted by our participants. We scaled down our hopes of deploying the system to a group that was unbiased with respect to Ubiquitous computing, and eventually settled on two academic research groups. Interviews revealed that these groups shared a considerable amount of work practice experiences but nonetheless did not communicate with one another. Thus, the two groups seemed a good match for the Hebb system. Even then, we ran into problems regarding acceptance of technology. One of these groups readily accepted the system. However, we found it difficult to convince the other group that the system was secure. Also, some users vehemently rejected the notion of an e-mail sensor. Again, explanations of the system’s privacy assurances, that only high-level data would be transmitted and that the sensor could be easily turned off, did little to placate these users. After negotiations with this lab stalled, we deployed the system to two other academic research groups working on similar topics. The groups were spread across three different spaces: one group of three members (two female graduate students and one male graduate student) was collocated while the other group of four (two male graduate students, one female graduate student and one male staff member) was split between two spaces. This particular arrangement allowed us to determine how well the system supports intra- and inter-group awareness and communication. We deployed the interest sensor first for four weeks to establish common e-mail patterns and then deployed the rest of the system for another four weeks. During the deployment, we logged all user interactions with the public and private display. We also monitored and interviewed user groups to determine use that does not appear in logs. We were particularly interested in ascertaining the extent to which participants used the public display to maintain peripheral awareness of other user’s interests. We also cataloged situations in which users verbally discussed something that they noticed on the display without interacting with the system in any way. Analysis of the data showed that the system helped increase awareness and communication between study participants. In particular, we found that users tended to e-mail each other more regularly after the deployment than before. Also, we found that users attitudes toward the implicit sensing carried out by the interest sensor evolved from strongly against at the beginning of the deployment to acceptable towards the end. Another finding was that users showed a strong desire to have the peripheral display separate from their work display. We also discovered that in peripheral displays visual onset (e.g., objects appearing and disappearing but never moving) captured user attention while not causing annoyance. 2.3.2
Summary
Overall, we found it difficult to deploy this system both because participants had difficulty understanding the model of interaction and because it was difficult and time consuming to discover errors and update the system in the field. However, we found that users began adapting to the system rapidly and derived value from it.
3
Implications for evaluating Ubicomp applications
In our case studies, we struggled to balance quality of evaluation and ease of prototyping. We found interactivity to be the most important aspect of a system for this balance.
3.1
Non-interactive prototypes
We used non-interactive prototypes in all three projects. In our Nutrition Tracking study, we modified our food pyramid in an attempt to create something that was intuitive and easy to read at a glance, with a low learning curve. Our approach to this was static and our results were limited. However, we were able to address the very specific issue of “readability” with respect to the modified food pyramid. Our Nutrition Tracking paper prototype could not help us to assess the quality of our recommendations. They depended on having weeks of data that we could not gather and integrate without a working system, which would have been much more time consuming to construct. This data is particularly difficult to acquire because the system had to be embedded in participants’ regular shopping routine. In our Hebb study, we evaluated paper prototypes of the public display. While we gained some feedback on the graphics used in the display itself, we found that we were unable to evaluate the “peripherality” of the display. Because the display lacked interactivity we had to update it by hand, making it difficult to monitor the display while focusing on some other task. In the PALplates project, we used non-interactive prototypes in field settings. Paper prototyping was very effective for several of the things we needed to test. Most importantly, it enabled us to quickly deploy enough prototypes to give users a sense of ubiquity and to get solid feedback on our idea of point-of-need computing. Additionally, paper was an excellent medium for supporting a discussion forum that was placebased. However, paper prototyping has some serious limitations. In particular, as it stands, paper prototyping fails to adequately handle scale (Liu et al. arrived at a similar finding (2003)). For example, in PALplates, we were could only update our displays once daily. We were unable to simulate finer-grained control such as updating the printer status each time a job began or ended, or updating a map showing the current location of everyone in the building. Also, with human “agents” it was difficult to demonstrate realistic errors in the PALplates project. Instead, things were perhaps too perfect. Given the number of volunteers needed to run the system, anything more sophisticated would have required too much training. Also, participants knew humans were involved, and expected fairly accurate, consistent behavior. Our recommendations for non-interactive prototypes are: • Paper prototyping is useful for rapid iteration of graphic designs in lab settings and for getting early feedback on the situated use of an application. • But paper prototyping is not as useful for testing interactivity or peripherality in lab settings. Also, paper prototyping cannot be scaled and generalized, is problematic for synchronous activities, and is a difficult medium for testing error and ambiguity.
3.2
Interactive prototypes
We used field experiments with interactive prototypes in the Nutrition Tracking and Hebb projects. The biggest lesson we learned from the Nutrition Tracking project was the difficulty of accurately assessing the problems and potential of a system that must integrate unobtrusively into a daily life activity. Our early interviews failed to alert us that our system would not integrate well into shopping patterns. Also, the field experiment helped indicate at what level of ambiguity was acceptable to users. In the Hebb deployment, we again found unobtrusiveness difficult. In particular, it is important that updates are minimized to maintain the unobtrusiveness of the system. Upon deploying the system several needs and bugs arose that were not previously anticipated and software and hardware had to be fixed in situ. One way to mitigate the effect of these reinstallations is to use public and remotely accessible (or accessible by the local champion) components rather than purely private ones. In many cases, such as cellular phone deployments, it is necessary to install private applications, but they should be as lightweight as feasible. Users would much rather be told that there was a change in the system than have to manifest it. Another approach that we found useful to mitigate the obtrusiveness of the system was recruiting a “local champion.” Such a person must be a member of the deployment group, knowledgeable about the group and capable of selling the technology to administrators and directors while eliciting grassroots support for the adoption of the technology. In our deployment, the only successful installation outside of our lab depended
on such a person. Past work has shown the presence of local champions to be important in integrating a technology with existing patterns of work and to encourage uptake (Rogers, 2003). However, we found that users’ attitudes toward the system changed as the system became less remarkable and more unobtrusive. The use of all applications evolves with time, but this evolution is exacerbated in Ubicomp applications because they represent a new interaction paradigm for users. In our study, participants tended to adapt their use and perception of peripheral output technologies over the course of the deployment. While at first users found it difficult to overcome using common technologies in new ways, they eventually adapted and felt comfortable with these new use modes. This finding resonates with other work in which ”adaptation, consideration and time” were necessary for Ubicomp technologies to succeed in everyday situations (Fitton and Cheverst, 2003). We also found a shift in user attitudes with regards to privacy. Privacy is a major concern for any centralized Ubicomp system because a plethora of user data could potentially be collected without the user’s explicit consent. We found that the balance between privacy and usefulness was always in flux during our deployment. At first, we thought that because the public displays showed limited information there would be few privacy concerns. But in fact users were so concerned with the data mining done by the interest sensor that the public display was unimportant. Finally, we found in our deployments that users struggled to develop a conceptual model of the system. But moreover, early attempts to deploy the system revealed that the users felt that they were involved in an experiment that did not hold any benefits for them: they felt as though they were “guinea pigs” testing an already developed system. A better model might be to involve these users in early stages of the iterative design process. Our recommendations for field experiments with interactive prototypes are: • Field-based interactive prototypes provide invaluable feedback on the use and co-evolution of a system. • But field-based interactive prototypes are difficult and time consuming to deploy, and it is difficult to maintain them unobtrusively. • Designing for remote updates and using local champions and participatory design may mitigate these issues.
4
Future work: partially interactive prototypes
As mentioned, it is particularly important to test Ubicomp applications in field settings. And while the approaches we discuss above can help, it is still difficult to field test and maintain a fully implemented system. Thus, there is a need for tools that allow researchers to deploy rapidly Ubicomp applications in field settings. These tools should have the positive characteristics of paper prototyping (ease of creation and deployment) but should also be scalable and interactive. While some tools are emerging for rapid field testing (Sinha and Landay, 2003; Li et al., 2004), much work remains to be done.
5
Conclusions
We presented lessons learned from evaluating three different Ubicomp systems at different stages of design. These lessons should be of benefit to researchers requiring insights into issues such as when to expose users to different fidelities of prototype and the range of benefits and costs associated with the deployment of prototype Ubicomp systems. Specifically, our findings suggest that developers use paper for testing graphic designs and early stage prototypes and use local champions and participatory design to mitigate the difficulties of field deployments of interactive prototypes. We hope this work encourages researchers to continue to bridge the gap between ease of iteration and experimental realism.
References Carter, S., Mankoff, J., and Goddi, P. (2004). Building connections among loosely coupled groups: Hebb’s rule at work. Journal of Computer Supported Cooperative Work, 13:305–327. Consolvo, S., Arnstein, L., and Franza, B. R. (2002). User study techniques in the design and evaluation of a ubicomp environment. In Proceedings of Ubicomp 2002, volume 2498 of Lecture Notes in Computer Science, pages 73–90. Fitton, D. and Cheverst, K. (2003). Experiences managing and maintaining a collection of interactive office door displays. In EUSAI’03, pages 394–409. Hankinson, S., Colditz, G., Manson, J., and Speizer, F., editors (2001). Healthy Women, Healthy Lives: A Guide to Preventing Disease. A Harvard Medical School book. Simon & Schuster Inc. Li, Y., Hong, J. I., and Landay, J. A. (2004). Topiary: A tool for prototyping location-enhanced applications. In Proceedings of the ACM Symposium on User Interface Software and Technology (UIST’04), pages 217– 226. ACM Press. Liu, L. and Khooshabeh, P. (2003). Paper or interactive? a study of prototyping techniques for ubiquitous computing environments. In Proceedings of the Conference on Human Factors in Computing Systems (CHI’03). ACM Press. Mankoff, J., Dey, A. K., Hsieh, G., Kientz, J., Ames, M., and Lederer, S. (2003). Heuristic evaluation of ambient displays. In Proceedings of the Conference on Human Factors in Computing Systems (CHI’03), pages 169–176. ACM Press. Mankoff, J., Hsieh, G., Hung, H. C., Lee, S., and Nitao, E. (2002). Using low-cost sensing to support nutritional awareness. In Proceedings of Ubicomp 2002, volume 2498 of Lecture Notes in Computer Science. Springer-Verlag. pp. 371–378. Mankoff, J. and Schilit, B. (1997). Supporting knowledge workers beyond the desktop with PALPlates. In Extended abstracts of the Proceedings of the Conference on Human Factors in Computing Systems (CHI’97), pages 550–551. ACM Press. Muller, M. J. (1992). Retrospective on a year of participatory design using the PICTIVE technique. In Proceedings of the Conference on Human Factors in Computing Systems (CHI’92), pages 455–462. ACM Press. Rettig, M. (1994). Practical programmer: Prototyping for tiny fingers. Communications of the ACM, 37(4):21–27. Rogers, E. (2003). Diffusion of Innovations. Free Press. Sinha, A. K. and Landay, J. A. (2003). Capturing user tests in a multimodal, multidevice informal prototyping tool. In Proceedings of the 5th International Conference on Multimodal Interfaces (ICMI-03), pages 117– 124, New York. ACM Press.