Nov 18, 2011 - asking for person and household characteristics, three psychometric scales covering the ... I would cheat a fair amount on my income tax *. R9.
Psychometric scales for risk propensity, environmentalism and and variety seeking 1
P SYCHOMETRIC SCALES FOR RISK PROPENSITY, ENVIRONMENTALISM AND AND VARIETY SEEKING 9TH INTERNATIONAL CONFERENCE ON SURVEY METHODS IN TRANSPORT: TERMAS DE PUYEHUE, CHILE, NOVEMBER 14-18, 2011 Nadine Schüssler (Corresponding Author), IVT, ETH Zurich, CH-8093 Zurich Kay W. Axhausen, IVT, ETH Zurich, CH-8093 Zurich
ABSTRACT There is a growing understanding in the transport modelling community that sociodemographic attributes are not sufficient to characterise travellers and to model their travel behaviour. Thus, an increasing number of studies integrate latent variables representing attitudes and perceptions in their choice models. Since it is impossible to measure latent variables directly psychometric scales are used as indicators. In this paper psychometric scales for risk propensity, environmentalism and variety seeking are presented that were developed with the aim to use them in latent variable models for mode and public transport connection choice. To achieve this goal, a two-step study was designed. The first step of the survey is a paper-and-pen mail-out survey in which the psychometric scales are complemented by a one-day travel diary and a household and person characteristics questionnaire. In the second step, the scales are employed in a web-based survey and combined with a one-week GPS-based travel diary. This paper focusses on the first part of the survey and discusses the sample structure, the overall response patterns and the usability of the psychometric scales for characterising the respondents’ attitudes and integrating them into latent variable models.
1
INTRODUCTION AND RELATED WORK
In recent years, there is a growing understanding in the transport modelling community that socio-demographic attributes are not sufficient to characterise travellers and to model their travel behaviour. Thus, an increasing number of studies integrate latent variables representing attitudes and perceptions in their choice models. Since it is impossible to measure latent variables directly, psychometric scales are used as indicators. The traditional way of accounting for attitudes and perceptions in transport models is to measure them employing psychometric scales, reduce them with factor analysis and use the factor score in a regression or discrete choice model. However, recent methodological progress has led to a more sophisticated way of integrating attitudes and perceptions into choice models. Since attitudes and perceptions cannot be observed directly, they are modelled as latent variables for which the psychometric indicators serve as manifestations. The modelling framework for this was presented by Ben-Akiva et al. (2002) and consists of two components. The measurement model describes the relationship between the indicators and the psychological factors whereas the structural model explains the psychological factors with the help of person characteristics and, thus, allows the analyst to distinguish between the influence of person characteristics on the latent variable and their effects on other aspects of the decision. The applications of psychometric indicators in transport behaviour models cover a variety of different topics. On the one hand, there are the short term decisions such as route choice, mode choice or the number of trips per day. On the other hand, there are long-term decisions like residential location choice or the choice of the number and type of vehicles. While some topics have been addressed from very different angels, the attitudes and perceptions accounted for in other choice contexts are rather limited. The prime example for a choice context approached from varying directions is mode choice. The attitudes and perceptions investigated so far range from the perception of mode related characteristics – such as reliability (Prashker, 1979) and convenience of usage (Atasoy et al., 2011) – over habits (Tudela et al., 2011; Vij et al., 2011) and social norms (Galdames et al., 2011) to lifestyle in general and environmentalism in particular (Kitamura et al., 1997; Schwanen and Mokhtarian, 2005; Johansson et al., 2006; Atasoy et al., 2010). Then again, the influences of attitudes on car route choice has just recently been gained attention. First attempts have examined how the willingness to take risks (Tsirimpa et al., 2010) or the tendency to be a car-lover (Abou-Zeid et al., 2011) interact with route choice decisions.
Psychometric scales for risk propensity, environmentalism and and variety seeking 3
The main determinant explored with respect to residential location choice (Gärling et al., 1998; Mokhtarian and Salomon, 2001; Cao and Mokhtarian, 2005; La Paix et al., 2011), vehicle ownership (Choo and Mokhtarian, 2007) and the propensity to travel (Bagley and Mokhtarian, 1999) is the – actual or aspired – lifestyle of a person. Since these three choice dimensions are also inherently linked with each other, as shown by Kitamura et al. (1997) and La Paix et al. (2011), it is, however, an open research issue whether this linkage can be exhaustively explained by the lifestyle or if there are still other factors accountable. A completely different direction – that is, however, equally important for the travel survey methods community – was explored in the recently published study by Hess and Stathopoulos (2011) who try to explore how the engagement of a survey participant in the survey influences their behaviour in a stated preference mode choice experiment by modelling the engagement as a latent variable. This paper continues the line of research on measuring attitudes and perceptions that can be used as latent variables in choice models. The aim is to identify scales that are most effective in measuring the respondents’ attitudes and to establish how these attitudes can best be integrated into latent variable choice models. Under investigation are risk propensity, environmentalism and variety seeking and their influence on mode and public transport connection choice. Several of the studies mentioned above have already shown that a positive attitude towards protecting the environment leads to a higher probability of choosing public transport. The assumption regarding risk propensity is that risk averse persons are more prone to use the car and to choose public transport connections with fewer number of transfers. With respect to variety seeking, it is assumed that persons who search for variety in their life are more eager to experiment and have therefore bigger choice sets. In order to investigate these effects, a two-step study was designed. The first step is a paper-andpen mail-out survey in which the psychometric scales are complemented by a one-day travel diary and a household and person characteristics questionnaire. The second step combines the psychometric scales with a GPS-based travel diary. The participants are recruited via telephone, asked to carry a person-based GPS receiver for a week and to fill out the psychometric scales and the household and person questionnaire online. Moreover, they take part in a web-based prompted recall survey in which they confirm and correct the results generated by the automatic post-processing of their GPS tracks. The design of the second part of the survey is described in the parallel paper by Schüssler et al. (2011). This paper focusses on the first part, the paper-and-pen survey. The discussion includes
an analysis of the response patterns and the sample structure. The answers to the psychometric scales are evaluated in terms of their usability for the characterisation of travellers, their attitudes and the relationship between attitudes and travel behaviour. The remainder of this paper is structured as follows. In the next section, the design of the paper-and-pen study and particularly of the psychometric scales is discussed. Then, the response patterns are analysed with respect to the overall response rate and the socio-economic characteristics as well as the response to individual scale items. Subsequently, the answers to the psychometric scales are analysed with the aim to identify the scale items that are not suitable for differentiating between the respondents’ attitudes and to obtain first indications on how the attitudes can be integrated into latent variable choice models. The paper ends with conclusions and an outlook on further work. 2
SURVEY DESIGN
The paper-and-pen survey evaluated in this paper consists of three components: a questionnaire asking for person and household characteristics, three psychometric scales covering the topics risk propensity, variety seeking and environmentalism and a one-day travel diary. The personand household questionnaire and the diary are slightly adapted versions of the ones used by Weis et al. (2010). The household and person questionnaire asks for a large variety of socioeconomic variables whereas the trip diary included, beside the standards set of trip and activity characteristics, questions concerning the number of accompanying persons and the planning horizon of the trip. The major part of the survey, however, were the three psychometric scales. They were designed following an extensive literature review that is briefly summarised below. In total, 2000 questionnaires were sent out to respondents living in Canton Zurich in 2 waves during summer and fall 2010. After the first wave, a problem with the age distribution of the addresses bought from an address vender was discovered. About 45% of the respondents were 65 years or older. Thus, the second wave was restricted to persons younger than 65 years of age. For the diary, the respondents were assigned a survey day that was a Tuesday, Wednesday or Thursday to capture only ordinary weekdays. The potential respondents were asked to send back the questionnaires within a week after the assigned survey day in a postpaid return envelope. In case they did not do this, they recieved a reminder via mail including a new assigned survey date.
Psychometric scales for risk propensity, environmentalism and and variety seeking 5
2.1
Design of the psychometric questionnaires
Corresponding to the three attitude domains that are investigated in this study, three separate scales have been developed: one measuring the risk propensity of the respondents, one addressing their attitude towards the environment and environmental protection and one quantifying the level of variety the persons seek in their life. Each scale is presented to the respondents with a 5-point agree-disagree scale. To minimise effects resulting from the order of the scale items, their order is determined randomly with three different random orders for each scale. Risk propensity There is a growing understanding in risk propensity research that a person’s degree of risk taking does not only depend on individual, group and cultural factors but also on the domain in which the risk occurs. While it is still an open research issue whether this is caused by variations in the attitude towards risk over different domains or by varying perceptions of risks, Weber et al. (2002) argue that for the modelling and prediction of risk behaviour this distinction is irrelevant and that it is sufficient to observe the person’s risk behaviour in the domain of interest. They derived an extensive 101 item risk propensity scale that covers five risk domains – namely financial, health and safety, recreational, ethical and social risks. Nicholson et al. (2005) added the domain of career related risks to this set to derive their "Risk Taking Index" which they tested with the relationship between risk taking and performance among financial traders in investment banks. They found that risk propensity in any domain is strongly rooted in one’s personality and that personality traits associated with risk taking are extraversion and openness whereas neuroticism, agreeableness, conscientiousness usually are accompanied by risk averseness. Lepp and Gibson (2003) and Hatfield and Fernandes (2009) used the risk propensity of their respondents to explain certain aspects of their transport behaviour. Lepp and Gibson (2003) analysed the influence of novelty seeking and risk perception on the choice of international tourism destinations. They learned that familiarity seeking travellers perceive higher degrees of risk compared to novelty seeking travellers and that this combination is – besides past experience with travelling abroad – the major influence on the type of journey and the destination choices. Hatfield and Fernandes (2009) studied the driving behaviour of young drivers and how it is influenced by their risk propensity. They found that young drivers show higher levels of risky driving despite their higher perception of risks but that there are several motives for risky driving, such as sensation seeking or peer pressure, that are strongly present for young drivers, especially for males. The risk propensity scale used in this study is shown in Table 1. It combines a reduced version
Table 1: Scale items measuring the attitude towards risk
Code R1 R2 R3 R4 R5 R6 R7 R8 R9 R10 R11 R12 R13 R14 R15 R16 R17 R18 R19 R20 R21 R22 R23 R24 R25 R26 R27 R28 R29 R30 R31 R32 R33 R34 R35 R36 R37 R38 R39 R40 R41 R42
Question I admit if my taste differs from that of my friends * I argue with a friend if we have different opinions * I ask my boss for a raise when I think that I earned it * I would date a coworker * I would openly disagree with my boss in front of my coworkers * I speak my mind about unpopular issues at social occasions * I wear unconventional clothes * I would cheat a fair amount on my income tax * I still drive home after I had three drinks in the last two hours * I would forge somebody’s signature * I have used cable TV without paying for it * I use office materials provided by my employer for private purposes * I would shoplift a small item (e.g. a lipstick or a pen) * I have at least once used illegally copied software * I go camping in the wild * I ski down slopes that are too difficult for me * I would like to do a safari in Kenya * I would go whitewater rafting at high water in spring * I would go on a 2 week vacation in a foreign country without booking ahead * I engage in dangerous sports, e.g. paragliding * I tried out bungee jumping at least once * I eat food that is beyond its expiration date if is still looks good * I ignore pain as long as possible before consulting a doctor * I rarely use sunscreen before sunbathing * I rarely wear a seat-belt * I would engage in unprotected sex outside a relationship * I usually ride my bike without wearing a helmet * I smoke at least one packet of cigarettes per day * I would co-sign a loan for a new car for a friend * I would invest 10% of my annual income in a blue chip stock * I would invest 10% of my annual income in speculative stocks * I would invest 10% of my annual income in government bonds * I would lend my best friend an amount of money equivalent to one month’s income * I would bet a day’s income in a casino * I would accept a job that is paid solely based on commission * I always take the latest possible public transport connection to the train station I start earlier if I assume that there will be congestion on my route I prefer public transport connections with very short transfer times If I don’t know the way I just start into the general direction and search my way step by step I avoid streets that are occasionally congested I start earlier if I have to drive an unfamiliar route I try to be at the airport at the latest possible time
(*) Source: Weber et al. (2002)
Psychometric scales for risk propensity, environmentalism and and variety seeking 7
of the domain specific risk propensity scale by Weber et al. (2002) with seven additional items for transport related risks. Overall, the scale contains 42 items covering the domains social, ethical, recreational, financial, health/safety and transport-related risks. Environmentalism Due to the increasing awareness of environmental issues, a lot of work regarding the measurement of environmentalism has been published in recent years. One of the earliest and most well-known studies is the land-use and transport behaviour study by Kitamura et al. (1997) who measured environmentalism using a 10 item scale. Subsequently, Schultz (2001) argued that environmental concern has to be differentiated between concern for oneself, other people and the biosphere because different values and awarenesses of harmful consequences are attached to them. Gatersleben et al. (2002) investigated the relationship between environmental attitudes and believes, socio-economics, social science indicators of pro-environmental behaviour and measurements of direct and indirect energy consumption. They found that self-reported pro-environmental behaviour is indeed related to environmental attitudes but only marginally to household energy consumption which is more strongly linked to household size and income. They concluded that environmental attitudes are especially relevant when behavioural changes do not cost too much effort or change in comfort. Still, as soon as people have the financial ability they are tempted to consume more energy. Following the theory of planned behaviour (Ajzen, 1991), Anable (2005) developed a 105 item scale to examine the influence of habits, moral norms, environmental attitudes, felt efficacy and perception of other persons’ behaviour on mode choice and showed that the mode choice behaviour of different attitudinal population segments is indeed very different. After reviewing, amongst others, the scales of these authors, the scales used by Gatersleben et al. (2002) and Kitamura et al. (1997) were judged to be most appropriate for the study at hand. To use the advantages of both scales, they were combined into the 25 item scale presented in Table 2 that takes into account general concern for the environment, awareness of consequences for oneself, others and the biosphere and the evaluation of measures for environmental protection. Variety seeking Compared to the variety of studies employing measures for environmentalism relatively little research has so far been directed towards the quantification of variety seeking and its incorporation in models for daily transport behaviour. The few studies aiming in this direction investigate the phenomenon of travel for its own sake, i.e. undirected travel or travel with unnecessary de-
Table 2: Scale items regarding environmentalism
Code E1 E2 E3 E4 E5 E6 E7 E8 E9 E10 E11 E12 E13 E14 E15 E16 E17 E18 E19 E20 E21 E22 E23 E24 E25
Question I worry about environmental problems * Too much attention is paid to environmental problems * Environmental problems are exaggerated * The attention for the greenhouse effect is exaggerated * I am optimistic regarding the state and future of our environment * Environmental pollution affects my health * Environmental problems have consequences for my life * I can see with my own eyes that the environment is deteriorating * Environmental problems are a risk for the future of our children * Saving threatened species is unnecessary luxury * We should be careful with our environment because we depend on it * Vehicle emissions increase the expenses for health care ** Environmental protection starts with myself * People who do not care about environmental protection avoid their responsibilities * Behavioural change requires more environmental friendly products * Behavioural change requires a right example by the government * Pro-env. beh. is only useful if everybody cooperates and I don’t think this will happen * Environmental protection costs too much ** Environmental protection is good for the economy ** Jobs are more important than the environment ** Stricter vehicle smog control should be enforced ** The price of gas should be raised to reduce pollution ** Using tax dollars to pay for public transport is a good investment ** There should be incentives for using electric vehicles ** Who causes environmental damage should pay to repair it **
(*) Source: Gatersleben et al. (2002) (**) Source: Kitamura et al. (1997)
tours (e.g. Mokhtarian and Salomon, 2001). A wider recognition of the influence of variety seeking on travel behaviour can be found in the tourism literature. Examples are the studies by Bello and Etzel (1985) and Niininen et al. (2004) who investigated the role of variety seeking and consumer loyalty on holiday destination choice. Bello and Etzel (1985) derived their own 50 item scale and asked respondents to evaluate their most recent trip for more than 2 nights with respect to – amongst others – novelty of the experience. They concluded that novelty seekers felt the trip to be more deserved, gave more importance to the pleasure aspect of the holiday
Psychometric scales for risk propensity, environmentalism and and variety seeking 9 Table 3: Scale items evaluating the variety seeking tendency
Code V1 V2 V3 V4 V5 V6 V7 V8 V9 V10 V11 V12 V13 V14 V15 V16 V17 V18 V19 V20 V21 V22 V23 V24 V25 V26 V27 V28
Question I like to experience novelty and change in my daily life * I sometimes look for ways to change my daily routine * I like to have lots of activity around me * I prefer a clearly structured, repetitive daily schedule Reoccurring rituals give me a feeling of control and security I love surprises A week in which all my evenings are similar bores me Shops with exotic herbs and fragrances fascinate me * When eating out I like to try unusual items * The content of my shopping cart looks pretty much the same all the time I buy only trendy clothes I prefer seasonal fruits and vegetables I actively search for bands whose music I do not yet know I always shop at the same supermarket I like to explore unknown towns or parts of my town I prefer to spend my holidays always at the same location I prefer having drinks always at my regular pub I like to try new types of sports Cultures completely different from my own fascinate me I prefer to organise my holidays spontaneously I always keep an open door for surprise visitors I like to meet new people I like to explore new places in my town or new towns ** I like to try new routes to familiar destinations I sometimes take a longer route to see something new I like to drive around just for the fun of it When commuting I always take the same route I like to meet new people while travelling by train
(*) Source: Mehrabian and Russell (1973) (**) Source: Weber et al. (2002)
and spent more time and money on it. Niininen et al. (2004), who used the Arousal Seeking Tendency scale by Mehrabian and Russell (1973), found that there is a link between the need for variety and the patterns of holiday destination choice but that this link is only modest. Since none of the scales reported in the literature was completely satisfactory and the author of
Table 4: Response rates in the paper and pen survey
Sent out Invalid addresses Reminder Valid addresses Returned questionnaires Returned questionnaires Invalid hh & person quest. Invalid psychom. scales Invalid diary Valid questionnaires
Sample 1 1000 26 – 974 117 117 4 4 12 100
Sample 2 1000 28 856 972 157 157 5 13 22 122
Total [%] 100.0 2.7 85.6 100.0 14.1 100.0 3.3 6.2 12.4 81.0
the Arousal Seeking Tendency scale would make it only available for face-to-face interviewing, we constructed our own scale including some of the questions reported by Mokhtarian and Salomon (2001). The variety seeking scale reported in Table 3 contains 28 questions measuring the desire for variety in the daily routine in general and in shopping, eating, recreational activities and transport behaviour in particular. 3
RESPONSE PATTERNS
Table 4 shows the overall response statistics for the paper-and-pen survey. In total, 2000 letters were sent out in two waves of which 2.7% were returned due to invalid addresses. The reminder letter was sent out to 856 potential respondents of the second wave with the aim to increase the response rate. Of the 1946 potential respondents with valid addresses 274 returned at least one questionnaire resulting in a response rate of 14.1%. However, not all of the returned questionnaires were usable for later analysis. Some respondents answered only one or two of the three questionnaires or left out several questions. The trip diary, however, seems to have caused the most difficulties leading to 34 questionnaires that were unusable even after careful manual correction by the analysts. With respect to the usability of the psychometric scales, a questionnaire was sorted out if more than one third of the psychometric scale items were left blank. Altogether, the questionnaires of 222 persons remained after cleaning for subsequent analysis. To evaluate the representativeness of the study, the household and person characteristics of the respondents were compared to the weighted persons and households in the Microcensus
Psychometric scales for risk propensity, environmentalism and and variety seeking 11 Table 5: Socio-economic attributes of the respondents compared to the Microcensus 2005
Attribute male Gender female < 25 25 - 34 35 - 44 Age 45 - 54 55 - 64 >= 65 None Obligatory school Matur Apprentice Education Prof. diploma Univ. of appl. sc. University In training Full time employed Part time employed Employment status Unemployed Housewife/-husband Retired 1 2 3 Household size 4 >= 5 < 4’000 4’000 - 8’0000 Monthly HH income 8’000 - 12’000 12’000 - 16’000 > 16’000 yes Driving license no Always Car availability Sometime Never Nationwide season ticket Halbtax PT subscriptions Other PT sub. None
Study participants [%] 48.6 51.4 0.0 10.4 19.4 25.2 27.5 16.7 1.4 3.2 5.4 38.7 10.8 24.3 16.2 1.4 46.4 26.1 2.3 5.4 18.0 25.7 37.4 14.0 16.2 6.3 6.3 38.7 23.9 17.6 10.8 90.5 9.5 65.3 19.4 13.1 14.9 59.5 50.9 13.1
MZ 2005 [%] 48.8 51.2 20.3 15.5 18.3 15.1 13.5 17.2 2.6 12.9 7.0 49.1 9.7 7.0 11.7 16.8 37.6 16.6 2.9 6.2 18.8 32.9 37.1 12.1 13.2 4.7 20.6 46.8 21.5 7.0 4.1 79.7 20.3 72.7 20.8 6.5 8.6 26.3 17.3 38.0
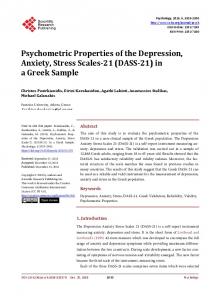
Figure 1: Share of missing values for the risk propensity scale
2005 - the Swiss national travel survey - living in the study area. The comparison is presented in Table 5. As expected, there is an under-representation of young respondents and small households and an over-representation of persons with high education, high income, a part or full-time employment and households with four or more members. Moreover, there is a considerably higher share of driving license and public transport subscription holders and a lower share of persons that have always a car available, implying that our sample is probably more mobile and more public transport oriented than the average population of Canton Zurich. As discussed above, not all respondents indicated their level of agreement to each of the scale items. While some respondents only filled out very few items and were consequently excluded from further analysis, others left only some questions blank. Thereby, certain scale items were left out more often than others. In order to better understand the developed scales, a closer look is taken at these scale items in the following. Figure 1 compares the number of missing answers per risk propensity scale item for the responses usable for model estimation with those that were sorted out. As expected, the overall number of missing answers is higher for the persons that are sorted out and certain scale items clearly posed bigger problems for the respondents than others with one scale item clearly outstanding. This is scale item R3 "I ask my boss for a raise when I think that I earned it". Other
Psychometric scales for risk propensity, environmentalism and and variety seeking 13 Figure 2: Share of missing values for the environmentalism scale
scale items that were often left out were R5 "I would openly disagree with my boss in front of my coworkers", R15 "I go camping in the wild", R35 "I would accept a job that is paid solely based on commission" and R12 "I use office materials provided by my employer for private purposes". Interestingly, nearly all of these scale items are related to work topics and about one third of the participants who left these scale items out were at least part time employed. Thus, the high number of missing answers cannot only be attributed to persons not being in this kind of situation. Something else makes these items hard to answer. Perhaps it reflects the persons’ conflict of truthfully stating something that is socially less acceptable. For instance, it is widely accepted or even demanded that one should ask for a raise if one earned it. However, a lot of people shy away from it because it bears conflict potential. The patterns of the missing answer distributions for the environmentalism scale presented in Figure 2 differ substantially from those for the risk propensity scale. The overall number of missing answers is considerably lower for the persons usable for model estimations and higher for those that were sorted out. Moreover, there is no scale item that stands out the way that scale item R3 did. Nevertheless, there are some scale items for which answers are missing more often than for others. These are E7 "Environmental problems have consequences for my life", E24 "There should be incentives for using electric vehicles" and E12 "Vehicle emissions increase the expenses for health care". Since there is no apparent reason why these questions
Figure 3: Share of missing values for the variety seeking scale
should be more difficult than others, it will be interesting to see if they will also stand out in the web-based survey or if this is just a coincidence here. For the variety seeking scale, there is again one scale item that clearly stands out in terms of the number of missing values: V27 "When commuting I always take the same route". But this time there is a simple explanation for it. All the persons who did not answer this scale item where retired or working as housewife or househusband, so they do not commute and the question does not apply to them. The other scale items with the most missing values were V17 "I prefer having drinks always at my regular pub" and V7 "A week in which all my evenings are similar bores me". Since, however, these scale items were only left out by four or three persons, respectively, in the group of persons usable for model estimation, this might as well be just a coincidence. The internal consistency of the scales was tested by calculating Cronbach’s alpha for each scale and the answers given by the responses usable for model estimation. All scales perform satisfactory with a Cronbach’s alpha of 0.82 for the risk scale, 0.88 for the environmentalism scale and 0.83 for the variety seeking scale. This finding is also inline with the consistency values between 0.7 and 0.89 reported by Weber et al. (2002) and Gatersleben et al. (2002) for their respective scales.
Psychometric scales for risk propensity, environmentalism and and variety seeking 15
4
ANALYSIS OF THE RESULTS
The analyses presented in this section pursue two goals. On the one hand, they should help to identify the scale items that are not well suited for measuring the respondents attitudes. On the other hand, some first indications should be derived on how the attitudes can be integrated into latent variable choice models. As discussed in the introduction, a latent variable model consists of two components. The measurement model describes the relationship between the psychometric scale items and the underlying psychological factors whereas the structural model explains the psychological factors with the help of person characteristics. Therefore, the results of three analyses are presented in the following. First, an examination of the standard deviation and mean of the answers gives an indication which scale items are not usable to distinguish attitude profiles between respondents. Second, a factor analysis is conducted on each psychometric scale to identify the most dominant underlying psychological constructs before the relationship between these factors and certain socio-economic variables is examined in the third subsection. 4.1
Standard deviation of the answers to scale items
Figure 4 depicts the standard deviation of the answers to each scale item relative to the mean value of the these answers. For this figures some of the scale items were recoded in a way that a low mean value corresponds to risk aversion, low attitude towards environmental protection and low desire for variety. As expected, the mean values for risk propensity are systematically lower than those for environmentalism and variety seeking and those for environmentalism are the highest. The respondents are in general risk averse and environmentally friendly – or at least they like to present themselves that way. The risk propensity scale shows by far the largest range of standard deviations with scale items that have a very low standard deviation and others with a very high one. In contrast, the standard deviation for the variety seeking scale items does not vary much. Since the aim of this analysis is to identify which scale items help the least to distinguish different attitude profiles, the scale items with lowest standard deviation were identified in the next step. For the risk propensity scale these are
• • • •
R26 I would engage in unprotected sex outside a relationship R13 I would shoplift a small item (e.g. a lipstick or a pen) R10 I would forge somebody’s signature R25 I rarely wear a seat-belt
Figure 4: Mean value versus standard deviation of answers to scale items
These questions are mainly ethical questions with a strong social norm that defines them as bad. Accordingly, nearly all respondents stated total disagreement leading to a very low mean value. Regarding the environmentalism scale the scale items with the lowest standard deviation are • • • • •
E11 We should care for our environment because we depend on it E6 Environmental pollution affects my health E13 Environmental protection starts with myself E25 Who causes environmental damage should pay to repair it E9 Environmental problems are a risk for the future of our children
Here, most respondents stated a strong agreement with these statements, reflecting their awareness of environmental consequences and that the ongoing education of the population with respect to environmental protection had at least the effect of creating a strong social norm.
Psychometric scales for risk propensity, environmentalism and and variety seeking 17 Table 6: Results of the factor analysis for risk propensity
Question R1 R2 R5 R6 R8 R9 R10 R13 R14 R26 R31 R35 R41 R42
Factor 1 Admit if my taste differs from that of my friends Argue with a friend we have different opinions Openly disagree with my boss in front of my coworkers Speak my mind about unpopular issues at social occasions Cheat a fair amount on my income tax Drive home after I had three drinks in the last two hours Forge somebody’s signature Shoplift a small item (e.g. a lipstick or a pen) Use illegally copied software Engage in unprotected sex outside a relationship Invest 10% of my annual income in speculative stocks Accept a job that is paid solely based on commission Start earlier if I have to drive an unfamiliar route Try to be at the airport at the latest possible time
Factor 2 – – – – 0.684 0.491 0.508 0.617 0.516 0.471 0.436 – – –
Factor 3 – – – – – – – – – – – 0.489 -0.496 0.566
For the variety seeking scale, the scale items with the lowest standard deviation were V12 "I prefer seasonal fruits and vegetables" and V23 "I like to explore new places" but their standard deviation does not differ much from the scale items with the highest standard deviation, i.e. V8 "Shops with exotic herbs and fragrances fascinate me" and V20 "I prefer to organise my holidays spontaneously" and their mean value is close to three indicating more balanced answers of the respondents. 4.2
Results of the factor analysis
The results of the factor analyses are presented in Tables 6, 7 and 8. In order to improve readability, only the factor scores with an absolute value of at least 0.4 are shown. The factor analysis was conducted with SPSS and the best results were achieved using a principal component analysis and a Varimax rotation with three factors for each scale. Since the risk propensity scale covers such a variety of domains, the three main factors identified in the factor analysis explain only about 26% of the variance. They do, however, follow the domains specified beforehand. The first factor mainly covers ethical risks such as illegal behaviour or cheating someone. The second factor entails mainly scale items that are concerned with transport related risks while the third factor summarises some of the social risks
0.599 0.663 0.453 0.611 – – – – – – – – – –
Table 7: Results of the factor analysis for environmentalism
Question E2 Too much attention is paid to environmental problems E3 Environmental problems are exaggerated E4 The attention for the greenhouse effect is exaggerated E6 Environmental pollution affects my health E7 Environmental problems have consequences for my life E9 Env. prob. are a risk for the future of our children E10 Saving threatened species is unnecessary luxury E11 We should care for our env. because we depend on it E12 Vehicle emissions increase the need for health care E13 A better environment starts with myself E15 Behav. change requires more env. friendly products E16 Behav. change requires a right example by the government E18 Environmental protection costs too much E19 Environmental protection is good for the economy E20 Jobs are more important than the environment E21 Stricter veh. smog control should be enforced E22 The price of gas should be raised to reduce pollution E24 There should be incentives for using electric vehicles E25 Who causes environmental damage should pay to repair it
Factor 1 – – – 0.648 0.517 0.440 – 0.499 0.536 0.483 – – – 0.418 -0.425 0.543 0.506 – 0.513
Factor 2 0.765 0.718 0.695 – – – – – – – – – 0.464 – – – – – –
Factor 3 – – – – – – -0.403 – – – 0.687 0.428 – – – – – 0.536 –
addressed by the scale items. Weber et al. (2002) presented a factor analysis with 5 factors with the intention of having one factor for each of their risk categories financial, health/saftey, recreational, ethical and social risks. However, they found only a distinct factor assignment for ethical, social and recreational risk to one factor each. All other risk areas were distributed over several factors. This finding was confirmed by us in a factor analysis with 6 factors for our model reflecting the six risk areas in our scale. There, only the ethical and social risks were assigned to one unique factor each while all other risk areas where distributed over several factors. The three main factors for environmentalism shown in Table 7 explain about 43% of the variance in the data. The first factor describes the respondents awareness of the negative consequences of environmental pollution and our responsibility to restrict behaviour that is harmful to the environment. The second factor for environmentalism characterises a denial of environmental problems and the attitude that environmental problems are exaggerated and too much
Psychometric scales for risk propensity, environmentalism and and variety seeking 19 Table 8: Results of the factor analysis for variety seeking
Question V1 I like to experience novelty and change in my daily life V2 I sometimes look for ways to change my daily routine V3 I like to have lots of activity around me V4 I prefer a clearly structured, repetitive daily schedule V5 Rituals give me a feeling of control and security V6 I love surprises V8 Shops with exotic herbs and fragrances fascinate me V9 When eating out I like to try the most unusual items V15 I like to explore unknown towns or parts of my town V19 Cultures completely different from my own fascinate me V21 I always keep an open door for surprise visitors V23 I like to explore new places V24 I like to try new routes to familiar destinations V25 I sometimes take a longer route to see something new V26 I like to drive around just for the fun of it V27 When commuting I always take the same route V28 I like to meet new people while travelling by train
Factor 1 – – 0.406 – – – 0.660 0.411 0.665 0.527 – 0.725 – – – – –
Factor 2 – 0.647 – -0.490 -0.442 – – – – – – – 0.624 0.481 0.493 -0.460 –
Factor 3 0.443 – – – – 0.628 – – – – 0.406 – – – – – 0.408
attention is paid to them. The third factor summarises the attitude towards measures for environmental protection. For variety seeking, only 33% of the variance is explained by the three main factors found in the factor analysis, but they are more diverse in their interpretation than the factors for environmentalism or risk propensity as can be seen in Table 8. The first factor describes a desire for making new experiences by trying new food, visiting new places and getting in contact with cultures different from those of the respondents. The second factor characterises a completely different type of variety seeking. Persons who score high on this factor search for (small) variations from their daily routine. Therefore, this factor is called interest in varying one’s daily routine. Finally, the third factor captures a liking for surprises and unexpected changes. 4.3
Socio-economic profiles of the factors
The subsequent Figures 5, 6 and 7 show the distribution of factor scores for different population segments and the first two factors of each scale. The population segments were chosen based on the strongest correlation between the factor scores and the socio-economic characteristics.
Figure 5: Relationship between socio-economic variables and risk propensity
(a) Ethical risks and education
(b) Ethical risks and employment status
(c) Transport related risks and gender
(d) Transport related risks and income
If these socio-economic characteristics are indeed the most important influence factors has to be tested in the latent variable model estimation. The most distinct relationship between ethical risks and population segments was found for the level of education and the employment status. The more educated respondents tend to indicate a higher propensity to take ethical risks as do persons who are at least part time employed compared to persons who are retired, unemployed or housewives/-husbands. The sample size for persons in training is too small to draw any reasonable conclusions for them. The propensity to take transport related risks strongly depends on the gender and the income
Psychometric scales for risk propensity, environmentalism and and variety seeking 21 Figure 6: Relationship between socio-economic variables and environmentalism
(a) Environmental awareness and number of cars in household
(b) Environmental awareness and bike ownership
(c) Environmental denial and number of cars in household
(d) Environmental denial and education
of the respondents. Male respondents are more likely to take this kind of risks as are persons with higher household incomes. Both effects were expected based on the assumption that people with a higher value of travel times savings are likely to be more risk prone in transport decisions and males and persons with higher incomes tend to have higher values of travel time savings. For the awareness of environmental problems, the most distinct relationship between factor score distribution and socio-economic variables can be seen for the number of cars in the household and bike ownership. The higher the number of cars in the household the lower the factor
Figure 7: Relationship between socio-economic variables and desire for new experiences
(a) Desire for new experiences and number of trips reported
(b) Desire for new experiences and gender
(c) Interest in varying one’s daily routine and number (d) Interest in varying one’s daily routine and number of cars in household of household members
score tends to be, whereas the availability of at least one bike in the household leads by trend to a higher factor score. This is inline with the expectation that environmentally aware households use more environmentally friendly modes and are correspondingly equipped with the matching mobility tools. Analogously, a higher number of cars in the household leads to an increased tendency to deny environmental issues. More interesting, however, is the influence of education on the denial factor. High factor scores for this variable are only found by less educated respondents. This might indicate that less educated persons are not well reached by education programs address-
Psychometric scales for risk propensity, environmentalism and and variety seeking 23
ing environmental problems and protection. The desire for new experiences seems to be related to the number of trips the respondents made on the survey day with persons scoring high on the new experiences factor also making more trips than others. This is reasonable since one would expect that persons who like new experiences are also more active than others. Another possible segmentation is by gender because the females in our study have a higher desire to make new experiences than males. The interest in varying one’s daily routine depends most heavily on the number of household members. The bigger the household the smaller is the factor score maybe because a large household itself provides enough variation in the daily schedule. Another socio-economic variable that influences the interest in varying one’s daily routing is the number of cars in the households. This is counterintuitive but to some extent the number of cars is correlated with the household size. 5
CONCLUSION AND OUTLOOK
This paper investigates the suitability of three psychometric scales – one for risk propensity, one for environmentalism and one for variety seeking – for measuring the attitudes of the respondents and incorporate these attitudes into latent variable models. Therefore, several analyses are conducted. First, the response patterns for this relatively new type of survey are analysed. Second, the scale items that were least suitable for differentiating respondents are searched. Third, first insights into how the attitudes can be integrated into choice models are gained. The overall response rate was in the expected range taking into account the high burden on the respondents. However, 20% of questionnaires had to be removed, mainly because the diaries could not be interpreted. The socio-economic characteristics of the sample were in-line with previous studies with an over-representation of persons that are highly educated, have a high income, live in large households and are more mobile and public transport oriented than the average population in the sampling area. Regarding the response patterns of the individual scale items, some scale items appeared to be more difficult to answer than others, probably because they reflected the persons’ conflict of stating something that is socially less acceptable. When analysing the standard deviation of the individual scale items, it can be seen that the three scales cover substantially different ranges of standard deviations. While the standard deviations of the answers to the scale items of the variety seeking scale are very similar to each other, the environmentalism and especially the risk propensity scale show distinctively different answer
patterns depending on the scale item. In particular, there were a few scale items for which pretty much all the respondents provided similar answers. These were typically scale items connected to strong social norms. Thus, it is questionable if these scale items are suitable to differentiate respondents. In the subsequently conducted factor analysis, several factors are established that can be tested in transport behaviour models. Ethical and transport related risks are the most interesting factors regarding risk propensity while the awareness of negative consequences and the denial of the environmental problems should be used as indicators for environmentalism and for variety seeking the desire for making new experiences and the interest in varying one’s daily routine should be tested. For each of the these factors different socio-economic variables seem to be relevant and should be checked in the structural component of the latent variable models. For risk propensity gender, education, income and employment status were most promising whereas for environmentalism these were education, number of cars and bike ownership and for variety seeking gender, household size, number of trips on survey days and number of cars. As a next step, these findings will be used to estimate latent variable models for mode choice based on the one-day diaries that were collected together with the psychometric scales. Thereby, the attitudinal factors established above will be tested individually and combined and in association with different socio-economic characteristics. Afterwards, the more extensive dataset derived from the web-based survey with the one-week GPS diary will be exploited. First, it will be checked whether there is a systematic difference in the answering patterns compared to those described in this paper taking into account the potentially different socioeconomic composition of the samples. Then, a set of choice models will be estimated to investigate the influence of the attitudes on mode and public transport connection choice and the number of trips made per day.
Psychometric scales for risk propensity, environmentalism and and variety seeking 25
6
ACKNOWLEDGEMENTS
The authors would like to thank the Swiss State Secretariat for Education and Research for funding this research that is part of the research project "Route choice in urban public transport systems" within the COST Action "TU0603 - Buses with high levels of service". Special thanks goes to Eveline Beutler for her support with the field work and data entry.
REFERENCES Abou-Zeid, M., M. E. Ben-Akiva, M. Bierlaire, C. F. Choudhury and S. Hess (2011) Attitudes and value of time heterogeneity, paper presented at the 90th Annual Meeting of the Transportation Research Board, Washington, D.C., January 2011. Ajzen, I. (1991) The theory of planned behavior, Organizational Behavior and Human Decision Processes, 50 (2) 179–211. Anable, J. (2005) “Complacent Car Addicts” or “Aspiring Environmentalists”? Identifying travel behaviour segments using attitude theory, Transport Policy, 12 (1) 65–78. Atasoy, B., A. Glerum and M. Bierlaire (2011) Mode choice with attitudinal latent class: A Swiss case-study, paper presented at the 2nd International Choice Modelling Conference, Leeds, July 2011. Atasoy, B., A. Glerum, R. Hurtubia and M. Bierlaire (2010) Demand for public transport services: Integrating qualitative and quantitative methods, paper presented at the 10th Swiss Transport Research Conference, Ascona, September 2010. Bagley, M. N. and P. L. Mokhtarian (1999) The role of lifestyle and attitudinal characteristics in residential neighborhood choice, in A. Ceder (ed.) Transportation and Traffic Theory - Proceedings of the 14th International Symposium on Transportation and Traffic Theory, Elsevier, Oxford. Bello, D. C. and M. J. Etzel (1985) The role of novelty in the pleasure travel experience, Journal of Travel Research, 24 (1) 20–26. Ben-Akiva, M. E., J. L. Walker, A. T. Bernardino, D. Gopinath, T. Morikawa and A. Polydoropoulou (2002) Integration of choice and latent variable models, in H. S. Mahmassani (ed.) In Perpetual Motion: Travel Behavior Research Opportunities and Application Challenges, 431–470, Elsevier, Oxford. Cao, X. and G. Mokhtarian (2005) How do individuals adapt their personal travel? Objective and subjective influences on the consideration of travel-related strategies for San Francisco Bay Area commuters, Transport Policy, 12 (4) 291–302. Choo, S. and P. L. Mokhtarian (2007) What type of vehicle do people drive? the role of attitude and lifestyle in influencing vehicle type choice, Transportation Research Part A: Policy and Practice, 38 (3) 201–222.
Psychometric scales for risk propensity, environmentalism and and variety seeking 27
Galdames, C., A. Tudela and J. A. Carrasco (2011) Exploring the role of psychological factors on mode choice models using a latent variables approach, paper presented at the 90th Annual Meeting of the Transportation Research Board, Washington, D.C., January 2011. Gatersleben, B., L. Steg and C. Vlek (2002) Measurement and determinants of environmentally significant consumer behavior, Environment and Behavior, 34 (3) 335–362. Gärling, T., R. Gillholm and A. Gärling (1998) Reintroducing attitude theory in travel behavior research: The validity of an interactive interview procedure to predict car use, Transportation, 25 (2) 129–146. Hatfield, J. and R. Fernandes (2009) The role of risk-propensity in the risky driving of younger drivers, Accident Analysis & Prevention, 41 (1) 25–35. Hess, S. and A. Stathopoulos (2011) Linking response quality to survey engagement: A combined random scale and latent variable approach, paper presented at the 2nd International Choice Modelling Conference, Leeds, July 2011. Johansson, M. V., T. Heldt and P. Johansson (2006) The effects of attitudes and personality traits on mode choice, Transportation Research Part A, 40 (6) 507–525. Kitamura, R., P. L. Mokhtarian and L. Laidet (1997) A micro-analysis of land use and travel in five neighbourhoods in the San Francisco Bay Area, Transportation, 24 (2) 125–158. La Paix, L., M. Bierlaire, E. Cherchi and A. Monzón (2011) How urban environment affects travel behaviour? Integrated choice and latent variable model for travel schedules, paper presented at the 2nd International Choice Modelling Conference, Leeds, July 2011. Lepp, A. and H. Gibson (2003) Tourist roles, perceived risk and international tourism, Annals of Tourism Research, 30 (3) 606–624. Mehrabian, A. and J. A. Russell (1973) A measure of arousal seeking tendency, Environment and Behavior, 5 (3) 315–333. Mokhtarian, P. L. and I. Salomon (2001) How derived is the demand for travel? Some conceptual and measurement considerations, Transportation Research Part A: Policy and Practice, 35 (8) 695–719. Nicholson, N., E. Soane, M. Fenton-O’Creevy and P. Willman (2005) Personality and domainspecific risk taking, Journal of Risk Research, 8 (2) 157–176.
Niininen, O., E. Szivas and M. Riley (2004) Destination loyalty and repeat behaviour: An application of optimum stimulation measurement, International Journal of Tourism Research, 6 (6) 439–447. Prashker, J. N. (1979) Scaling perceptions of reliability of urban travel modes using indscal and factor analysis methods, Transportation Research Part A: General, 13 (3) 203–212. Schüssler, N., L. Montini, C. Dobler and K. W. Axhausen (2011) Improving automatic postprocessing routines for GPS observations using prompted-recall data, paper presented at the 9th International Conference on Survey Methods in Transport, Termas de Puyehue, November 2011. Schultz, P. W. (2001) The structure of environmental concern: Concern for self, other people, and the biosphere, Journal of Environmental Psychology, 21 (4) 327–339. Schwanen, T. and P. L. Mokhtarian (2005) What affects commute mode choice: Neighborhood physical structure or preferences toward neighborhoods?, Journal of Transport Geography, 13 (1) 83–99. Tsirimpa, A., A. Polydoropoulou and C. Antoniou (2010) Development of a latent variable model to capture the impact of risk aversion on travelers’ switching behavior, Journal of Choice Modelling, 3 (1) 127–148. Tudela, A., K. M. N. Habib, J. A. Carrasco and A. O. Osman (2011) Incorporating the explicit role of psychological factors on mode choice: A hybrid mode choice model by using data from an innovative psychometric survey, paper presented at the 2nd International Choice Modelling Conference, Leeds, July 2011. Vij, A., A. Carrel and J. L. Walker (2011) Capturing modality styles using behavioral mixture models and longitudinal data, paper presented at the 2nd International Choice Modelling Conference, Leeds, July 2011. Weber, E. U., A.-R. Blais and N. E. Betz (2002) A domain-specific risk-attitude scale: Measuring risk perceptions and risk behaviors, Journal of Behavioral Decision Making, 15 (4) 263–290. Weis, C., C. Dobler and K. W. Axhausen (2010) Stated adaptation survey of activity scheduling reactions to changing travel conditions: Field work and preliminary results, paper presented at the 12th World Conference on Transportation Research, Lisbon, July 2010.