Public library services for visually impaired people Margaret Kinnell, Liangzhi Yu and Claire Creaser Public library services for visually impaired people Library & Information Statistics Unit (LISU) Department of Information Science Loughborough University
ISBN 1 901786 38 2
June 2000
KINNELL, Margaret, YU, Liangzhi and CREASER, Claire Public library services for visually impaired people Loughborough: Library & Information Statistics Unit (LISU), 2000
LISU Occasional Paper no. 26
ISBN 1 901786 38 2
Library and Information Commission Research Report 71 ISSN 1466-2949
STV/LIC Programme Report 5 ISSN 1470-9007
© Library and Information Commission 2000
Published and distributed by Library & Information Statistics Unit (LISU) Loughborough University • Loughborough • Leicestershire • LE11 3TU Tel: +44 (0)1509 223071 • Fax: +44 (0)1509 223072 • E-mail:
[email protected] web: http://www.lboro.ac.uk/departments/dils/lisu/lisuhp.html
Contents Page no. List of tables ................................................................................................................................................ ii List of figures...............................................................................................................................................iii Acknowledgements ................................................................................................................................... iv 1. Introduction ............................................................................................................................................ 1 The impact of information and communication technologies (ICT) ......................................................... 1 Library plans ............................................................................................................................................. 1 Share the Vision and the wider legal/social context ................................................................................ 1 Research design ...................................................................................................................................... 2 Structure of the Report ............................................................................................................................. 4 2. Visually impaired people and the social environment: the context for public library services .... 6 Visual impairment and general support ................................................................................................... 6 Information/reading needs ....................................................................................................................... 7 Reading/information services ................................................................................................................... 8 Campaigns for accessible information ..................................................................................................... 9 Production of alternative formats and copyright clearance .................................................................... 10 Deployment of Access Technologies ..................................................................................................... 11 Issues in the provision of reading/information services to visually impaired people ............................. 12 3. UK public library services to visually impaired people 1970 - 1997 ............................................... 14 Share the Vision ..................................................................................................................................... 15 Share the Vision Survey: 1991 .............................................................................................................. 16 RNIB Survey: 1997 ................................................................................................................................ 16 Public library provision in other countries .............................................................................................. 17 Summary of trends in UK public library services for visually impaired people, to 1997 ........................ 19 4. UK public library services to visually impaired people: 1999 survey findings ............................ 21 Respondents .......................................................................................................................................... 21 Policy statements ................................................................................................................................... 22 Budgetary provision ............................................................................................................................... 25 Staffing ................................................................................................................................................... 28 Partnerships ........................................................................................................................................... 31 Service Evaluation ................................................................................................................................. 32 Understanding users’ needs .................................................................................................................. 33 Materials provision ................................................................................................................................. 35 Equipment .............................................................................................................................................. 39 Provision of library services ................................................................................................................... 39 Promotion ............................................................................................................................................... 42 STV News .............................................................................................................................................. 43
Public library services for visually impaired people
i
5. Conclusions and recommendations ..................................................................................................44 1. Policy statements ..............................................................................................................................44 Recommendation 1.1 ......................................................................................................................44 2. Budgetary provision ...........................................................................................................................45 Recommendation 2.1 ......................................................................................................................45 3. Staffing ..............................................................................................................................................45 Recommendation 3.1 ......................................................................................................................45 Recommendation 3.2 ......................................................................................................................45 4. Partnerships ......................................................................................................................................45 Recommendation 4.1 ......................................................................................................................45 5. Service evaluation .............................................................................................................................46 Recommendation 5.1 ......................................................................................................................46 Recommendation 5.2 ......................................................................................................................46 6. Materials provision.............................................................................................................................46 Recommendation 6.1 ......................................................................................................................46 Recommendation 6.2 ......................................................................................................................46 7. Equipment .........................................................................................................................................46 Recommendation 7.1 ......................................................................................................................47 8. Provision of library services...............................................................................................................47 Recommendation 8.1 ......................................................................................................................47 9. Promotion ..........................................................................................................................................47 Recommendation 9.1 ......................................................................................................................47 References ................................................................................................................................................48 Appendix A: Copy of the survey questionnaire .........................................................................................52
List of tables
ii
Table 1
Page no. Comparison of the major findings of the 1983/84, 1991, 1997 national surveys .......................18
Table 2
Distribution of respondents among the categories of library authority .......................................21
Table 3
Policy and expenditure on materials ..........................................................................................23
Table 4
Staff numbers and expenditure ..................................................................................................29
Table 5
Relationships with other reading service providers ....................................................................31
Table 6
Provision of specialist reading equipment ..................................................................................39
Table 7
Special services provided for visually impaired people..............................................................41
Table 8
Provision of special materials/services at different types of service point .................................41
Public library services for visually impaired people
List of figures Fig 1
Page no. Major Inputs to the Questionnaire Design ................................................................................... 3
Fig 2
A Survey Framework ................................................................................................................... 4
Fig 3
Percentage of libraries with a written policy for services for visually impaired people .............. 22
Fig 4
Policy by authority type .............................................................................................................. 22
Fig 5
Policy and overall relationships with external agencies............................................................. 23
Fig 6
Policy and number of special services provided........................................................................ 23
Fig 7
Policy and variety of special equipment provided ...................................................................... 24
Fig 8
Areas covered within written policies ......................................................................................... 24
Fig 9
The most important factors affecting libraries’ decisions in providing services for visually impaired people ............................................................................................................ 24
Fig 10
Importance of the objectives in serving visually impaired people .............................................. 25
Fig 11
Budgeting ................................................................................................................................... 26
Fig 12
Budgetary allocation by authority type ....................................................................................... 27
Fig 13
Budget allocation and special services provided ....................................................................... 27
Fig 14
Budget allocation and range of special equipment provided ..................................................... 27
Fig 15
Reported expenditure for VIP, 1998-99 ..................................................................................... 28
Fig 16
Staffing for services ................................................................................................................... 28
Fig 17
Staffing and relationship with external organisations ................................................................ 29
Fig 18
Staffing and special services provided ...................................................................................... 30
Fig 19
Staffing and special equipment provided ................................................................................... 30
Fig 20
Staff training in relation to services for visually impaired people ............................................... 30
Fig 21
Relationships with other organisations working for visually impaired people ............................ 31
Fig 22
Authorities using formal evaluation methods ............................................................................ 32
Fig 23
Approaches applied in evaluating services for visually impaired people................................... 33
Fig 24
Consultation with users and other professionals in developing services .................................. 33
Fig 25
Numbers of VIP in the population and as library members ....................................................... 34
Fig 26
Percentage of VIP who are library members ............................................................................. 34
Fig 27
Holdings of alternative format materials .................................................................................... 35
Fig 28
Large print and talking books per 1,000 resident population ..................................................... 36
Fig 29
Policy considerations for selecting alternative format materials ................................................ 36
Fig 30
Availability of alternative format stock in different minority languages ...................................... 37
Fig 31
Areas that are not covered by alternative format holdings ........................................................ 38
Fig 32
The take-up of general library services by visually impaired users ........................................... 40
Fig 33
Provision of free or concessionary special services .................................................................. 42
Fig 34
Promotion of services ................................................................................................................ 43
Fig 35
STV News .................................................................................................................................. 43
Public library services for visually impaired people
iii
Acknowledgements The authors would like to thank the following people for their invaluable help in producing this publication: David Owen and Linda Hopkins of Share the Vision for commenting on and piloting the questionnaire. The team at CPI (Capital Planning Information Ltd) who also commented on the questionnaire, mainly in relation to the questions they were to investigate.
iv
All at LISU who contributed to the layout and production of the questionnaire and to Mary Ashworth and Sharon Fletcher for preparing and typesetting the text for publication. The Library and Information Commission for funding the project. All the librarians who spent time completing the questionnaire and answering queries.
Public library services for visually impaired people
Introduction
1. Introduction In 1998, the Department of Culture, Media and Sport (DCMS) made available a £200,000 grant through the Library and Information Commission (LIC) to ensure that blind and visually impaired people in the UK benefited more effectively from wider access to library and reading services. In partnership with Share the Vision, LIC identified a number of research areas which could better inform, enlighten or empower public library services in their service to visually impaired people. One of the primary research needs was to survey current service provision in public libraries. The aims were: •
to inform political decision makers and the managers of public library services of the position in services for visually impaired people, and
•
to promote best practice.
The latest previous survey of this type had been carried out by the Royal National Institute for the Blind (RNIB) in 1997 (Chartres, 1997). Since then there have been dramatic changes both within and without the public library sector, transforming the environment where services for visually impaired people are provided and, at the same time, raising expectations of how services should develop. The impact of information and communication technologies (ICT) The People’s Network was inaugurated, which promoted the connection of public libraries to the global network; a vast amount of educational, heritage, commercial, community, leisure and lifestyle information emanating from UK public libraries was thus made available
over the network. The National Grid for Learning initiative is also engaging public library resources with those of schools, universities and colleges, to give public libraries an even stronger foothold in the national education network. Library plans Annual public library plans which are required by the Department of Culture Media and Sport (DCMS) are producing comparable statements of service review and planning across library authorities and are setting a national framework for service planning/evaluation and functions as an instrument for efficiency1. Identifying both the policies on serving specialised needs and how services will be delivered to best practice standards has therefore become an even more significant issue for public library managers. Share the Vision and the wider legal/social context In relation to services for visually impaired people more specifically, Share the Vision (STV) continues to promote public libraries as local access points whilst the LIC/STV National Guidelines provide practical guidance2. Beyond the public library sector, the years after 1997 have seen continued progress in enforcing the Disability Discrimination Act, the full operation of newly re-organised local government, the establishment of the Labour government which brought with it, among other political changes, social inclusion policies and the Best Value principle (replacing the former government’s Compulsory Competitive Tendering as a way to ensure public sector efficiency). The Disability Discrimination Act, in particular, requires that, from October 1999, all service providers make a
__________________________________________________________________________ 1
2
For the details of the People’s Network see: http//www.ukoln.ac.uk/services/lic/newlibrary/; For National Grid for Learning, see http//www.ngfl.gov.uk/ngfl/index.html; for Annual Public Library Plans, see Department for Culture Media and Sport (2000), Libraries, Information and Archives Division and Spiller (1998) For details of Share the Vision and the National Guidelines, see Chapter 2.
Public library services for visually impaired people
1
Introduction
range of policy and procedural changes to enable people with disabilities to access their services. There is an inevitable impact on services for visually impaired people. The Library and Information Statistics Unit (LISU) at Loughborough University, therefore, endorsed LIC/STV’s proposal to update the RNIB’s 1997 survey and undertook the task. This report details the procedure and results of the survey conducted by LISU at the end of 1999, and the literature review which was undertaken to underpin the findings. It offers conclusions and recommendations, particularly focused on developing performance indicators which would aid the evaluation of services. Research design Aims and Objectives
The aim of the survey was to ascertain the current levels of service provision in public libraries and how they match up to the National Guidelines published by Share the Vision and the Library Association. It had the following objectives:
2
•
To build upon and extend the findings of the 1997 RNIB survey of public library authorities
•
To assess progress in UK authorities since the 1997 survey
•
To assess developments in the new unitary authorities
•
To monitor the progress of public library services against the Library Association’s national guidelines for services to visually impaired people
•
To place particular emphasis upon measuring service to users aspects, and the integration of public library services with those of other agencies
•
To qualify user numbers, library collections and use of collections, so as
to establish the current baseline of provision in the UK •
To determine what measurements of these services currently take place
•
To make recommendations on additional statistical data which should be collected to improve the management of services to visually impaired people
•
To recommend how local authorities might benchmark their service provision in future
Methodology
The method used in this study was a postal questionnaire survey of all UK public library authorities, including 34 English counties, 33 in London, 36 Metropolitan districts, 5 in Northern Ireland, 22 in Wales, 32 in Scotland and 46 English unitary authorities (208 in all). The questionnaire can be found in Appendix A. A number of factors have affected the design of this study in general and the questionnaire design in particular. First, the primary aim of the study was to identify the general level of provision, which made the coverage/representativeness of surveyed libraries a priority over depth. In addition, the study was scheduled for a period of three months; time limitation did not allow consideration of in-depth survey methods (e.g. interviews), even although this would have added insights. Secondly, it was intended that the study should produce a set of results comparable with those of the 1997 RNIB survey and with the STV/LA’s National Guidelines, so that progress in the last few years could be assessed against both. This required the design of the questionnaire to cover most of the areas addressed by the 1997 survey, as well as those laid down in the National Guidelines. A relatively lengthy questionnaire was therefore inevitable, although it was anticipated that this might affect the
Public library services for visually impaired people
Introduction
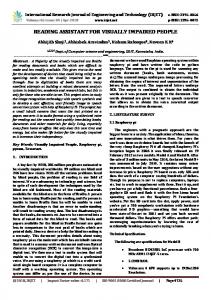
response. Thirdly, the study was carried out in close co-ordination with the other participants of the LIC/STV programme, which meant that various questions raised by other participants were added, so as to avoid distributing potentially overlapping questionnaires. Care has been taken to keep the questionnaire as integrated and coherent as possible; however, traces of this Fig 1
multiplicity are inevitable. Fourthly, as the review section of this report in Chapter 2 will show, UK development is not completely isolated from international trends. Surveys from other countries, where available, were therefore also consulted. These different strands of input to the questionnaire design are shown in Fig 1.
Major Inputs to the Questionnaire Design
Other related surveys Craddock, 1985
National Guidelines 〈 〈 〈 〈 〈 〈
Equality Access & design Staffing Service provision Service delivery Client groups
〈 〈 〈 〈 〈 〈 〈
Survey of Public Library Services to Visually Impaired People
1997 RNIB Survey 〈 〈 〈 〈 〈 〈 〈
Policy Finance and funding Services Staffing/staff training Access and design External links Research & marketing
Services – site of delivery Library holdings Distribution of stock Reading aids & equipment Links with other agencies Subscriptions to services Attitudes & policies
〈 〈 〈 〈
Resources Facilities Staffing Budget Liaison
Other surveys Basu, 1991 General services Special services Special format materials Special equipment
Selection policies, criteria, & budget Acquisition and use of different formats of stock Access to other audio services Gaps in title coverage Relegation & disposal charge
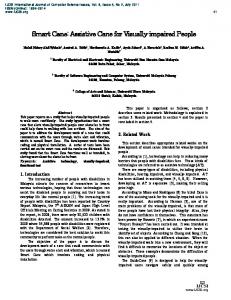
In order to group these hybrid inputs into meaningful groups of questions and, more importantly, to ensure that the level of service provision was comprehensively and sensibly assessed, a survey framework was
Public library services for visually impaired people
〈 〈 〈 〈 〈
〈 〈 〈 〈
Collaborator CPI 〈
Other surveys Needham, 1983
constructed based on three major aspects of library operation – policy making, management and service development/delivery. This framework is shown in Fig 2.
3
Introduction
Fig 2
A Survey Framework
Policies/ Decision making Resources/ Equipment
Staffing
Delivery
Marketing/Research
Service development/delivery Collection Development Resources
Physical Design/Facilities Access
Resource Provision Delivery
Research & Marketing Promotion
Management
Finance & Budget
Staff & Staff Training
External Links
Service Evaluation
Visually impaired users
Survey Process
The questionnaire for the survey was designed during October 1999 by drawing on the resources from the major input in Fig 1 and using the structure of the framework in Fig 2. After the initial consultation (with Share the Vision and other participants of the LIC programme) and the resulting revision, it was piloted with one of the library authorities in November 1999. Some additional revisions were made as a result of the piloting study. The revised questionnaire was distributed to all UK library authorities with an expected return date three weeks after distribution. Follow-up phone calls were made to over three-quarters of the authorities (by random selection) who had not returned the questionnaire by the end of the fourth week. In total, 141 library authorities responded; two of these returned the questionnaire with an apologetic note saying that they were unable to complete it due to pressure of work. The rest of the returned questionnaires
4
were all usable, giving a response rate of 64%. It appeared that the questions on budgeting and staffing practices were interpreted by library authorities in different ways or, more precisely, a number of library authorities with the same budgeting or staffing approaches seem to have categorised their practice differently in relation to the types of approach provided in the questionnaire. Where additional information was provided by the respondents, their answers were recoded prior to analysis to comply with a common standard. Structure of the Report Chapter 2 sets the relevant public library services in the wider social milieu surrounding visual impairment while Chapter 3 focuses on the development of these services based on published literature to date. Chapter 4 reports the findings. Chapter 5 draws conclusions and proposes recommendations.
Public library services for visually impaired people
Introduction
No attempt was made to precisely define the term ‘visually impaired people’. This was a deliberate policy, as it was established that public library authorities, in trying to cater for all special needs through appropriate services, did not necessarily apply consistent and clear-cut criteria in order to define visually impaired users. Moreover, services may be provided on request even though the visual impairment of a user does not meet
Public library services for visually impaired people
any particular criterion. We have preferred to use the term ‘visually impaired people’ precisely because it is not so arbitrary as either ‘blind people’ or ‘partially sighted people’, terms in use in social services departments to define those with a visual impairment. In the library context, ‘visual impairment’ may refer to anyone who has difficulty in reading ordinary font size on paper or on screen.
5
Visually impaired people and the social environment
2. Visually impaired people and the social environment: the context for public library services Visual impairment and general support In the UK, the official terms for serious visual impairment are ‘blind’ and ‘partially sighted’. These definitions are medical ones and are applied to certify eligibility to register with a Social Services department for welfare support. A person can register as blind if he/she cannot see the top letter of the eye test chart (used by opticians and doctors) at a distance of three metres or less. However a person who can see (but cannot read) the top letter may still be eligible for registration if her/his visual field is also severely restricted (RNIB, 1998c). ‘Partial sight’ is a less severe loss of vision. A person can register as partially sighted if he/she can only read the top letter of the eye test chart at a distance of six metres or less. Where the next three lines down at the same distance can be read but the field of vision is severely restricted, someone may still qualify for registration (RNIB, 1998c). Not surprisingly, these definitions and system of registering with the Social Services Department exclude a large number from the official statistics for the blind and partially sighted population. There are many people who have less severe visual impairment but who nevertheless cannot read standard print comfortably. Many people do not seek to establish their eligibility in the first place and are also excluded from official statistics. It has been estimated that there are around 1.7 million visually impaired people in the UK (Bruce, McKennell and Walker, 1991). In 1996, around one million of these could register either as ‘blind’ or ‘partially sighted’, but as of 31 March 1997, only 354,153 had actually done so (RNIB, 1998b). Of those who had registered, 4% had no light perception and 90% were aged 65 or over (Barrington, in Brophy and Craven, 1999a). Overwhelmingly, then, those registered are elderly.
6
The welfare state provides certain statutory care and services for registered blind and partially sighted people. These are primarily delivered through Social Services departments, as specified in the 1972 Local Government Act. Some services are mandatory, but many are permissive. A blind or partially sighted person who wishes to register their need will be referred to an ophthalmologist who will assess the visual loss and decide on eligibility. Having confirmed the level of visual loss, the ophthalmologist will complete a form and send it to the Social Service Department. A social worker will then visit the visually impaired person and ask whether they wish to be added to the register. The registration will trigger the provision of a range of local services (which vary with regions) for the visually impaired person and entitlement to certain social benefits and concessions. Social Services departments also work closely with a wide range of voluntary organisations who constitute one of the major sources of support for visually impaired people in the UK. These organisations have constantly campaigned for the elimination of discrimination and for awareness of visual impairment in society at large. Most organisations also provide advice as well as practical help for visually impaired people. Services range from advice, transcription and reading services to transport schemes. The Royal National Institute for the Blind (RNIB), for example, alone provides over 60 different services (RNIB, 1999c). Major organisations that offer library services include the RNIB, Calibre Library, Talking Newspapers Association UK (TNAUK) and its local groups, and ClearVision. (RNIB, 1998a) Further details on these services are given below.
Public library services for visually impaired people
Visually impaired people and the social environment
In 1995, the then Conservative Government enacted the controversial Disability Discrimination Act (DDA). Although the Act disappointed many disabled people because of its inadequacy and vagueness in many places (Gooding, 1996; Campbell and Oliver, 1996; Doyle, 1996), it did represent a major advance in the civil rights of disabled people. Section 3 of the Act – Access to Goods, Services and Facilities, for example, stipulates that it is unlawful to refuse to serve a disabled person through circumstances relating to their disability (e.g. on account of a person’s guide dog), to offer a sub-standard service or a service on different terms. The implementation of the Act is being staged over several years, from the end of 1996 onwards. In December 1997, the current Government established a Disability Rights Task Force to look at ways of eliminating discrimination and in July 1998, the Government published the White Paper ‘Promoting Disabled People’s Rights: Creating a Disability Rights Commission Fit for the 21st Century’, setting out proposals on the role and functions of the Disability Rights Commission. Beginning in October 1999, service providers are required to make a range of policy and procedural changes to help disabled people access their service. For the first time, people with disabilities have therefore been conferred enforceable equal rights to services, in both the private and the public sectors. This combination of legislative provision, statutory services and voluntary support provide visually impaired people in the UK with a commendable framework of support. However, for many visually impaired people, daily life is still a battle with disadvantages that go beyond physical sight deprivation. Recent surveys by the RNIB revealed that more than one in five blind people in the UK rarely leaves home, hindered by the design of buildings, streets, transport, and so on (RNIB, cited in Brindle, 1999). Around 80% of local authorities do not have a full-time officer to ensure that
Public library services for visually impaired people
necessary improvements are made in urban areas and only 35% of local authorities have policies relating to public transport access (Pope and Bourne, 1999). Even more deterring than mobility is discrimination and prejudice of various kinds. Legislation such as the Disability Discrimination Act may decrease overt discrimination, but prejudice persists. People with disabilities are twice as likely to be unemployed as other people; they are also under-represented in higher education (Skill, cited in Inman, 1999). Information/reading needs Bearing the above broader context in mind, this section looks more closely at the information needs of visually impaired people. According to RNIB statistics, about 36% of blind people and 75% of partially sighted people are able to read clear, large print. About 69% of blind and partially sighted people said that they read less after visual impairment; 21% read the same and 9% read more (Bruce, McKennell and Walker, 1991). A recent survey of audio book users by RNIB (Chartres, 1999) noted that the majority of people regarded reading as a very important part of their leisure time, with 63% spending more than two hours on reading per day. Studies on the information and reading needs of visually impaired people (Bell, 1980; Bruce, McKennell and Walker, 1991; EXLIB deliverables, 1993/1994; Chartres, 1998, 1999) have mainly focused on needs and the use of different formats, and the results do not always agree. Bell’s (1980) survey found that only some partially sighted people read large print materials. Reasons for non reading included non-use of library services in general, dissatisfaction with the range of materials available, lack of awareness, and the preference for other formats such as Braille.
7
Visually impaired people and the social environment
The RNIB survey revealed that, in fact, ordinary print was read by more visually impaired people than large print. Tapes were also popular among those with serious visual impairment, but Braille and Moon materials constituted an insignificant proportion of materials used (Bruce, McKennell and Walker, 1991). The order of preference appeared slightly different in a 1993 survey carried out by the Hampshire Association for the Care for the Bind, in which the most preferred reading format was audio cassette, followed by large print and then Braille (cited in the EXLIB deliverables, 1993/1994). Project EXLIB (a European project which aimed to develop models of library services for visually impaired people) found that the reading of Braille and spoken word materials was almost equally popular but there was a notable dissatisfaction at the lack of accessible materials. Around a quarter of EXLIB’s sample (comprised mainly of young people at work or on study) used computers and most of these used synthetic speech as a way of accessing text. With respect to the methods for information acquisition, the majority of visually impaired people regarded getting information by asking people, listening to the radio, watching television, and telephoning as important. ‘Asking people’ headed the list of the most important information sources, followed by telephoning (Bruce, McKennell and Walker, 1991). Reading taste is understandably more difficult to ascertain, as visually impaired people are as diverse in their preferences as the rest of the population. A survey of large print users showed that, for those who read large print, romance was the most popular genre, followed by mystery and biography (Bell, 1980). A recent survey by the RNIB in relation to talking books showed that fiction material was more popular than non-
8
fiction, with crime/thrillers being the most popular fiction genre and auto/biographies being the most popular non-fiction genre (Chartres, 1998, 1999). In neither of the surveys was it clear whether preferences were shaped by the availability of materials or by genuine reading taste. However, the RNIB survey noted that there was no evidence to suggest that people read different categories of material as a result of their eyesight deteriorating. Although the results of studies on visually impaired users’ needs do not always tally, there seems to be little doubt that visually impaired people do read a great deal and are generally not satisfied with the range of materials available. Many visually impaired people are not adequately aware of services provided (Craddock, 1996; Chartres, 1998, 1999; Our better vision, 1999). With the current production of alternative format materials at just 1% of everything published (Tucker, 1997) and the low awareness of available services, many of the needs of visually impaired people are likely to remain unmet. Reading/information services The reading and information needs of visually impaired people in the UK are currently served by a wide range of statutory, voluntary and commercial organisations. The local authority Social Services Department (SSD) is usually the first access point. It produces a large amount of information about the welfare of disabled people. For blind and partially sighted people, the SSD is also a source of information about other providers of information and reading materials in alternative formats. Some SSDs provide needs assessment and refer the blind or partially sighted person to appropriate service providers accordingly. Most SSDs used to pay for individual subscription to the Talking Book Services at RNIB, but many
Public library services for visually impaired people
Visually impaired people and the social environment
are now transferring the responsibility to public library authorities (Chartres, 1998). Until now, most blind and partially sighted people have been referred to one or more of the voluntary organisations who provide reading materials in alternative formats and most of these organisations offer free postal services under the Articles for the Blind Scheme. As already noted, major voluntary reading providers include the National Library for the Blind (NLB), the RNIB, Calibre, the ClearVision project, TNAUK (The Talking Newspaper Association of the UK), and local talking newspapers.
collection of materials on visual impairment and provides transcription services on request (RNIB, 1998a). Calibre
Calibre is a postal lending service of books on audio cassettes. The books are recorded unabridged, and can be played on any ordinary cassette player. It currently has over 5,000 titles and 13,000 members. Membership is open to those who can provide a doctor’s or registration certificate (Calibre, 1999; RNIB, 1998a). ClearVision
The National Library for the Blind
The NLB is the largest single library in the UK serving visually impaired people. It produces and lends a range of reading materials in Braille, Moon and large print. Membership is free (RNIB, 1998a). The NLB is currently forming a partnership with the RNIB to provide seamless access to all formats of materials (Links for seamless service, 1999). The Royal National Institute for the Blind
The RNIB is another major information and reading materials provider in the UK. It provides a number of separate services. The Talking Book Service produces and lends audio books on special format cassettes. It currently has around 12,000 titles in stock and 57,000 members. The membership fee is £58 per year and is usually paid by local social service departments or public library authorities3. The RNIB Cassette Library provides audio books on ordinary cassette. Membership is free of charge and is open to anyone who cannot ready ordinary print comfortably. The RNIB Braille Library holds over 14,000 titles in Braille. The majority are non-fiction, utility books, such as cookery and computer manuals. Membership is free and is open to anyone who is a Braille reader (RNIB, 1998a). The RNIB Research Library holds a
ClearVision books are standard children’s books with interleaved sheets in Braille. These are mainly fiction or information books related to the national curriculum. The Talking Newspaper Association of the UK
The Talking Newspaper Association of the UK (TNAUK) provides national newspapers and magazines on audio cassettes, computer disk, e-mail, CD-ROM or through a Bulletin Board Service for visually impaired people. It currently produces 200 titles and is the umbrella organisation for over 500 local Talking Newspaper Groups who record local news on to tapes. Membership costs £25 per year (TNAUK, 1999a). Campaigns for accessible information In addition to their own provision, the voluntary sector has also been at the forefront of campaigns for accessible information. The RNIB, for example, has had the See it Right Campaign, the Get the Message Campaign, Better Web Design Campaign, and the Copyright Exemption Campaign in recent years: all aimed at improving access to information for visually impaired people. One of its latest initiatives was a set of guidelines for children’s publishers on how to make books easier to read. Practices in keeping with the
__________________________________________________________________________ 3
Telephone confirmation with RNIB Talking Book Service, 7th January 2000
Public library services for visually impaired people
9
Visually impaired people and the social environment
guidelines will make books more accessible for all children as well as visually impaired children (The Bookseller, 1999).
provision, like that in public libraries, varied greatly between institutions (Brophy and Craven, 1999a, 1999b).
Contributions to accessible information by commercial organisations may not be as conspicuous as those from voluntary organisations, but they produce significant quantities of accessible reading materials and information. The sector consists not just of the large print and audio publishers, but also non-publishing organisations. Major large print or audio publishers (e.g. Chivers, Cover to Cover, Ulverscroft, the BBC and EMI) usually lend commercially-produced titles from their libraries as well as selling them at retail outlets (Chartres, 1998). Non-publishing organisations, on the other hand, produce information relating to their own services in alternative formats. British Telecom, for example, has been offering an enquiry service for visually impaired people through its Talking Pages service and a number of banks provide visually impaired customers with large print or Braille banking information. (RNIB, 1998a) With the Disability Discrimination Act mandating auxiliary aids for disabled people, the RNIB has urged services to provide accessible information. It is anticipated, therefore, that visually impaired people will find a significant improvement in access to information as service providers take on board their legal obligations (RNIB, 1999d).
Production of alternative formats and copyright clearance In the UK, service providers are often producers of alternative formats, many specialising in particular formats. Voluntary providers rely mainly on volunteers to convert the original text ; commercial providers publish alternative formats as part of their business; public libraries also provide limited transcription or sound recording facilities as part of their specialist services for visually impaired people (Craddock, 1985; Chartres, 1997). Together, these organisations produce a range of alternative formats including spoken word materials (on cassettes or CD), large print, Braille, Moon and audio-described videos. At present, however, all of these materials represent just 1% of everything that is published (Tucker, 1997).
Under the 1964 Public Libraries and Museums Act, all public library authorities are obliged to provide a library service to everyone in the community, including visually impaired people. The next chapter will review in greater detail the development of public library services to blind and partially sighted people. Suffice it here to note that up to the time of the last survey, (Chartres, 1997), such services had been found inadequate and inconsistent. All higher education libraries reported having some kind of service for their visually impaired members, but the level of
10
Braille is a method of transcribing text to be read by touch, using raised dots to represent characters (Massis, 1996, p.171). Traditionally, Braille was produced manually using a Braille typewriter, but increasingly, it is produced by special embossers that can be linked to computers. Moon is a similar method of printing for blind people, using stylised raised characters based on the Roman alphabet (Massis, 1996, p.172). The major Braille and Moon producers in the UK are voluntary organisations such as the NLB, RNIB and ClearVision (RNIB, 1998a). Large print books usually have a font size between 16-20 points. They are produced mainly by specialist large print publishers, such as Ulverscroft and Chivers, as well as some of the mainstream publishers. Spoken word materials are created by reading text on to audio tapes. These are produced by both voluntary organisations and commercial publishers. That there has been
Public library services for visually impaired people
Visually impaired people and the social environment
a notable increase in commercially produced titles in the past few years (Chartres, 1998 ). Unlike the USA, Australia, New Zealand, Spain, Portugal, Canada, and Scandinavian countries, the UK copyright law (Copyright, Designs and Patents Act, 1988) does not automatically grant copyright exemptions for producing alternative formats for visually impaired people. There are 47 specific exceptions in the Act (Norman, 1999), but no specific mention was made of the production of alternative formats for visually impaired people (Brophy and Craven, 1999a). Application has to be made on individual cases to copyright holders. The process is usually long and refusals do occur and when permission is granted, it often comes with limits on the number of copies that can be produced. The RNIB has found that difficulty in getting copyright exemption has been a significant barrier to providing visually impaired people with speedy and quality production of alternative formats (RNIB, 1999b). Deployment of Access Technologies The 1970s saw two major technological developments addressing the reading/information needs of visually impaired people: the Kurzweil reading machine and CCTV. For people with visual impairment, the Kurzweil machine represented a great advancement on the traditional tactile (e.g. Braille) and magnifying (e.g. hand-held magnifiers) technologies. However, the most radical change was yet to come, with the widespread use of ICT (Information and Communication Technologies). With personal computers and peripherals (e.g. scanners), visually impaired people can easily convert print into electronic text and read it from the screen with either transitory Braille or through synthetic speech. If the reader has some residual sight, a screen enlarger can be used. ICT has also made it possible to link different converters such as
Public library services for visually impaired people
scanners, reading machines, embossers, and tape recorders so that a converted text can be permanently recorded in the desired format (Gallimore, 1999; Long, 1993; Porter, 1997). Moreover, the Internet, where an increasing amount of information is published directly in electronic format, with or without printed equivalent, has made it possible for visually impaired people to access information simultaneously with other people (Brazier and Jennings, 1999; Gallimore, 1999). As some commentators have observed, the computer has dramatically improved the equality of access to information for visually impaired people (Tucker, 1997), bringing both ‘independence and choice - two of the fundamental freedoms’. (Porter, 1997, p36) However, the development of assistive technologies has inevitably lagged behind in comparison with that of ICT in general. In some cases, the rapid development of ICT has created huge gaps and assistive technologies need to catch up (Porter, 1997). The Windows-based graphical interfaces and the application of multimedia, for example, still represent an immense problem for screen reader software which normally can only read text. Such interfaces have also generated many new concepts which are difficult for visually impaired people to exploit. Therefore, whilst the Internet presents a large repertoire of potentially accessible electronic information, the graphical user interface still imposes a formidable barrier. Many research and development initiatives are devoted to exploiting ICT for visually impaired people. Since the early 1990s, the UK has participated in a number of projects of the European Telematics for the Integration of Disabled and Elderly People (TIDE) initiative. The following are a few examples for which detailed information is collated by RNIB’s Web site (RNIB, 1999e):
11
Visually impaired people and the social environment
•
Access, Information and Navigation Support in the Labyrinth of Large Buildings (ARIADNE), which aimed to address the problems of access and navigation faced by visually impaired people when visiting unfamiliar buildings.
•
Communication and Access to Information for Persons with Special Needs (CAPS), which aimed to develop standards and models for the automatic production and exchange of documents for visually impaired people.
•
Horizontal Action for the Harmonisation of Accessible Structured Documents (HARMONY), which aimed to promote the use of the European Interchange Format developed in CAPS and to stimulate the production of accessible newspapers using the format.
•
Secure Document Delivery for Blind and Partially Sighted People (SEDODEL), which aimed to provide a model of secure document delivery environment where electronic documents can be delivered to visually impaired people and their organisations without incurring further copyright infringement.
The UK has also been a major contributor to the European project Testing Systems using Telematics for Library Access for Blind and Visually Handicapped Readers (TESTLAB), which looked at how libraries could apply new information and communication technologies in services for visually impaired people. The project noted a great demand among visually impaired people for direct access to library catalogues and tested models for delivering such catalogues for normal searches as well as for interlending. It recommended that libraries should make their OPACs more searchable and browsable for visually impaired people, and urged OPAC designers to implement the principle of ‘design for all’ to ensure that accessibility
12
is designed into regular OPACs. (Godber, 1999). Voluntary organisations have, again, played one of the most proactive parts in deploying information and communication technologies for visually impaired people in the UK. The RNIB, for example, apart from participating in the European TIDE projects, has also persistently promoted accessible Web design through campaigns, guidelines, Web site audits and awards. In September 1998, the RNIB launched the Pilot Internet Project to address the needs of using the Internet by visually impaired children. (RNIB, 1999a) During 1997-1998, the NLB launched its accessible Web site as a forum for visually impaired people and a publicity platform for the Library. (Brazier and Jennings, 1999) In 1999, TNAUK started a project to provide electronic text versions of national and local news at 45 of its local Talking Newspaper groups (TNAUK, 1999b). Issues in the provision of reading/information services to visually impaired people As the foregoing review has shown, the overall provision of reading materials for visually impaired people in the UK is carried out by a wide range of organisations, including public-sector and voluntary organisations, self-help groups, local societies and commercial organisations. The voluntary sector has remained the major player, owing to its long-standing commitment to serving blind and partially sighted people, with referrals coming from Social Services departments and services fostered by the free postal service. In its proposal to the LIC, Share the Vision contended that the current provision of reading materials and information for visually impaired people in the UK was disadvantaged through a number of weaknesses. These include ad hoc service planning, lack of a national lead library, lack of co-ordination between organisations,
Public library services for visually impaired people
Visually impaired people and the social environment
difficulties in obtaining copyright clearance, lack of content, and lack of coverage in the British National Bibliography (STV, 1999). In the light of the foregoing review of overall service provision to date, a number of the problems merits special note. Fragmentation
The first is the fragmentation of resources across various uncoordinated organisations, each having its own agenda in selecting titles and production of formats. For visually impaired people, this means that they may have to contact many organisations in order to achieve reasonable access to materials. It also means that they are served by organisations competing with each other for the same societal support. Partnership between the NLB and the RNIB is reported to be under way, aiming to provide visually impaired people with seamless access to everything that is available in alternative formats (Links for seamless service, 1999). The project REVIEL (Resources for Visually Impaired Users of the Electronic Library) (Brophy and Craven, 1999a) proposed a nationally accessible library model, which seeks to improve the provision of accessible information across different sectors. Initiatives and proposals like these may diminish the fragmentation of resources, but it is still too early to predict their impact. Exclusion
The second disadvantage of current provision is its unwitting exclusion of a large proportion of visually impaired people. This is because many organisations, particularly the voluntary sector, largely identify the target users according to their registration at Social Services departments or from medical certificates ; some also rely on Social Services for referral. Consequently, many visually impaired people are either not eligible or are unaware of the services available. Those who do not want to be identified as blind or partially sighted may find it difficult to obtain appropriate services for their reading needs.
Public library services for visually impaired people
Segregation
The third major disadvantage of this provision is its segregation from the mainstream service. In practice, this is manifested in the division between the sighted society whose reading/information needs are served by the public or academic library in an integrated service environment, and the visually impaired section of the community whose needs are mainly served by voluntary organisations. This has a number of implications for the level (and perhaps quality) of the service provided: •
visually impaired people cannot normally have their reading and information needs met by a one-stop contact;
•
new services developed by the mainstream operation (e.g., learners’ support) may remain unknown to blind and partially sighted people;
•
there is over-reliance on the good will of voluntary workers;
•
visually impaired people may not benefit from the professional skills of librarians.
Clearly, public libraries have great potential for improving the overall provision of library services for visually impaired people. In the past few decades, most public libraries have developed a remarkable collection of large print, spoken word and other format materials (e.g. CD) which are readily accessible to visually impaired people. New technologies, on the other hand, have opened up various ways of making the print stock accessible. Whilst traditional community librarianship gave public libraries both the ideological and material foundations for special service development, new initiatives, such as the People’s Network and National Grid for Learning, provide renewed political and technological support.
13
Visually impaired people and the social environment
3. UK public library services to visually impaired people 1970 - 1997 Despite the statutory duty of all public library authorities under the 1964 Public Libraries and Museums Act to provide a comprehensive and efficient service to all in the community, up to the late 1970s public libraries offered very limited services for visually impaired people. They left these services largely to voluntary organisations such as the RNIB and NLB (Craddock, 1985). With the Kurzweil reading machine and closed circuit television (CCTV) opening up new possibilities for converting print into accessible formats, and audio materials being increasingly stocked as part of the core collection, public libraries became more proactive in providing appropriate services. A number of library authorities decided to invest in the new technology (Clarke, 1988; Hoy, 1992). The Visually Impaired People’s Unit in Manchester City Libraries, for example, was established in 1983 with the purchase of two Kurzweil reading machines. The unit aimed to make all printed library stock and other library services available through reading aids, alternative formats and other specialised services. In 1983/84, a national survey of services to blind people was commissioned by the British Library (Craddock, 1985). The aim was to identify authorities which provided services to blind people and to measure the level of provision. Blind people were defined in the survey as people who for most purposes could not see to read or who would require the assistance of special low vision aids. Key findings of the study included the following: •
14
Public libraries were, on the whole, very much on the periphery in the provision of library and information services for blind people. Few libraries identified the blind as a particular group; many libraries thought that the essential service for blind people was a talking
book service which lay outside the scope of the library service. •
In some libraries, services to disabled people were developed on the basis of social integration and normalisation, which emphasised the diminishing of distinctions between disabled groups and normal people. This policy, despite good intentions, had in reality denied many visually impaired people the benefits of a community-based library service.
•
Provision of reading aids and equipment was very limited. A minority provided specialist equipment and this was mainly confined to cassette players and lowvision aids.
•
Most libraries had collections of music and spoken word cassettes but, compared with what was available to sighted people, the range of reading and information for blind people was very limited.
•
A few libraries were involved in both producing and supplying sound recording of materials. Their practices demonstrated considerable potential for public libraries to promote the production and supply of reading materials for blind people.
•
Many libraries had created links with other agencies, but these appeared largely to be liaison and not co-operative links.
The study recommended that public libraries should reassess their roles in services for visually impaired people, and establish a composite national body to lead national initiatives and support local/regional services; they should also form policies relating to service development, relationships with other agencies,
Public library services for visually impaired people
Visually impaired people and the social environment
application of information technologies, and availability of reading aids, etc (Craddock, 1985). The years following the 1983/84 national survey saw continued growth in public library services for visually impaired people, for example: Manchester City Libraries Expanded their Visually Impaired People’s Unit to three local sites and began to provide a wide range of reading aids, including magnification aids (CCTV, zoom-text computer screen magnification software), speech systems (Kurzweil reading machine and various screen readers), speech recording facilities (those linked to Kurzweil machines to permanently record the spoken text), alternative output facilities (embossers that produce disk files in Braille). The service also began to offer tailored training to suit individual needs and the extent of the visual impairment (Gallimore, 1999; Henry, 1984). Gateshead Libraries Launched its AIRS (Access to Information and Reading Services) in 1987. The service aimed to produce and deliver a national daily newspaper and a talking information service. This was later expanded to cover the transcription of a diverse range of materials, eg birthday cards, job advertisements (Walters, 1999). Cambridgeshire Libraries Developed its CAMREAD service which recorded excerpts from books and other publications on to tapes at users’ request. There was also a one-to-one service to help individuals with personal correspondence and other matters (Pinion, 1990). Tameside Libraries Dukinfield Library in Tameside developed the Centre for the Visually Impaired which included a range of traditional library resources, a Kurzweil reading machine, a
Public library services for visually impaired people
Braille printer and other aids for communication (Hoy, 1992). Edinburgh City Libraries Developed the Library Link service in 1992, in co-operation with local transport agencies, which provided door-to-door transport services to enable people with impaired mobility to visit community libraries (Fish, 1994). Bradford Libraries Ran an Access to Print Service to ensure visually impaired people had equal access to government information (Heap, 1994). Suffolk Libraries Operated the Home Library Service (HLS), which served customers either in their own homes, sheltered accommodation or residential or nursing homes. Each customer was visited once every two weeks (Blowers, 1994). Share the Vision In 1989, Share the Vision (STV) was set up as an RNIB project with grant aid from the then Department of National Heritage. It later evolved into a partnership company involving the RNIB, the NLB, Calibre, TNAUK, the Society of Chief Librarians, the Library Association, the British Library and the Scottish Library and Information Commission. The primary aim of STV was to foster public libraries as local access points for blind and partially sighted people. Over the years, it has led or supported a series of public library initiatives. What follows are a few examples taken from the reports of Craddock and Harvey (1996), Hopkins (1997), Owen (1999) and Williams (1996): •
Various roadshows, seminars and training sessions to promote the idea of localised services through public libraries, and to foster partnership between library and voluntary agencies.
15
Visually impaired people and the social environment
•
•
In partnership with the North Western Regional Library System, the Pilot Interlending project (PiP) as part of European project TESTLAB. In this project, an inter-lending protocol was developed and a variety of assistive technologies were employed. Using NUCAF for searching, visually impaired users were able to order books in their preferred format from any supplier.
•
The Gloucestershire Library Arts and Museum Service’s project to test the feasibility of delivering reading materials locally utilising national resources. During a two-year period, starting from 1994, the library service paid the RNIB a corporate subscription which enabled visually impaired readers to have full access to the RNIB’s Talking Book Service. The library held a deposit collection of RNIB’s talking books. When a request could not be satisfied by the deposit or the library’s core collection, it was faxed to the RNIB which would then supply the requested book on interlibrary loan.
•
16
The development of the National Union Catalogue for Alternative Formats (NUCAF). NUCAF started its life as an extension of the RNIB’s in-house database for accessible formats. It was later taken over by STV to help public libraries in their services for visually impaired people. The database currently consists of over 70,000 records of Braille and Moon texts, tapes and RNIB Talking Books, and is an integrated part of both UNITY and VISCOUNT regional union catalogues.
In 1996, Share the Vision and the Library Association published the National Guidelines for Library Services to Blind and Partially Sighted People (Machell, 1996), which provided practical guidance for setting up and
evaluating library services for visually impaired people. To up-date the national picture of public library services for visually impaired people, two surveys were conducted in the 1990s. The first was carried out by Share the Vision (STV) in 1991 (areas relating to the use of reading aids was further built on by project Libra at a later stage) (Craddock, 1996) and the second was by the RNIB in 1997. Share the Vision Survey: 1991 The STV survey found that 35% of library authorities had a defined policy on services for visually impaired people. Around 92% of library authorities provided talking book loans from service points and 23% by post or personal delivery. Five per cent had developed personal reading schemes and 16% subscribed to the RNIB Talking Book Service. Sixty-two per cent collaborated with local talking newspapers; 25% with TNAUK; 12% with the NLB. Twelve per cent produced spoken word recordings inhouse. By the mid-1990s, 38% of library authorities held at least one CCTV; 23% held at least one Kurzweil reading machine and 7% had computerised Braille input/output devices (Craddock, 1996). Twenty-six (out of 61) libraries offered an extensive range of reading aids (magnifiers, cassette players, KMR, CCTV, and even computerised devices and software); 26 (out of 61) had a reasonable range of equipment (KMR or CCTV with or without magnifiers or cassette players); nine had only magnifiers and/or cassette players (Craddock, 1996). RNIB Survey: 1997 The general conclusion of the 1997 RNIB survey was that the level of provision within library services remained inconsistent. Specific findings included: •
Half of the library authorities had policies relating to reading services for visually impaired people, but only 10%
Public library services for visually impaired people
Visually impaired people and the social environment
of these had policies specifically for visual impairment whilst others included them in policies for disabled people generally. •
Just over half the authorities had a separate budget allocation for services for visually impaired people; 62% employed special staff; over one third provided visual awareness training.
•
All the authorities had audio cassette collections located in main libraries and the majority of branch libraries; 50% of authorities also provided large print and/or spoken word cassettes in languages other than English.
•
The level of special services and concessions was as follows: 90% of authorities offered free borrowing of audio books; just under a third allowed an extended loan period; 94% and 90% of authorities provided home visits and mobile library services respectively; just over 10% provided postal services; 62% provided some kind of additional service or equipment.
•
Most libraries had improved the layout of and access to their libraries.
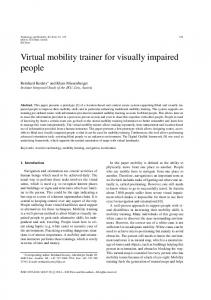
As part of its recommendation to public libraries, the report urged libraries to monitor the use of their services by visually impaired people, conduct marketing research within known visually impaired user groups, develop a promotional strategy to publicise library services, standardise policies relating to extended loan periods, free borrowing, etc., and strengthen their relationships with Social Services departments. A summary of the major findings of the 1983/84 (British Library), 199l (Share the Vision) and 1997 (RNIB) surveys is shown in Table 1.
Public library services for visually impaired people
Public library provision in other countries In order to compare the level of UK public library provision with that of the international library community, this section provides a brief review of public library services to visually impaired people in the USA and a number of European countries. A detailed in-depth comparison is not possible, because there is a dearth of up-to-date literature in this area. USA
In the USA, library services for visually impaired people are delivered through an extensive library network which is headed by the Library of Congress’s National Library Service for the Blind and Physically Handicapped (NLS) and consists of over 160 regional and sub-regional libraries. The NLS started its service for eligible individuals in 1931, based on the principle that all services should be tax-supported and free. Each year, the NLS produces around 2,000 books in alternative formats. The titles reflect proportionately the needs of different ages and occupations and are divided fairly equally between fiction and non-fiction. The selection of titles is usually based on subject areas, the medium previously used, the audience and the book’s potential popularity. After a book has been selected, it is catalogued as a recorded or Braille work, usually by editing the existing record for the standard print version. A union catalogue is maintained, with contributions from all participating libraries. Books are distributed from the contracting producer directly to regional and sub-regional libraries. Each network library keeps at least one copy of every NLS-produced title. The NLS is also responsible for developing and disseminating centralised policies at the national level and aims to support a uniform quality of service throughout the library system for visually impaired readers (Fitzpatrick, 1990; Hagle, 1982).
17
Visually impaired people and the social environment
Table 1 Comparison of the major findings of the 1983/84, 1991, 1997 national surveys British Library 1983/84 (Craddock, 1985)
Share the Vision 1991 (Craddock, 1996)
Service provision
96% provided services to homes; 74% to hospitals; 76% to day care centres
92% served visually impaired people through general or special services
Policy
policies for all disabled people: 97%; policies for visually impaired people specifically: 7.9%
Areas surveyed
94% provided housebound services; 62% provided special services policies for all disabled people: 50%; policies for visually impaired people specifically: 5%
Budget allocation
Provision of alternative format materials
RNIB 1997 (Chartres, 1997)
with special budget for visually impaired people: 28%; with special budget for all disabled people: 26% spoken-world cassettes: 86.2%; talking newspaper: 17.1%; books in Braille: 8.6%; books in Moon: 2.6%
Provision of reading aids
spoken-word cassettes: 100%
CCTV: 35%; Kurzweil reading machine: 23%; computerised Braille input/output devices: 7%
CCTV: 50%
Production of sound recordings
Local history: 2.6%; Guides: 3.3%; Talking books: 2.0%; Talking newspapers: 1.3%
12%
Provision of postal services
spoken word: 8.6%; Talking newspaper: 4.6%; Braille or Moon: 1.3%
23%
Co-operation with Social Services
66.5%
89%
Co-operation with Health Services
32.2%
54% (with hospitals)
Co-operation with Talking newspapers
38.8%
25%
Co-operation with NLB
19.7%
12%
Co-operation with RNIB TBS
referral: 15.1%; paying subscription: 7.9%
paying subscription: 18.9%
Concessions
exempt from overdue charges: 39.5%; concessions on requests: 32%; Concessions on borrowing audio cassettes: 61.2%
extended loan period: 33%; exempt from fines: 50%; free borrowing of audio cassettes: 90%
10%
Notes: In the 1983/84 British Library survey, blind people are defined as people who for most purposes cannot see to read or who would require the assistance of special low vision aids. In other surveys, no specific definitions are offered. These results are not strictly comparable because of the different wording of questions in each of the surveys Figures are percentages of all library authorities who responded to the survey.
18
Public library services for visually impaired people
Visually impaired people and the social environment
Most of the regional and sub-regional libraries in the network are funded by the government and are based in local public libraries. Operating under standards developed through the American Library Association and guidelines from the NLS, these libraries register eligible readers, and stock and circulate NLS-produced materials. Network libraries also process requests for and provide instruction in the use of cassette players and other specialist equipment (Fitzpatrick, 1990). Scandinavia
The majority of the Scandinavian countries provide state-funded services for visually impaired people. These are delivered through special libraries which, in most cases, function as the national library for the blind. The libraries are usually responsible for both the production and delivery of alternative formats, but some contract the production process to external producers. During the 1980s and early 1990s, many libraries developed close working relationships with public libraries, setting off a notable trend to decentralisation (Vitzansky, 1991). Denmark, for example, provides one of the best services among these countries through the Danish National Library for the Blind (DBB) and the public library system. The DBB was established as a state institution in 1924. By the late 1970s, however, the level of service provision at DBB became so unsatisfactory due to inadequate funding that many visually impaired users started using public libraries, which provided alternative format materials from their core collections. The process of decentralising library services thus began. However, it was soon realised that a decentralised system without adequate co-ordination entailed new problems. In 1985, as a measure to strengthen its link with the public library system, the DBB moved to the Ministry of Cultural Affairs. In 1990, it became the national library for blind and partially
Public library services for visually impaired people
sighted people, functioning as producer, service provider and co-ordinator of talking book lending in public libraries. A national bibliography of audio recordings is provided as part of the national BASIS database and is accessible to all public libraries (Vitzansky, 1991, 1994a, 1994b). The decentralised service provision model was also taken up in Sweden, Finland, and to a certain degree, in Iceland (Vitzansky, 1991). The same approach was also attempted in Ireland, but with less success (Williams, 1996). In all cases, public libraries are seen as a major local access point. As illustrated in the Denmark experience, the trend to emphasise public libraries’ roles in services for visually impaired people is not accidental. In the past couple of decades, many public libraries have developed within their core collections a remarkable stock of audio materials (e.g. music cassette, spoken word cassette, CDs, etc.), which are readily accessible to visually impaired people. In the meantime, new technologies have made it possible to have immediate access to the whole range of printed stock. Public libraries not only provide local access to these new technologies, but also offer specialist assistance and training. In this respect, few other local organisations can compare with the public library. Summary of trends in UK public library services for visually impaired people, to 1997 The review of the UK public library service for visually impaired people has revealed considerable progress in the past two decades. A neglected area in the 1970s, services for visually impaired people emerged as an important public library service in the 1997 national survey, with the majority of libraries providing specialised services to a certain extent, and half having policies of some sort in place. The development also seemed to have accelerated in the 1990s, with many libraries
19
Visually impaired people and the social environment
launching specialised service centres and many adjusting access to their premises in accordance with the Disability Discrimination Act and other environmental pressures. In view of this trajectory of development, it is now important to assess what the post-1997 period offers for visually impaired people. A recurrent theme in the previous surveys is the inconsistency of service provision among UK public libraries. Great variation has persisted throughout the last two decades in both policy-making and service development. As a recent survey of public library Web sites by UKOLN (Ormes and Peacock, 1999) has shown, such inconsistency is now replicated in the provision of electronic information. The publication of the STV/LA National Guidelines aimed in part to standardise service provision in different libraries. Four years on since its publication, it seems opportune to examine whether UK public libraries now offer better overall services to visually impaired people. Another area that both the 1983/84 and 1997 surveys urged public libraries to address was their relationships with other agencies. The surveys found that there had been inadequate formal co-operation between public libraries and other agencies, although
20
informal contacts and referral relationships did exist. As public libraries continue to develop as community-based providers, their links with other agencies will become an even more significant means of maximising national resources. This issue is, therefore, likely to remain a major concern of policy makers and the different organisations serving visually impaired people. Setting the UK provision in the international context, it appears that the growth of UK public library services for visually impaired people is in fact in line with the general trend to strengthen public libraries as the local access point. However, in comparison with some other countries, the UK does not have a state-funded national library for blind people and is lagging behind in putting co-ordinating measures in place. The union catalogue and the inter-lending system under construction (which form part of the current programme to improve access for visually impaired people) may contribute greatly to this aspect, but whether individual public library authorities are ready for greater co-operation is yet to be seen. These and other related issues form the focus of this study.
Public library services for visually impaired people
1999 survey findings
4. UK public library services to visually impaired people: 1999 survey findings Introduction The analysis is arranged with commentary, tables and figures under the following headings: Respondents Policy statements Budgetary provision Staffing Partnerships Service evaluation Understanding users’ needs Materials provision Equipment Provision of library services Promotion STV News
It ought to be added that additional comments from respondents indicated that the Disability Discrimination Act, especially the enforcement from October 1999, was making more impact on public library provision than the STV/LA National Guidelines (Machell, 1996). Many library services were now beginning to enhance their provision for visually impaired people. Areas that were being planned included: Staff training (4 authorities) Service evaluation (4) User consultation to develop services (6) Written policies for selecting alternative format materials (2) Purchase of special equipment (6) Special services (8)
A copy of the questionnaire used is at Appendix A.
Respondents Table 2 Distribution of respondents among the categories of library authority
Authority type
Number of authorities
Number of respondents
% of respondents
Response rate
London
33
21
15%
64%
Metropolitan District
36
25
18%
69%
Unitaries
46
32
23%
70%
English counties
34
27
19%
79%
Wales
22
11
8%
50%
Scotland
32
20
14%
63%
5
3
2%
60%
208
139
100%
67%
Northern Ireland Total
There was an overall response rate of 67%, with more responses from the English counties (79%) and unitary authorities (70%) (Table 2). The findings are therefore based on a sufficiently large and representative sample to have validity,
Public library services for visually impaired people
although self-selected to a degree. However, the response rate was not as high as that achieved in other LISU surveys: as noted in Chapter 1, the necessary length of the questionnaire was undoubtedly a contributory factor.
21
1999 Survey findings
Policy statements Fig 3
Percentage of libraries with a written policy for services for visually impaired people Special for VIP 5%
is the fact that 42% of respondents had no written policy statement at all for visually impaired people. The recommendation of the STV/LA National Guidelines states: A library authority should clearly state its policies on services to visually impaired people in a mission statement that enshrines the concept of equality of service that is comparable to that enjoyed by the general public and which complies with existing legislation on the provision of services to disabled people (Machell, 1996, xvi).
With disabled 10%
None 42%
With other 43%
Based on responses from 138 authorities
The proportion of library authorities with an explicit policy statement for visually impaired people as a distinct group of people with disabilities remains low at 5% (Fig 3). There is some improvement from the 1997 survey if one includes policies for all disabled people, which encompass visually impaired people. The proportion then rises to 15%. Forty-three per cent of respondents did not apparently differentiate their policy on disabled people from other policy statements but of even more concern Fig 4
Fig 4 identifies categories of authority and analyses their approach to policy-making in this area. Proportionately fewer of the Scottish, Northern Ireland and Welsh authorities had written policies than did English authorities. The next tables and figures present data on the impact of a written policy on the level of services. Less than one-third of respondents provided data on their expenditure on materials for visually impaired people, although there is some evidence that those authorities with a special policy for VIP or disabled people generally spend more on
Policy by authority type 100% 80%
None None
60%
With other
40%
With disabled Special for VIP
20% 0% London (21)
Met. Dist. Unitaries Counties (25) (31) (27)
Wales (11)
Scotland N.Ireland (20) (3)
The number of respondents in each sector is given in brackets
22
Public library services for visually impaired people
1999 survey findings
specialist materials (Table 3). There are insufficient data for this to be formally tested, and the extent to which it is confounded with authority size is unknown.
Close working relationships with external agencies appeared to be more likely when a special written policy was in place (Fig 5).
Table 3 Policy and expenditure on materials Policy type Special for VIP
£100K
33%
With disabled
Fig 5
£50-100K
67%
3
57%
29%
14%
7
With other
23%
59%
9%
9%
22
None
24%
65%
6%
6%
17
Total
20%
57%
10%
12%
49
Policy and overall relationships with external agencies
100% 80% 60% 40% 20%
22 listed) different special services, whereas those with a VIP policy incorporated in other areas provided an average of six different services, and those with no policy an average of five. There is no evidence of a difference between the categories in the average number of types of specialist equipment provided. More details on the services and equipment covered by the survey are given on pages 35-39.
0% Special for VIP (7)
With disabled (14)
Close working relation
Referral Referral
With other None (58) (59) Occasional formal contact Hardly any relation
Fig 6
Policy and number of special services provided
100%
The number of respondents in each category is given in brackets. See page 31 for details of relationships with external agencies.
80%
Written policy making also made some difference to numbers of special services (Fig 6) or specialist equipment provided (Fig 7), particularly where the authority had a dedicated written policy for visually impaired people.
20%
The twenty-one authorities with a special policy for VIP or which included them in more general policies for disabled people provided an average of nine (out of a total of
Public library services for visually impaired people
60% 40%
0% Special for VIP (7)
10 +
10+
With disabled (14) 6-9
With other None (58) (58)
3-5
1-2
None
The number of respondents in each category is given in brackets.
23
1999 Survey findings
Fig 7
Policy and variety of special equipment provided
Fig 8 shows the proportions of respondents with written policies covering particular areas. These were focused on services to the housebound, resources available in alternative formats, staff training and access to library buildings and materials through signs and guiding. Given that many visually impaired people do not register with their Social Services department and may be unaware of the services available to them through their public library service, the relatively low priority given to user needs research and promotional/marketing strategies is of concern. The situation has changed little since the 1997 survey, which also showed inadequate emphasis on these key issues.
100% 80% 60% 40% 20% 0% Special for VIP (7)
66+ +
With disabled (14) 4-5
With other None (58) (58)
2-3
1
None
The number of respondents in each category is given in brackets.
Fig 8
Areas covered within written policies (11)
Promotional / Marketing strategies
(13)
User needs research Nature & extent of in-library assistance
(16) (16)
Use & borrowing of special equipment
(20)
Relations with other agencies for the VIP Specialist equipment available
(27)
Signs and guiding
(28)
Access within the building
(28) (36)
Access into the building Staff training
(37)
Resources available in alternative format
(49)
Delivery of resources to the housebound
(50)
0%
10%
20%
30%
40%
50%
60%
70%
80%
90% 100%
Based on data from 57 respondents. The number of authorities listing each service is given in brackets.
Fig 9
The most important factors affecting libraries’ decisions in providing services for visually impaired people Other Elected members
(4) (10)
Library services for VIP in other areas
(28)
The National Guidelines by STV/LA
(29)
Influence of other agencies for VIP Government legislation Staff ideas/initiatives Request by VIP users and their relatives Tradition of library services to VIP 0%
(48) (55) (61) (86) (97) 10% 20% 30% 40% 50% 60% 70% 80% 90% 100%
Based on data from 138 respondents. The number of authorities listing each factor is given in brackets.
24
Public library services for visually impaired people
1999 survey findings
The factors seen as most significant to library managers in deciding how to provide for the reading and information needs of visually impaired people may be seen to bear out this lack of a proactive approach to determining needs (Fig 9). The most important factor was the tradition of providing services within the library authority, followed by requests from visually impaired people and their relatives. Staff ideas and initiatives were also significant - more so than either government legislation or the National Guidelines, which had had comparatively little impact on policy making. Other influencing factors were the partnerships between public libraries, Social Services departments and local voluntary organisations and the wider strategic aims of local authorities in relation to social exclusion. The Disability Discrimination Act is, however, likely to be a considerable influence in future, from the additional comments received from respondents. Respondents were asked to rate four objectives for their importance in decision making, relating to services for VIP, and the responses are shown in Fig 10. The objectives underpinning services concur with the emphasis of the National Guidelines: Fig 10
The concept underpinning library services to visually impaired people is that of equality... the concept of equality of access also embraces that of integration with mainstream services. (Machell, 1996, 3) Seven respondents mentioned other objectives, including Best Value, ‘supporting people locally’ and ‘social inclusion’. These were all rated as either important or very important.
Budgetary provision Fig 11 shows how budgets are allocated to services for the visually impaired. There was considerable variation in the responses, which reflected the different ways in which library services interpret their services to visually impaired people. Some authorities considered they had a special budget allocation, when in effect the budget just covered provision of materials in an alternative format (e.g. large print), while others regarded themselves as having a special budget allocation if their budget covered all services. Where additional information was supplied by respondents the responses were standardised, so that the
Importance of the objectives in serving visually impaired people
Image of the library Empowerment of VIP Integrity of services for all Equality of access 0% Very important
20%
Important Important
40%
60%
Moderately important
80%
100%
Not important
Based on data from 136-138 respondents.
Public library services for visually impaired people
25
1999 Survey findings
criterion used for ‘special budget’ was: a specific fund for one or more regularly stocked alternative formats. If part of the budget was earmarked for membership subscriptions or for exceptional purchases of hardware or software packages this was not considered part of the recurrent ‘special’ budget. Fig 11
None 57%
Budgeting Special allocation for VIP 27%
Within budget for sensory impaired 4% Within general special needs budget 12%
Based on data from 139 respondents.
Most authorities did not have a specific budget allocation for VIP services, and the percentage appeared to have decreased slightly since the 1997 survey, when half of the authorities had a budget either for the visually impaired or included in the budget for people with special needs (43.1% in the current survey). Twelve authorities (8.6%) reported receiving special project funding for the visually impaired. The 1997 survey included one-off capital purchases for equipment in the assessment of recurrent budget, which may account for the discrepancy. The National Guidelines emphasise that resource allocation for service development is necessary (Machell, 1996, 3), but specific guidance on budget allocation is not given. This contrasts with guidance given in other
26
areas, such as provision for children and young people, where recommendations on a percentage of the budget, related to percentage of the user group in the population served, is specifically given (Library and Information Services Council (England) Working Party on Library Services for Children and Young People, 1995, Rec 8). Per capita resources spend and materials fund per capita for this user group are reported regularly in the annual LISU surveys of Library Services to Schools and Children (Creaser, 1999), which enables monitoring of performance against policy statements. Fig 12 gives an analysis of budgeting approach by category of authority. English counties and unitary authorities are slightly more likely to have a special budget allocation of some form than authorities in other sectors. Perhaps surprisingly, there was no evidence that the existence of a special budget was associated with higher levels of spending; however relatively few responses were received in this area, and it has not been possible to relate the figures to numbers of visually impaired people served. There was also no evidence of any association with the level of contact with external organisations. There was, however, some evidence that authorities which do not have a special budget allocation also provide fewer special services and a narrower range of equipment for visually impaired people on average, shown in Figs 13 and 14. On average, authorities with a special budget allocation including visually impaired people provided 6.6 different services and 2.8 types of equipment, compared to 6.1 services and 2.6 types of equipment provided on average by authorities with no special budgetary allocations.
Public library services for visually impaired people
1999 survey findings
Fig 12
Budgetary allocation by authority type 100% No special No special allocation allocation
80% 60%
Within general special needs budget
40%
Within budget for sensory impaired
20% 0% London Met. Dist. Unitaries Counties (21) (25) (32) (27)
Wales (11)
Scotland N.Ireland (20) (3)
Special allocation for VIP
The number of respondents in each category is given in brackets.
Fig 13
Budget allocation and special services provided 100% 80%
None
60%
1-2 3-5
40%
6-9
20%
10 10+ +
0% Allocation for VIP With sensory (38) impaired (5)
With special needs (17)
No special allocation (78)
The number of respondents in each category is given in brackets.
Fig 14
Budget allocation and range of special equipment provided 100% None
80%
1 60% 2-3 40%
4-5
6+
20%
6+
0% Allocation for VIP (38)
With sensory impaired (5)
With special needs (17)
No special allocation (78)
The number of respondents in each category is given in brackets.
Public library services for visually impaired people
27
1999 Survey findings
Fig 15
Reported expenditure for VIP, 1998-99
£'000 200
Subscriptions
180 Equipment
160 140
Materials Materials
120 100 80 60 40 20 0
Authority
Only 54 library authorities were able to account for their actual expenditure on materials, equipment and membership subscriptions for VIP in 1998-99, and the large variation recorded therefore indicates both the lack of accuracy in estimates and an actual variability in spend. 48 reported expenditure on materials, 16 on equipment and 14 on subscriptions, shown in Fig 15. Monies reported as project funding have been included here.
Authorities with larger populations can be expected to spend at higher levels than those with smaller populations. Relatively few authorities were able to provide data on the numbers of visually impaired people in their resident populations, or membership, and it was not possible to explore this aspect. Staffing Fig 16 shows how staffing for services to the visually impaired is managed. Several authorities reported staff in more than one category. Some authorities, especially those who included VIP services in their overall service for special needs, were unable to
Part of this variability in spending levels will be accounted for by the size of the library authority in terms of the number of visually impaired people it aims to serve. Fig 16
Staffing for services Senior staff manage service Full time post for VIP Part time posts for VIP Certain staff hours for VIP Voluntary staff for VIP No special staffing for VIP 0%
5%
10% 15% 20% 25% 30% 35% 40%
Based on data from 138 respondents.
28
Public library services for visually impaired people
1999 survey findings
identify full-time individual posts or staff hours dedicated to the visually impaired. Despite these shortcomings in the data, the result is nevertheless similar to that in the 1997 survey, which found that 62% of authorities employed special services staff as part of the team responsible for VIP needs.
gathered it was impossible even to discern a base-line figure, as the range was so great, and the ‘no special staffing for VIP’ could mean simply that VIP needs were being met within more broadly defined services for special needs. Figs 17-19 show the relationship between staffing practices and service levels. Specialist staffing did appear to ensure more formal contacts and working relationships with external organisations - unsurprisingly, as presumably this formed part of their job descriptions. It also made some impact on the number of special facilities provided.
The National Guidelines recommend that: A designated member of staff at senior level, with appropriate professional qualifications, should be responsible for the planning, implementation, operation and monitoring of services to visually impaired people. There should be sufficient staff on the establishment with special responsibility for services to visually impaired people, to ensure that services operate effectively. (Machell, 1996, 11)
Fig 17
Staffing and relationship with external organisations
100% 80%
Hardly any relation
60% Referral Referral
The number of staff employed varied considerably, as shown in Table 4. The authority reporting 180 hours of volunteer help also put considerable library resources into services for the visually impaired. The lack of clarity regarding staffing levels in library authorities means that defining ‘sufficient’ (in terms of the guidelines) is problematic. From the responses we
40% Occasional formal contact
20%
Close working relation
0% Some special No special staff staff (84) (54)
The number of respondents in each category is given in brackets.
Table 4 Staff numbers and expenditure Minimum Full time staff
Maximum
Mean
No. included
1
6
1.6
27
0.4
6.0
1.7
19
Hourly staff (hours/week)
3
75
20.2
23
Volunteers (hours/week)
2
180
39.5
8
£4,400
£79,410
£27,422
11
Part time staff (FTE)
Staff expenditure
Public library services for visually impaired people
29
1999 Survey findings
Fig 18 Staffing and special services provided
Fig 19 Staffing and special equipment provided
100%
100%
None
None
80%
80%
1-2
1 60%
60%
2-3
3-5
40%
40%
4-5
6-9
20%
20%
6+ 6+
10+ + 10
0% Some special staff (83)
0% Some special staff (83)
No special staff (54)
No special staff (54)
The number of respondents in each category is given in brackets.
The number of respondents in each category is given in brackets.
Fig 20 shows the proportions of authorities offering training in various aspects of VIP services to their staff. A number of authorities reported that staff training in one or more areas was being planned, but overall the figures were disappointing in relation to specific elements of service, particularly the use of assistive technology, equipment and understanding of the publishing sector. The National Guidelines state that:
instruction in appropriate practical skills, through an in-service programme which preferably involves local visually impaired people in the training process. The 1997 survey found that 70% of staff had received visual awareness training, while in the current survey this had fallen to 66.9% receiving training in the special needs of the visually impaired.
All staff should undergo basic training in visual disability awareness and Fig 20
Staff training in relation to services for visually impaired people Special needs of VIP Use of cassette players Use of CCTV Use of reading machines Other agencies Government policies Publishing sector Adapted computer equipment Specialist staff Adapted software
Other staff Other staff
Use of optical scanners Use of Braille embosser Other 0%
10%
20%
30%
40%
50%
60%
70%
80%
Based on data from 139 respondents.
30
Public library services for visually impaired people
1999 survey findings
Partnerships Fig 21
Relationships with other organisations working for visually impaired people Close working relations For referrals only
Occasional formal contact None
None
Social services
(138)
Local society for self help groups
(129)
Voluntary organisations
(134)
Local health authorities
(127)
Local vision clinic
(123)
0%
20%
40%
60%
80%
100%
The number of respondents in each category is given in brackets.
Fig 21 shows the extent of contact with other organisations at local level working with visually impaired people. Despite the increased strategic emphasis on the need for partnership between local authority departments and the voluntary and for-profit sectors, it was disappointing that, compared with the 1997 survey, the percentage of authorities with regular, close working relationships with other agencies had actually decreased. Interestingly, the proportion of authorities having no relationships at all with other agencies had also decreased. There was a larger
proportion now reporting occasional formal contact and referrals from other agencies. Authorities are likely to relate to alternative service providers in more than one way (Table 5). Two authorities reported subscribing to the National Talking Newspaper and other providers on behalf of visually impaired members, but only one of these was able to give the number of members whose fees were paid. Nineteen authorities reported paying subscriptions for the RNIB Talking Books service. The number of members on whose behalf these subscriptions are paid varied from 52 to
Table 5 Relationships with other reading service providers Working relations
Hold information
National library for the blind
22%
18%
71%
n/a
RNIB Talking books service
27%
17%
65%
14%
Calibre table library
17%
5%
61%
n/a
ClearVision project
13%
17%
35%
n/a
Local talking newspapers
19%
37%
54%
n/a
National talking newspapers
14%
9%
55%
1%
0%
5%
3%
1%
Other
Referral
Pay subscriptions
Based on data from 139 respondents.
Public library services for visually impaired people
31
1999 Survey findings
1,481 (based on 18 responses). Nine authorities also gave information on their total numbers of visually impaired members; in these authorities subscriptions were paid for between 27% and 100% of registered members. One other authority added that local charities were paying membership subscriptions. Other service providers for which library authorities were paying individual membership subscriptions included the NLB (15 -29 members) and the National Listening Library.
impaired people in a local geographical area should co-operate with each other to improve and extend the overall provision for the benefit of visually impaired users.(Machell, 1996, 16).
Service Evaluation Fig 22
Authorities using formal evaluation methods
None 27%
Of the 19 authorities who reported paying membership subscriptions, 74% did so for members who are registered blind or partially sighted; 32% for those unable to read less than N12pt print; 26% for those referred by health service professionals; 37% for those referred by social services; and 10% where the individual reported difficulty seeing. Five per cent allowed other criteria.
Planned 3% In place 70%
Based on data from 139 respondents.
As in the 1997 survey, the majority of library authorities held information about other service providers, but only a minority had close working relationships with them although the proportion varied according to the provider. Closer relationships with local talking newspapers were more common. In 1997, 31 authorities contributed towards individuals’ membership of the RNIB Talking Book Service. Of those who responded to this survey all but two who paid the subscriptions in 1997 were continuing to pay them; one of these reported that a local charity now paid with 25% grant aid from the local authority. The National Guidelines recommend that:
Fig 22 shows that the majority of authorities were using formal evaluation of their services to the visually impaired, although there was a considerable minority of 37 authorities which were not. Four authorities reported that service evaluation was being planned. Ninety-eight authorities reported that they used one or more methods to evaluate services, and these are shown in Fig 23. Some commented that they do so as part of general service evaluation. Other standards/methods applied included: • • •
a special standard for VIP services professional quality teams user focus groups.
Libraries of all types, and organisations serving visually
32
Public library services for visually impaired people
1999 survey findings
Fig 23
Approaches applied in evaluating services for visually impaired people
57
User satisfaction survey 50
Library service performance indicators 26
STV/LA guidelines 12
Against other standards Other methods 0%
8 10%
20%
30%
40%
50%
60%
Based on data from 98 respondents. The actual number of authorities reporting each method is also given.
Understanding users’ needs Fig 24
Consultation with users and other professionals in developing services
80 70 60 50 % 40 30 20 10 0 Selection of materials
Premises design/alteration
Purchase of equipment
With With users users
Staff training
Formation of policies
Establishing external links
With other professionals
Based on data from 138 respondents
Forty-one per cent of authorities reported using user surveys to evaluate their services to the visually impaired, but almost twice as many (112, 81%) reported consulting users concerning one or more areas of service development. This is shown Fig 24. Six authorities reported that user or professional consultation is currently being planned. The National Guidelines emphasised the need to consult users and obtain professional advice on almost every aspect of service development. The 1997 survey did not directly investigate this, but noted that few
Public library services for visually impaired people
authorities had undertaken any detailed user studies and only 50 (30%) held information about who were the targeted visually impaired users in their catchment area. An exception was that of the selection of reading materials, for which over two-thirds of library services did seek the views of visually impaired users. In the current survey, this has fallen to 44%; it is interesting, however, that this is the only area where users of the service are more likely to be consulted than other professionals (Fig 24).
33
1999 Survey findings
As in the 1997 survey, a minority of authorities (52 out of 131 respondents, 40%) held management information on visually impaired users. From additional information provided by respondents it appeared that users were identified largely to ensure they were exempted from charges and to ensure Fig 25
they could benefit from postal and housebound services. A total of 46 authorities were able to supply data on the numbers of visually impaired people in the resident population, or who were members of the library (Fig 25).
Numbers of VIP in the population and as library members 14,000
Registered Registered Library members
12,000
Visually impaired
10,000
8,000
6,000
4,000
2,000
0 0
200,000
400,000
600,000
800,000
1,000,000
1,200,000
1,400,000
Resident population
Based on data from 46 authorities
Fig 26
Percentage of VIP who are library members 60
Percentage library members
50
40 30 20
10 0 0
1,000
2,000
3,000
4,000
5,000
6,000
7,000
8,000
9,000
Visually impaired population
Based on data from 22 authorities
34
Public library services for visually impaired people
1999 survey findings
format headings does not imply a corresponding lack of provision. Three authorities, for example, indicated that they provided items in other formats on request, from the NLB or ClearVision. A frequently indicated ‘other’ format was audio-described videos. Large print books and spoken word books comprised the majority of formats acquired by libraries - confirming that the book was still the preferred medium for leisure reading and information access, whether by hard copy or through audio access.
A number of respondents noted that the actual number of visually impaired users was difficult to establish. Fig 26 shows the relationship between the visually impaired population and library users in the 22 authorities who supplied both figures. The percentage of the visually impaired who were library members ranged from 2% to 55%, with an average of 29%. This compares with figures for the public library service as a whole of 58% of the population who claim to hold a public library ticket (Book Marketing Ltd, 1998), and 38% who are active borrowers of material (CIPFA, 1999).
For large print and spoken word books, alternative data are available, recorded in the CIPFA Library Statistics Actuals (CIPFA, 1999). For spoken word, this gives figures for acquisitions as well as holdings, and all authorities which supplied figures to CIPFA for 1998-99 indicated that they had made acquisitions in this area. It seems likely therefore, that the number of authorities reporting acquisitions across the range of materials in the current survey is under-reported.
Clearly, understanding the profile of the population of library users, and equally importantly, potential users, with special needs was a key issue in order that library managers could develop appropriate services and monitor their take-up. Materials provision Fig 27 illustrates the percentage of authorities holding a selection of special materials for visually impaired users, and those adding to their holdings in 1998-99. A lack of holdings under any of the alternative Fig 27
Holdings of alternative format materials 100%
100%
100% 84%
81%
80%
60%
40% 25%
25%
20%
14% 8%
22% 17% 10%
6%
10%
9% 7%
7%
3% 2%
0% Large print books
Large print magazines
Large print newspapers
Braille materials
Stocked Stocked
Moon books
Spoken word books
Talking magazines
Talking newspapers
Other
Added in year 98-99
Based on data from 134 authorities
Public library services for visually impaired people
35
1999 Survey findings
Fig 28
Large print and talking books per 1,000 resident population
120
Total Total large large print print
100
Total talking books 80 Talking book acquisitions 60
Large print on loan
40
Talking books on loan
20 0 London
Met. Districts
Unitaries
Counties
The survey asked for details of the size of holdings in alternative formats. Less than half the respondents were able to supply this information, even for large print and talking books. It would be possible to present these data; however, they are of limited value unless related to authority size. Since figures on the visually impaired population and/or membership are available for relatively few authorities, Fig 28 is drawn from the CIPFA Actuals 1998-99 (CIPFA, 1999), and figures are taken per 1,000 resident population. The number of authorities on which these figures are based varies between 137 and 190 for the UK as a whole. The National Guidelines state that: Within the limits of the range of materials available, the library should stock large print and spoken word [materials] in sufficient quantity to meet the general and special reading and information needs of users (Machell, 1996, 32). While the 1997 survey found that all of the respondents held spoken word and large print books, the size of those holdings was not investigated. Data on talking books have been collected by CIPFA since 1995-96 and on large print materials since 1997-98. In four years, the average number of talking
36
Wales
Scotland
N.Ireland
books per 1,000 resident population has increased from 32 to 34. The overall number of large print books per 1,000 resident population increased from 100 in 1997-98 to 102 in 1998-99. Fig 29
Policy considerations for selecting alternative format materials User needs
Decision of specialist staff Whether sufficient titles available A written selection policy
Other 0% 20% 40% 60% 80% 100%
Based on data from 138 authorities
Fig 29 shows the policy considerations taken in account when selecting alternative format materials for VIP. The other considerations noted by respondents included:- the available budget; the range and quality of available materials; VIP user group inputs; and cost and future use - each by one authority. Fig 29 should also be seen in relation to Fig 3
Public library services for visually impaired people
1999 survey findings
(Percentage of libraries with/without a written policy for visually impaired people), where only 57% of library authorities had a written policy on provision for visually impaired people. It is therefore disappointing but consequently unsurprising that so few respondents (14.5%) had a written policy on the selection of materials. While specialist staff were making decisions, the lack of a policy statement that could be widely communicated to all the stakeholders including elected members, and other staff, as well as visually impaired users - was concerning. Authorities were asked whether they notified their regional library system of their holdings for visually impaired people. One hundred and thirteen authorities responded, of which 49% did notify the regional library bureaux of their holdings, and 51% did not. A lack of policymaking could be the reason for this. Holdings of large print and spoken word materials in minority languages are shown in Fig 30. Provision of such material should be related to the requirements of the catchment population. For example, nine of the11 Welsh authorities which responded to the survey reported holdings of large print books in
Fig 30
Welsh, and seven held spoken word materials in the language, while only two non-Welsh authorities held any materials in Welsh. Overall, 37 authorities (27%) reported holdings of large print material in one or more minority languages, and 42 (30%) held talking books. Four authorities also reported that they had arrangements with external organisations (e.g. neighbouring authorities) for the supply of minority language materials. These have not been included in Fig 30, because the language of those materials provided on request could not be specified. Three authorities indicated that they had difficulty in obtaining alternative format stock in minority languages, particularly large print materials. The percentage of authorities catering for the minority language needs of their communities appeared to be lower than was the case in the 1997 survey, in which 50% provided large print and/or spoken word materials. Whether this was due to a lack of availability or to selection decisions was unclear. The situation is unsatisfactory, in view of the STV/LA National Guidelines’ (Machell, 1996) statement that:
Availability of alternative format stock in different minority languages 25%
Large print
Large print 20%
Spoken word 15%
10%
5%
0% Welsh
Chinese Gujarati
Hindi
Punjabi
Bengali
Urdu
Turkish
Greek
Other
Based on data from 138 authorities
Public library services for visually impaired people
37
1999 Survey findings
and reference materials was less so. This may reflect current usage and demand, but nevertheless raises questions about how public libraries are responding to the information needs of visually impaired people and where provision might be developed.
Visually impaired people from ethnic minority communities should, as far as possible, have access to an adequate supply and delivery of first language materials and titles available in alternative formats. Libraries serving large populations should maintain collections in the languages relevant to their communities, supplemented by inter-loan.
Most library authorities were operating regular weeding, with 90% of respondents doing this at least once a year. None reported weeding stock less frequently than once every five years. The principal criteria used were physical condition, by 97%, and circulation statistics (83%). Only 22% reported user consultation regarding stock weeding and this needs to be seen in the context of the relatively high percentage of visually impaired users and their relatives generally involved in decision making on services (Fig 9). Weeding is an operational task that librarians undertake as part of their normal professional duties.
All authorities provided adult fiction in alternative formats, and all but one provided biographies. While the lack of coverage noted in Fig 31 only relates to library stock and not to availability (materials were also available on inter-library loan and some libraries enlarged or transcribed material on request), there are some notable omissions. The availability of adult fiction and biography was good, but non-fiction, especially scientific, technical and medical Fig 31
Areas that are not covered by alternative format holdings Biography
(1)
Children’s fiction Information about visual impairment Travel books Adult utility materials (e.g., cookery) Community information
(10) (15) (15) (37) (40) (52)
News In-house publications
(59) (74)
Reference books
(90)
Scientific, technical & medical
(119)
School text books
0% 10% 20% 30% 40% 50% 60% 70% 80% 90% 100%
Based on data from 136 authorities Figures in brackets give the number of authorities in each case
38
Public library services for visually impaired people
1999 survey findings
Equipment Table 6 Provision of specialist reading equipment Number of authorities
% of respondents
Average number
Maximum
Number included
Cassette player/recorder
94
68%
17.2
300
71
CCTV/ low vision reading machines
79
57%
2.2
8
67
Kurzweil reading machine
43
31%
1.4
4
33
Computers adapted for VIP
36
26%
9.6
74
23
Software adapted for VIP
34
25%
1.8
8
21
Optical scanner
22
16%
2.6
12
16
Braille embosser
22
16%
1.4
6
20
Separate reading room
11
8%
2.3
6
9
Based on data from 138 authorities
Provision of specialist equipment is also important for visually impaired users, and the number and percentage of authorities offering a range of types of equipment is shown in Table 6. The quantity of equipment available was also requested, and the majority of authorities were able to provide this information. This is summarised in Table 6; however, it is of limited value without reference to the numbers of visually impaired people in the population. What is beyond doubt, however, is that the majority of authorities do not have sufficient equipment to have some in every branch, or even every large branch (see also Table 8).
Provision of library services Authorities were asked how often services were provided to the visually impaired users (Fig 32). Additional comments from the respondents revealed that the take-up of general services by visually impaired people is difficult to ascertain. Services are open to all and are not monitored for their use by visually impaired people. The data in Fig 32 can therefore only be seen as an approximation of use. This is an area where a user survey is recommended to obtain more reliable and objective results.
The National Guidelines nos 39-41 offer recommendations on the provision of reading aids and specialist equipment (Machell, 1996, 41-42). The results of this survey show a notable improvement in provision compared with 1997. In 1997, 47 (out of 164 respondents) had CCTV in the central or main library; 15 had optical scanners; 13 provided Braille embossers and 21 cassette recorders (Chartres, 1997, 10-11).
A library and information service should aim to make available to visually impaired people all the services that are available to the general public, by whatever means are appropriate to their needs (Machell, 1996, 16).
Public library services for visually impaired people
The National Guidelines state that:
39
1999 Survey findings
Fig 32
The take-up of general library services by visually impaired users
Arts & crafts programmes
(91)
Distance learning support
(85)
Homework assistance
(95)
Story telling
(101)
Book talks/discussion
(104)
Online database searches
(107)
Reference/Enquiry services
(125)
0%
20%
Often
Often
40%
60%
Occasionally
80%
100%
Never
The number of authorities on which the percentages are based is given in brackets
We were not able to ascertain from responses the extent to which library authorities were able to identify use of general services and, equally important, to understand barriers to use and how they could be overcome. Special services provided are more easily identified, and the provision of these is shown in Table 7. The National Guidelines cover these issues in sections G5,6,7,18,19,36,38 and 45 (Machell, 1996). The 1997 survey noted that 94% of library authorities provided outreach services through home visits, a similar finding to this survey (92.8%), while 14 provided large print/speech access to catalogues (Chartres, 1997, 10).
40
The data from the current survey indicate a patchy response to the special requirements of visually impaired people (Table 7). There was good coverage through housebound services and basic access to buildings (guide dogs allowed, automatic doors), but less consideration given to the need for appropriate access through signing and guiding, assistive technology, and the design of procedures to enable visually impaired people to join and borrow materials on the same basis as fully sighted people - that is, without having to request special assistance from staff.
Public library services for visually impaired people
1999 survey findings
Table 7 Special services provided for visually impaired people Services provided
Number of authorities
% of respondents
Guide dog allowed
129
93%
Outreach service for the housebound
128
93%
97
70%
Automatic door(s) Retrieval of materials from stacks
74
54%
Accessible information about the library service
52
38%
Catalogues of materials in alternative formats
51
37%
Specially coloured/sized signs
43
31%
Training in use of special equipment
42
30%
Audio recording of library materials
36
26%
Access to Internet with assistive technology
27
20%
Brailling of library materials
26
19%
Typeset enlarging of library materials
23
17%
Access to CD-ROM/online database with assistive technology
22
16%
National/regional databases incorp. alternative format materials
21
15%
Tactile signs
19
14%
Accessible enrolment forms
13
9%
Orientation programme
9
7%
Specially designed shelf marking
8
6%
Directory of accessible Web sites
8
6%
Directory of Braillists
7
5%
Accessible reservation forms
6
4%
Transportation
4
3%
Based on data from 138 authorities
Table 8 Provision of special materials/services at different types of service point
(Percentage of authorities)
Central/ Main library
Branch library
Mobile library
100%
91%
Institutions 74%
service to the house-bound
Large print materials
89%
99%
Braille materials
26%
4%
1%
1%
7%
Spoken word materials
88%
97%
83%
65%
86%
Catalogues for VIP
29%
24%
19%
9%
17%
Specialist reading equipment
47%
27%
4%
Production of materials in alternative formats
27%
17%
12%
Specially coloured/sized signs
24%
22%
8%
Assistance (e.g. orientation)
42%
42%
33%
Based on data from 139 authorities One authority does not have a mobile service Two authorities do not have a housebound service
Public library services for visually impaired people
41
1999 Survey findings
The National Guidelines consider the extent to which a library service should make provision at a range of outlets at G18 and 33 (Machell, 1996). Table 8 shows the extent to which this was occurring in practice. Large print and spoken word materials were by far the most commonly available across all service outlets. It was concerning that visually impaired users would usually have to travel to a main or central library in order to use specialist reading equipment; investment in technology to support visually impaired people in their local community libraries would appear to be an issue. Fig 33
Provision of free or concessionary special services
Free
Free
Postal delivery
Concessionary rate Equipment Interlibrary Loan Extended loan Audio materials 0%
20%
40%
60%
80%
100%
Based on data from 133 authorities
A number of concessions are generally available to visually impaired users, either specifically or as part of a wider scheme of concessions for disabled people. Details of the charges made in each authority for audio materials, fines and reservation fees, and of concessions made, are published annually by Sheffield Hallam University for England and Wales (Robertson, 1999) and by North Ayrshire Council for Scotland (Martin, 1999).
42
Fig 33 summarises the main concessions reported in the current survey. While audio materials were generally provided free, it was notable that other services were either charged for on the same basis as for fully sighted people, or with only some concessions. In 1997, only 10% of authorities provided a free postal service (14.4% in this survey); 90% offered free borrowing of audio materials (92.8%); just under a third offered an extended loan period (43.9%). The situation has therefore improved slightly. The National Guidelines consider this issue at G4 (Machell, 1996, 5).
Promotion The National Guidelines also refer to promotion, (Machell, 1996, 49) and in the 1997 survey it was found that personal contact, house-bound services and mobile library services were the most common means of promoting services for visually impaired people (Chartres, 1997). Personal contact, whether through local societies and clubs, contact in the library or through mobile and housebound services is clearly still the major means of communicating with users and potential users (Fig 34). We did not probe how effective each of these methods was considered to be and this would be a key issue for any follow-up study. Ensuring that all those for whom library services would be beneficial are made aware of the range of provision available to them is particularly important for groups who suffer disadvantage by reason of disability. While the responses were encouraging, it was therefore concerning that not all authorities regarded this as an essential part of their service, and that by no means was there comprehensive promotional coverage in local communities.
Public library services for visually impaired people
1999 survey findings
Fig 34
Promotion of services None Other Advertising Exhibitions Posters / leaflets at health centres, hospitals via local talking newspapers via local society /club via mobile library service via Housebound service Personal contact at library 0%
10% 20% 30% 40% 50% 60% 70% 80% 90% 100%
Based on data from 137 authorities
STV News Fig 35
STV News not useful
100%
not sure
not sure
90%
all staff
not sure
80% 70% 60%
useful managerial staff only
50% yes
40% 30% 20%
managerial and special staff
very useful
10% 0%
special staff only
STV news read by
Perceived usefulness Intention to subscribe
Based on data from 110 authorities
As part of the development of STV as an information resource for library service managers, it was decided to ask questions about how many library staff read STV News, its perceived usefulness and whether respondents wished to subscribe. The findings, shown in Fig 35, indicated general
Public library services for visually impaired people
satisfaction with the publication, but it was notable that only specialist and/or managerial staff were the main readers. There was scope to widen its readership in library authorities, as part of the ongoing development of all staff in serving visually impaired people.
43
Conclusions and recommendations
5. Conclusions and recommendations From the surveys undertaken prior to this one, there was evidence that public library services needed to focus more clearly on meeting the needs of visually impaired people, despite the undoubted progress since the 1970s. Inconsistency of provision was a major issue. The 1997 RNIB Survey confirmed the findings of previous work, particularly with regard to the lack of consistent policy making, separate budget allocation, specialist staff and training in visual awareness. In their recommendations to managers, monitoring the use of services, marketing research, promotion, policy development and standardisation, and the need to strengthen relationships with Social Services departments, were highlighted. There was concern that housebound services, which were provided by over 90% of library authorities, were not meeting the needs of some visually impaired people. Not all those with an impairment were registering with Social Services or indeed with their GP and supporting those who for whatever reason were not being identified was a particular challenge. It was intended that the present survey would identify the extent to which services had moved on since those findings and recommendations. International good practice was also considered - the UK has no state-funded national library service for visually impaired people - and it was recognised that co-ordination of services was lagging behind that of countries such as the USA. There, the Library of Congress National Library Services for the Blind and Physically Handicapped takes responsibility for developing and disseminating policy to support uniform quality of service. 1. Policy statements This was seen as a key area for action. If policy is not in place services will not develop. While there was some improvement since 1997 in the numbers of
44
authorities with written policy statements, it was of real concern that 42% of respondents had not implemented this important element of their strategy. Scotland, Northern Ireland and Wales appeared to be furthest behind. In Scotland, not only did fewer than half the authorities have any written policy for visually impaired people, none had included such a policy within a disabled policy statement. The English counties had the highest number of specially written policy statements for visually impaired people, but even here this only accounted for 20% of respondents. There was evidence that having a dedicated policy for visually impaired people made an impact on the spend on specialist materials, on relationship building with external agencies and on the provision of specialist equipment. Where authorities had a written policy they were more likely to focus on meeting a wider range of the special needs of visually impaired people. The low priority given to market research/promotion and user needs analysis in policies was also of concern. A clear policy statement which will be shared with staff, members and visually impaired people is both a promotional tool and a key performance indicator. Recommendation 1.1 To the DCMS and public library authorities
All public library authorities should provide clear policy statements and plans for the provision of services to visually impaired people, in their Annual Library Plans. A visually impaired policy may be a subset of a policy and plan for disabled people as part of a local authority’s policy on social exclusion and the requirements of the Disability Discrimination Act, but it should also be specific about the needs of visually impaired users in the community. It should focus on identifying library and information needs and the promotion of services to all
Public library services for visually impaired people
Conclusions and recommendations
those who require them, whether or not they are registered as visually impaired. It should also specify the partnerships and co-operation to be developed. 2. Budgetary provision There was a lack of clarity in the responses on how much authorities were spending on services to visually impaired people, largely because most authorities did not have a budget allocation for VIP services. Few authorities were able to provide data on the numbers of visually impaired people in either their resident population or in membership so that per capita spend on the visually impaired user group could not be explored. This was clearly not a satisfactory situation, given that spend to support the needs of disabled people and of the specific user groups within this category is an important indicator for a library authority. There was some evidence, for example, that a special budget allocation does influence the range of services and equipment provided. Recommendation 2.1 To CIPFA and public library authorities
Spend per thousand (whole population) on visually impaired services should become a required statistic. This should include spend on materials, equipment and membership subscriptions for VIP. Spend per capita of the estimated user group is recommended as an additional indicator, to inform the development of effective services. 3. Staffing There was similar confusion with these data, as several authorities reported staff in more than one category. Defining how many staff were sufficient to provide an effective service was therefore problematic. However, there was a clear relationship between staffing practices and the development of formal working relationships with partner organisations. As staff are clearly a key element in delivering the service, this lack of
Public library services for visually impaired people
data was of concern. Equally perturbing was the finding that a third of staff had received no basic visual awareness training, and that few non-specialist staff were being trained in specific areas such as the publishing sector and use of assistive technology and equipment. Recommendation 3.1 To CIPFA and public library authorities
FTE specialist staff per thousand (whole population) to meet the needs of visually impaired people should become a required statistic. Recommendation 3.2 To the DCMS and public library authorities
A training strategy for the library service should include targets for the training of all staff in basic visual awareness and for those elements of the service that are essential for the delivery of an effective service to visually impaired users. Such a strategy, with medium and short-term targets, should form part of the Annual Library Plan for the authority. 4. Partnerships The numbers of authorities having close ongoing relationships with other agencies had decreased since 1997. The emphasis on occasional formal contact had increased, however, together with referrals. There was a sense that the co-ordination of these partnerships could be less well developed than international examples, and there was a danger of fragmentation of effort. Local and regional collaboration should be explored, to improve services to users. Recommendation 4.1 To the DCMS, RNIB, NLB, STV
Mechanisms to improve collaboration should be identified by the relevant organisations. Share the Vision has a key role to play in supporting the development of partnerships, through its communication of good practice and support for initiatives.
45
Conclusions and recommendations
5. Service evaluation Most authorities were formally evaluating their services, but a sizeable minority were not, and of those who were evaluating VIP services some were doing so only as part of a more general evaluation process. Only 26 authorities said that they were using the STV/LA Guidelines to inform their evaluation. While user surveys were not being used by the majority of authorities as part of the evaluation, users were being consulted on selecting materials, designing premises, equipment purchase, staff training, policy formation and the establishment of external links. There was a lack of rigour in contacting users to support evaluation, as only 46 authorities were able to supply data on the numbers of visually impaired people in the resident population or in library membership.
1997-8, and in four years the average numbers of materials have increased in each category. This is encouraging, but the lack of policy to inform selection strategy is of concern. User needs were the most important policy considerations taken into account when selecting materials, but too few authorities were providing written policy statements on materials selection. Half of the authorities did not notify regional library bureaux of their holdings. The percentage of authorities providing large print and spoken word materials in minority languages was lower than in 1997, which was concerning. There was less emphasis on non-fiction and information/reference materials in alternative formats than on fiction. Recommendation 6.1
There was need for authorities to be contacting their users and non-users more effectively in order to support service delivery and to augment existing service evaluation techniques. Recommendation 5.1
To DCMS and public library authorities
A materials selection policy, with targets, should form part of the Annual Library Plan and should include provision for adequate materials to meet the non-fiction, information and minority language needs of the user population.
To DCMS and public library authorities
The STV/LA Guidelines should form the basis of evaluation for visually impaired services. Recommendation 5.2 To public library authorities
Users and non-users of visually impaired services should be contacted (ensuring compliance with Data Protection regulations), and their library needs identified. They should be targeted for user satisfaction surveys. 6. Materials provision It was likely that the number of authorities identifying acquisitions across the range of materials was under-reported, compared with the CIPFA Actuals. Data on talking books have been collected by CIPFA since 1995-6 and on large print materials since
46
Recommendation 6.2 To CIPFA and public library authorities
The categories of alternative format materials per 1,000 population should take account of large print and talking newspapers. 7. Equipment While it was difficult to assess the level of equipment for the user population, as there were no data on the numbers of visually impaired people in the populations being served, it was clear that most authorities had insufficient equipment available for their use. Even central or main libraries had relatively little specialist reading equipment (despite an improvement since the 1997 survey). For rural visually impaired users the situation was particularly poor; smaller branch libraries and mobile libraries had
Public library services for visually impaired people
Conclusions and recommendations
minimal access to equipment. Technology has now made it easier than ever for visually impaired people to access information through the Internet, and it is essential that public libraries offer state-of-the-art technology to ensure equality of information provision for all the community.
Concessions are made to visually impaired users and details of charges and these concessions are published annually. It was noted that many services were not concessionary, although the situation had improved slightly since 1997. Recommendation 8.1
Recommendation 7.1
To public library authorities
To DCMS, CIPFA and public library authorities
An audit of access for visually impaired users should be undertaken, to identify specific shortcomings. User and non-user surveys would inform this audit and enable library authorities to ascertain actions required to meet the requirements of the Disability Discrimination Act.
The STV/LA National Guidelines should form the basis of strategy on equipment provision and access to IT for visually impaired people. Targets should form part of the Annual Library Plan and statistics per 1,000 population served should be a required statistic, to reflect the increased importance of equipment for reading support and IT as the means to enabling information access. 8. Provision of library services There was difficulty in assessing how effectively visually impaired users were able to use general public library services. A user survey would provide such data. However, it was evident that there was a patchy response to the special needs of visually impaired users in accessing the service: signing and guiding and library procedures were particularly noted, but there were many other areas also requiring attention.
Public library services for visually impaired people
9. Promotion Personal contact, house-bound services and mobile library services were the most common means of promoting services to visually impaired people. There is a need to identify the effectiveness of each method and to ensure that promotion is an important element in the overall marketing strategy of the library authority. Recommendation 9.1 To public library authorities
A promotional strategy for visually impaired users should form part of the authority’s marketing strategy.
47
References
References Basu, S. (1991) Public library services to visually disabled children. Jefferson: McFarland. Bell, L. (1980) The large print book and its user. London: Library Association. Blowers, S. (1994) Suffolk’s Years Ahead Clubs: Building bridges with the voluntary sector to provide library clubs in homes for elderly people. In: F. Hogg (ed.) Looking ahead: a practical look at new developments in library and information services for visually impaired persons, VIP. Papers presented at the Second International Conference on Library Services to Visually Impaired Persons, held at the University of Nottingham, Sutton Bonington Campus, 15-18 July 1994, pp 15-22. Leicester, UK: Ulverscroft Large Print Books Ltd. Book Marketing Ltd. (1998) Household library use survey. British Library Research and Innovation Report 144. London: Book Marketing Ltd. [The Bookseller] RNIB guidelines for publishers (1999) 12th November. Brazier, H. and S. Jennings (1999) How not to make a meal of it. Library Technology, 4 (1) 10-11. Brindle, D. (1999) Blind people ‘stuck at home’. The Guardian 24 May, 12. Brophy, P. and J. Craven (1999a) The integrated accessible library: A model of service development for the 21st century. British Library Research and Innovation Report 168. Manchester: Centre for Research in Library and Information Management. Brophy, P. and J. Craven (1999b) Education for all? Library Technology, 4 (1), 19-20. Bruce, I.; A. McKennell and E. Walker (1991) Blind and partially sighted adults in Britain: The RNIB survey. London: HMSO. Calibre: Recorded Books for the Blind (1999) (URL: http://www.luna.co.uk/~npharris/calibre1.html). Campbell, J. and M. Oliver (1996) Disability politics: understanding our past, changing our future. London: Routledge. Chartres, S. (1997) Leisure reading needs of visually impaired people: Local authority library services survey. London: RNIB. Chartres, S. (1998) The leisure reading habits of visually impaired using audio reading services: Customer survey April 1998. RNIB unpublished report. Chartres, S. (1999) RNIB Talking Book Service: The current situation. RNIB unpublished report. CIPFA (Chartered Institute of Public Finance and Accountancy) (1999) Public Library Statistics 1998-99 Actuals. London: CIPFA. Clarke, J. (1988) Users with special needs. In D. Bromley and A. Allott (eds.) British librarianship and information work pp 168-185. London: Library Association Publishing Ltd.
48
Public library services for visually impaired people
References
Craddock, P. (1985) The public library and blind people. London: The British Library. Craddock, P. (1996) Project Libra: the provision and use of reading aids for visually impaired and other print handicapped people in UK public libraries. Library and Information Research Report 91. London: The British Library. Craddock, P. and J. Harvey (1996) Visionary initiatives, Library Association Record, 96 (12) 673. Creaser, C. (1999) A survey of library services to schools and children in the UK, Loughborough: LISU. Department for Culture Media and Sport (2000) (URL: http://www.culture.gov.uk/) Doyle, B. (1996) Disability discrimination: The new law. Bristol: Jordan. EXLIB Deliverables (1993/1994) (URL: http://www.svb.nl/project/exlib/exlib_del.htm). Fish, G. (1994) Edinburgh’s Library Link Service: Building bridges with local transpot services to enable people with impairment mobility to visit the library. In: F. Hogg (ed.) Looking ahead: a practical look at new developments in library and information services for visually impaired persons, VIP. Papers presented at the Second International Conference on Library Services to Visually Impaired Persons, held at the University of Nottingham, Sutton Bonington Campus, 15-18 July 1994, pp 4-9. Leicester, UK: Ulverscroft Large Print Books Ltd. Fitzpatrick, V. (1990) The sole source; the Library of Congress National Library Service for the Blind and Physically Handicapped. Health Libraries Review, 7 (2) 73-85. Gallimore, A. (1999) When special becomes everyday. Library Technology, 4 (1) 13 & 16. Godber, J. (1999) How open is your OPAC? Library Technology, 4 (1) 12. Gooding, C. (1996) Disability Discrimination Act, 1995. London: Blackstone Press Ltd. Hagle, A. (1982) Information access by blind and physically handicapped persons. Advances in Librarianship, 12 247-275. Heap, B. (1994) Bradford’s Access to Print Service: Building bridges in the community to provide VIP with information. In: F. Hogg (ed.) Looking ahead: a practical look at new developments in library and information services for visually impaired persons, VIP. Papers presented at the Second International Conference on Library Services to Visually Impaired Persons, held at the University of Nottingham, Sutton Bonington Campus, 15-18 July 1994, pp 10-14. Leicester, UK: Ulverscroft Large Print Books Ltd. Henry, M. (1984) Services for the visually handicapped in Manchester City Libraries. Audiovisual Librarian, 10 (4) 195-199. Hopkins, L. (1997) Partners in care: share the vision. Public Library Journal, 12 (3) 57-60.
Public library services for visually impaired people
49
References
Hoy, S. (1992) Users with special needs. In D. Bromley and A.. Allott (eds.) British Librarianship and Information Work 1986-1990. Volume 1. General Libraries and the Profession. pp 145-59. London: Library Association Publishing. Inman, Kendra (1999) Educating the teachers. The Guardian 12 May, 24. Links for seamless service (1999) The Library Association Record, 101 (12) 682. Long, C. A. (1993) Making information available to partially sighted and blind clients. Electronic Library, 11 (6) 373-84. Machell, J. (1996) Library and Information Services for Visually Impaired People: National Guidelines. London: LA Publishing. Martin, J. (1999) Loan periods and charges 1999-2000. Ardrossan: North Ayrshire Council. Massis, B. (ed.) (1996) Serving print disabled library patrons: a textbook for facilitators of library service to people with visual or physical impairments. Jefferson, N.C.: McFarland. Needham,W. (1983) Improving library service to physically disabled persons: a self-evaluation checklist. Littleton, Colo.: Libraries Unlimited. Norman, S. (1999) Copyright in voluntary sector libraries (3rd edition). London: Library Association Publishing. Our better vision (1999) STV News, 30 12. Ormes, S. and I. Peacock (1999) Virtually accessible to all? Library Technology, 4 (1) 17-18. Owen, D. (1999) Update on Share the Vision. STV News, 29 4-6. Pinion, C. (1990) Audio services for the blind and partially sighted in public libraries. Audiovisual Librarian, 16 (1) 24-28. Pope, T. and C. Bourne (1999) Night Site: what’s on…in the evening economy for people who are elderly or disabled. London: CTRU & JMU. Also available at URL: http://www.rnib.org.uk/jmu/eveningfull.htm. Porter, P. (1997) The reading washing machine. Vine, 106 34-37. RNIB - Library and information services for people with impaired vision: a select list (1998a) (URL: http://www.rnib.org.uk/wesupply/fctsheet/libvi.htm). RNIB - UK Statistics (1998b) (URL: http://www.rnib.org.uk/wesupply/fctsheet/statistics.htm). RNIB - Terminology (1998c) (URL: http://www.rnib.org.uk/wesupply/fctsheet/term.htm).
50
Public library services for visually impaired people
References
RNIB - About the Pilot Internet Project (1999a) (URL: http://www.rnib.org.uk/technology/about.htm). RNIB (1999b) Hit back against copyright. Library Association Record 101 (9) 501. RNIB - How RNIB can help (1999c) (URL: http://www.rnib.org.uk/services/welcome.htm). RNIB - News: Get the Message (28 September) (1999d) (URL: http://www.rnib.org.uk/whatsnew/pressure1/gtm exec.htm) RNIB - Project areas (1999e) (URL: http://www.rnib.org.uk/wedo.research/welcome.htm). Robertson, Sue (1999) Fines and charges in public libraries in England and Wales (12th edition). Sheffield: SINTO. Spiller, D. (Ed.) (1998) Public Library Plans: Proceedings of a seminar held at Loughborough University 17-18 March 1998, Loughborough: LISU. STV (Share the Vision) (1999) Share the Vision’s Proposals for the investment of the £200,000 allocated to LIC for the improvement of library services for blind and visually impaired people. Unpublished document by David Owen. TNAUK - The Talking Newspaper Association of the UK(1999a) (URL: http://www.tnauk.org.uk). TNAUK - Spreading the net with SIGHTLINE (1999b) (URL: http://www.tnauk.org.uk/frames.htm). Tucker, R. N. (1997) TESTLAB - testing electronic systems using Telematics for Library Access for the Blind: a project under the Tap Libraries Programme. Vine, (106) 29-33. Vitzansky, W. (1991) Libraries for the blind in Nordic countries. Scandinavian Public Library Quarterly 24 (1) 12-17. Vitzansky, W. (1994a) Managing a national library service for blind and print handicapped persons. Library Management, 15 (7) 23-8. Vitzansky, W. (1994b) Library services to blind and print handicapped persons in Denmark: The Danish Model. In: F. Hogg (ed.) Looking ahead: a practical look at new developments in library and information services for visually impaired persons, VIP. Papers presented at the Second International Conference on Library Services to Visually Impaired Persons, held at the University of Nottingham, Sutton Bonington Campus, 15-18 July 1994, pp 24-38. Leicester, UK: Ulverscroft Large Print Books Ltd. Walters, S. (1999) Taking everybody under the wing. Library Technology, 4 (1) 15-16. Williams, S (1996) Library services to the blind in the United Kingdom and Ireland: A comparative study five years on. Journal of Librarianship and Information Science, 28 (3) 133-140.
Public library services for visually impaired people
51