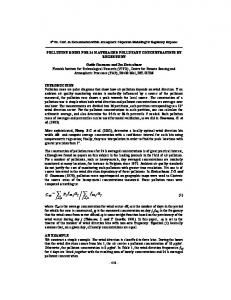
Figure 2 shows the outputs of the network during a 10-minute period from a patient with Cheyne-Stokes respiration (CSR). Note how the probabilities wax and ...
THE USE OF NEURAL NETWORKS IN EEG ANALYSIS Stephen J. Robertsy , Milo�s Krkicy , Iead Rezeky , James Pardeyz , Lionel Tarassenkoz, John Stradling�, Chris Jordan�� 1 Introduction { The Problematic EEG Most `real-world' classi cation and processing problems start with a data set about which we may have incomplete information. This is especially the case in the eld of medical signal and image processing, where the usual uncertainties in our knowledge are compounded by (often) a poor understanding of the physical mechanisms by which the data is generated and (often) subjective evaluation of the data by a human observer. In the case of the EEG, the e�ects of scalp, uid and bone on the tiny electrical currents generated in the cortex may be modelled only poorly and the large size of scalp electrodes and the e�ects of muscle and instrument noise all contribute to the complexity of EEG analysis. The belief that the EEG contains some objective information regarding brain `state' is tantalising. To some extent, though, such optimism is unfounded as many of the inherent problems may never be solved for EEG alone.2 We will not discuss in detail in this paper the problems of noise and artefact removal, nor the problems of modelling the passage of the EEG from cortex to scalp, but instead will concentrate on the EEG as is and suggest that, even if such problems are not solved, the EEG contains signi cant objective information regarding cortical functioning. Why `Neural' Networks? Arti cial `neural' networks (ANNs) have become very popular for data analysis over the past decade. There are good reasons for this popularity, but there are also good reasons for not using them : ANNs o�er no `magic' solution to problems and the internal `workings' are often obscure to the user. As such, then, they would appear to be, at best, an unreliable tool and, at worst, downright misleading. It is well known, however, that the minimum risk classi er ascribes an unknown input to the class with the highest Bayes' a posteriori probability. Bayes' theorem, a belief update theorem, links a prior belief (the a priori probability) to the a posteriori belief given a new piece of information. In classi cation terms, for example, if P (Ck ) represents the a priori belief in classi cation as class Ck and a new data sample, x, is observed (so new information is obtained) then the a posteriori belief in Ck given x is : p(x j Ck )P (Ck ) (1) P (Ck j x) = p(x) where p(x j Ck ) is a class-conditional probability density function (PDF), commonly known as the likelihood and p(x) is a class-unconditional PDF, commonly known as the evidence. `Traditional' classi cation techniques rely upon a variety of methods for estimating the likelihood functions for each class. As the class priors are equal (for a balanced data set, with equal `cost' associated with each outcome) and the evidence is constant over all classes, so a posteriori class beliefs may be ranked. The determination of the likelihood functions, however, is a di�cult task, and becomes exponentially di�cult for nite data sets as the dimensionality of the data (x) increases. Feedforward `neural' network classi ers have, it may be argued, become so popular because they can estimate a posteriori probabilities directly by forming a mapping function from the data space to a probability space.3 One of the key requirements of any statistical system is to assess its own con dence in a decision. In the eld of medical diagnostics this requirement is paramount. Part of the problem for any Bayesian classi er is the fact that the posteriors, be de nition, sum to unity. This means that a classi cation is made into one of a closed set of classes. If `rogue' data appears then, even if it fails to conform to the statistics of `genuine' data, it will be classi ed with apparent con dence into one of the output classes. We should, therefore, (in common with good statistical practice) incorporate a further output class, R for `rogue' data. By monitoring 1 ? P (R j x) we may monitor the con dence in any classi cation decision [8]. It is possible to further extend the sophistication of error and con dence estimates for ANNs by incorporation of more complex training and inference (using a full Bayesian methodology, for example) [2]. 1 y - Department of Electrical Engineering, Imperial College, University of London. z - Department of Engineering Science, University of Oxford. � - Osler Chest Unit, Churchill Hospital, Oxford. �� - Dept. An�sthetics, Northwick Park Hospital, Harrow 2 They may require investigation with MEG, PET and functional MRI, for example, to interpret the EEG. 3 We must, however, be careful in the choice of error function and learning algorithm to make sure that posteriors are indeed estimated as the network outputs.
Sleep Analysis System Our previous publications [6, 7] have detailed a `neural' network based sleep analysis system. This system, in its basic form, does not attempt to reproduce the Rechtscha�en & Kales (R & K) sleep scoring format of 6 or 7 discrete stages [5]. Indeed, the fact that human labelling is notoriously poor during some of these stages [3], some stages are under-represented in the data (e.g. stage 1) and scoring is on a poor temporal resolution, make such a reproduction self-defeating. Through investigation of the dynamics of stable patterns in the EEG (see [6]) we proposed that the sleep EEG, as observed, is governed by only three basic processes. Process S , corresponding to a drive to slow-wave sleep (SWS or deep sleep), process R (REM or dreaming sleep) and process W (wakefulness). We found that an excellent representation of any sleep EEG state may be regarded as some mixture of these three basic processes or states. Our classi cation problem is now signi cantly reduced in complexity, from the seven discrete stages of R & K to only three. Furthermore, as we regard, for example, stage 2 sleep as a transition between states R and S we do not wish to `hard' classify a section of EEG to one of the three states, but to estimate the `mixing' fractions of the three states. These `mixing' fractions are the a posteriori beliefs in each process given a section of EEG, and these may be estimated using an appropriately trained feedforward network.4 In much of our work, each one-second segment of EEG is parameterised using a 10th -order autoregressive (AR) model.5 Due to the small time resolution we may observe subtle changes in these probabilities during, for example, sleep apn�a. Figure 1 shows the outputs of the network for an 8-hour EEG record of a normal subject. Note the clear REM/non-REM sleep cycle and the abrupt arousals. -
1eeg
-
p(W) respiration
01-
1w 01-
p(R)
r
01-
01s 01-
p(S)
c
00:00:00
1:00:00
2:00:00
3:00:00
4:00:00
Figure 1
5:00:00
6:00:00
7:00:00
hours
0.95 00:00:00
00:02:00
00:04:00
00:06:00
00:08:00
00:10:00
Figure 2
Figure 2 shows the outputs of the network during a 10-minute period from a patient with Cheyne-Stokes respiration (CSR). Note how the probabilities wax and wane with the changes in the respiratory cycle. The bottom trace is a network `con dence' estimate. Current Work We are currently extending the above methodology to look at several other EEG-related analysis problems, namely determination of depth of an�sthesia and determination of an EEG-based `state of vigilance'. The determination of an�sthetic depth is complicated by two factors. Firstly the e�ect on the EEG's frequency spectrum by an an�sthetic agent changes from individual to individual and, secondly, such changes di�er from agent to agent. Frequency-based methods (such as AR modelling), therefore, cannot be guaranteed to be robust. We have chosen, instead, to investigate measures of signal complexity.6 The parameters we are investigating are based upon spectral entropy and measures of the dynamics of signal components. Figure 3 shows these measures applied to 5 minutes of data from the CSR patient. Note that these measures, without further analysis, give an excellent description of the waxing and waning of the cortical arousals. 4 We have used both the multi-layer perceptron [MLP] and radial-basis function [RBF] networks, the choice makes little di�erence if the network is properly trained. We note, furthermore, that stages wake, REM and SWS are well labelled by human experts, so we expect our database to contain fewer mislabellings. 5 Evaluated using Burg's maximum-entropy method [1]. 6 We do not explicitly make use of the `dimensionality' measures from `chaos' theoretic approaches, as they are notoriously unreliable when applied to noisy non-stationary signals, such as the EEG.
EEG
1 0.9 0.8 0.7 P(low anaesthesia)
Respiration
0.6 0.5 0.4
EEG −< primary dynamic complexity
0.3 0.2 0.1 EEG − spectral entropy function
Figure 3
0
1000
2000
3000 4000 time index
5000
6000
7000
Figure 4
As a nal result (Figure 4), we show a probabilistic an�sthetic depth measure over 5 graded levels of an�sthetic agent (1 represents low dose, and 0 high dose) [4]. Six complexity measures were used to train a feedforward network on the lowest and highest dose levels only.7 We see that all 5 levels are clearly shown by the network. We note that the rst, second and fth levels (twice as long as the others) consists of equal amounts of data from two di�erent an�sthetic agents (des urane & propofol), and there is no signi cant difference in network response between them.8 The network probabilities are post-processed using an adaptive lter [9] such that stochastic components are removed. Conclusions There is little doubt that, if appropriately used, arti cial `neural' networks o�er a robust method for estimation, prediction and classi cation. Their application to EEG analysis is well-founded. Care must, however, be taken in the choice of pre- and post-processors. Although the use of ANNs does not o�er a solution to some of the problems encountered in EEG analysis, we would argue that used as methods for providing a continuous measure of a system's state, in a probabilistic framework, they provide information which is lost in more traditional analysis methods. References [1] N. Andersen. Comments on the Performance of Maximum Entropy Algorithms. IEEE Proceedings, 66(11):1581{ 1582, 1978. [2] C.M. Bishop. Neural Networks for Pattern Recognition. Oxford University Press, Oxford, 1995. [3] Kelley, J.T. and Reed, K. and Reilly, E.L. and Overall, J.E. Reliability of Rapid Clinical Staging of All Night Sleep EEG. Clin. Electroenceph., 16(1):16{20, 1985. [4] M. Krikic. Assessment of An�sthetic Depth using Neural Networks. Master's thesis, Imperial College, University of London, 1995. [5] A. Rechtscha�en and A. Kales. A manual of standardized terminology, techniques and scoring system for sleep stages of human subjects. Technical report, UCLA, Los Angeles, USA, 1968. [6] S. Roberts and L. Tarassenko. New Method of Automated Sleep Quanti cation. Med. & Biol. Eng. & Comput., 30(5):509{517, 1992a. [7] S. Roberts and L. Tarassenko. The Analysis of the Sleep EEG using a Multi-layer Network with Spatial Organisation. IEE Proceedings-F, 139(6):420{425, 1992b. [8] S. Roberts, L. Tarassenko, J. Pardey, and D. Siegwart. A Validation Index for Arti cial Neural Networks. Proceedings of International Conference on Neural Networks & Expert Systems in Medicine & Healthcare, Plymouth, August 1994, pages 23{30, 1994. [9] D. Siegwart, L. Tarassenko, S. Roberts, J. Stradling, and J. Partlett. Sleep Apnoea Analysis from Neural Network Post-Processing. In Proceedings of : Fourth IEE International Conference on Arti cial Neural Networks, pages 427{432. IEE, June 1995.
7 If all 5 levels are used for training, the overlap and mis-labelling present in the intermediate levels makes the network's performance considerably poorer. 8 The third and fourth levels are taken using propofol only.