Proc. Nati. Acad. Sci. USA
Vol. 93, pp. 8710-8715, August 1996 Neurobiology
Long-term potentiation at single fiber inputs to hippocampal CAl pyramidal cells (synaptic plasticity/glutamate receptors/learning)
JOHN T. R. IsAAc*, GREGORY 0. HJELMSTADt, ROGER A. NIcOLLA§,
AND
ROBERT C. MALENKA*4i
Departments of *Psychiatry, WPhysiology, and §Cellular and Molecular Pharmacology, and tProgram in Neuroscience, University of California, San Francisco, CA 94143
Contributed by Roger A. Nicoll, May 22, 1996
multiple fibers were never inadvertently activated. Because several other lines of evidence suggest that LTP is associated with postsynaptic changes (12-15), we have reinvestigated the quantal changes that occur during LTP when every effort is made to activate only a single fiber and, presumably, a single synapse. In contrast to some recent results (7, 8), we find that when LTP is examined with single fiber stimulation, it is routinely associated with a significant increase in q and cannot be explained by an increase in Pr alone.
Despite extensive investigation, it remains ABSTRACT unclear whether presynaptic and/or postsynaptic modifications are primarily responsible for the expression of long-term potentiation (LTP) in the CAl region of the hippocampus. Here we address this issue by using techniques that maximize the likelihood of stimulating a single axon and thereby presumably a single synapse before and after the induction of LTP. Several basic properties of synaptic transmission were examined including the probability of neurotransmitter release (Pr), the quantal size (q), and the so-called potency, which is defined as the average size of the synaptic response when release of transmitter does occur. LTP was routinely associated with an increase in potency, whereas increases in Pr alone were not observed. LTP was also reliably induced when baseline Pr was high, indicating that synapses with high Pr can express LTP. These results suggest that the mechanism for the expression of LTP involves an increase in q and is difficult to explain by an increase in Pr alone.
METHODS Transverse hippocampal slices (400 ,um) were prepared from 12-to 18-day-old Sprague-Dawley rats and whole-cell voltage clamp recordings from CAl pyramidal cells were made at room temperature in a submersion-type recording chamber as previously described (10). The standard external solution contained 119 mM NaCl, 2.5 mM KC1, 2.5 mM CaCl2, 1.3 mM MgSO4, 1.0 mM NaH2PO4, 26.2 mM NaHCO3, 11 mM glucose, and 0.1 mM picrotoxin (pH 7.4). The composition of the whole-cell solution was 107.5 mM cesium gluconate, 20 mM Hepes, 0.2 mM EGTA, 5 mM QX-314-bromide, 8 mM NaCl, 10 mM tetraethylammonium chloride, 4 mM MgATP, and 0.3 mM GTP (pH 7.2). For perforated patch-clamp recordings using amphotericin-B (16), the pipette solution was 117.5 mM cesium gluconate, 20 mM Hepes, 0.2 mM EGTA, 0.48 mg/ml amphotericin-B (pH 7.2). The amphotericin-B solution was prepared as described (16) and was made every 2-3 hr during the experiments. For both whole-cell and perforated patchclamp recordings, only cells with initial seal resistances greater than 10 GQl were used. Cells were held at -60 mV unless otherwise stated, and series resistance was monitored continuously during recordings as described (10). For perforated patch-clamp recordings, data collection commenced only when the series resistance had stabilized, typically 20-40 min after seal formation. The mean series resistance values were: whole-cell, 13.2 + 2.6 MfQ, n = 8; perforated patch-clamp, 33.0 ± 2.0 Mfl, n = 13. Excitatory postsynaptic currents (EPSCs) were evoked at 0.67 Hz (whole cell) or 0.33-0.5 Hz (perforated patch) using a patch electrode filled with external solution as a stimulating electrode. It was placed in stratum radiatum as far away as possible (1-3 mm) from the recording site. During perforated patch-clamp recording experiments, it was often necessary to change stimulation position while recording to find a response that met criteria for a single fiber response (success rate was 13 of 24 stimulus positions tested). Once afferent stimulation was commenced, it was maintained at the same frequency without interruption for the entire experiment. LTP was induced by depolarizing the cell to -10
Long-term potentiation (LTP), an activity-dependent, longlasting increase in synaptic strength, has received considerable attention because of its potential role in learning and memory. However, confusion exists concerning whether the locus of expression of LTP in hippocampal CAl pyramidal cells is primarily presynaptic and/or postsynaptic (1). One approach that has been used by several laboratories involves the technique of minimal stimulation in the CAl region in which the stimulus is reduced so that only a single or a few fibers are activated. In most of these studies (2-8), LTP was associated with a decrease in the incidence of so-called failures, a result that is classically attributed to an increase in the probability of transmitter release (Pr). Evidence was also presented that an increase in quantal size (q) accompanied LTP (3-6,9), a result that, in contrast, is consistent with a postsynaptic modification. Recently, an alternative explanation has been offered for the change in failures associated with LTP (10, 11): silent synapses that lack functional a-amino-3-hydroxy-5-methyl-4-isoxazolepropionic acid (AMPA) receptors may exist and be converted to functional synapses after the induction of LTP. Such a scenario provides a postsynaptic mechanism that can explain almost all of the electrophysiological changes observed during LTP. However, results from two recent reports, based primarily on minimal stimulation in either the CAl region (7) or in the CA3 pyramidal cell layer (8), appear to be incompatible with a significant postsynaptic contribution to LTP because no change in q was observed; instead, it was proposed that LTP must be due solely to a robust increase in Pr. One possible explanation for the discrepancy between the results obtained with minimal stimulation is that in those studies suggesting a change in q, more than one fiber was stimulated, whereas in the studies reporting only changes in Pr,
Abbreviations: LTP, long-term potentiation; EPSC, excitatory postsynaptic current; Pr, probability of transmitter release; q, quantal size. 1To whom reprint requests should be addressed at: Department of Psychiatry, LPPI, Box 0984, University of California, San Francisco,
The publication costs of this article were defrayed in part by page charge payment. This article must therefore be hereby marked "advertisement" in accordance with 18 U.S.C. §1734 solely to indicate this fact.
CA 94143. e-mail:
[email protected].
8710
mV (whole cell) or + 10 mV (perforated patch) for 100 consecutive stimuli. Data were collected and analyzed as described (10). Failure rates were estimated using the methods of Liao et al. (11). Briefly, the number of responses with an amplitude > 0 pA were determined, and this value was then doubled to produce the failure rate. At the end of the majority of experiments (18 of 21 cells), 6-cyano-7-nitroquinoxaline-2,3-dione (CNQX) (10 ,tM) was applied and the contribution of the stimulus artifact to evoked EPSCs was subtracted. The magnitude of LTP was calculated by averaging all of the responses (successes and failures; 400-1000 total) beginning 5 min after the LTP induction protocol and comparing this to the average of all the responses collected during the baseline period (150-200 events). Potency (7) was defined as the mean amplitude of the EPSC (calculated by averaging all trials together) divided by the success rate (i.e., 1 minus the failure rate). If only a single synapse is being activated, potency will be the same as q. For all data analysis and data presentation in the figures, the events collected for the 5 min after the pairing protocol were not used. For calculation of the paired pulse potency and for failure rates during single axon tests, both visual classification of failures (7) and the method described above (11) were used. In the cells in which paired pulse data was collected, an epoch of 100 paired pulse stimuli (interpulse interval, 40-70 msec) was delivered either immediately before or during the baseline period and was then discontinued. In two of these cells, another epoch of 100 paired pulse sweeps was also collected following pairing. Data are expressed as mean ± SEM. Simple binomial and Poisson distributions were used to model the data.
Pairing
A
:-.%.2
.,.d e-,
-
;Z -5
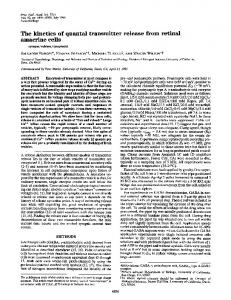
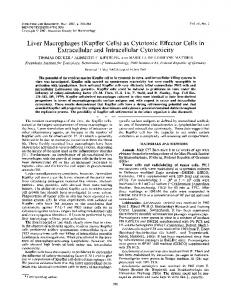
Properties of LTP Monitored with Minimal Stimulation and Whole-Cell Recording. We first investigated the properties of LTP with putative single fiber activation using standard whole-cell recording and minimal stimulation. By reducing the stimulation intensity until no response was detected on -50% of the trials, we assumed that we were predominantly recording EPSCs from one fiber and perhaps even a single release site as previously reported (7, 17, 18). In the example shown in Fig. 1, the initial failure rate was 0.73 and the calculated potency was 4.3 pA. LTP was induced (Fig. 1A, Pairing) by holding the cell at -10 mV for 100 stimuli while stimulation was maintained at baseline frequency. This method avoids any frequency-dependent changes in axon excitability or stimulation electrode properties. As shown in Fig. 1 B1 and B2, robust LTP was elicited (312%) that was accompanied by a marked increase in potency (to 8.4 pA, 195% of baseline, Fig. 1B3) and a modest decrease in the failure rate (to 0.58; 79% of baseline failure rate). Fig. 1C shows amplitude histograms of the events recorded before (thin line) and after (thick line) LTP induction. The most salient feature of this graph is that the small events (-2-5 pA) that make up the majority of the successes during the baseline period have largely disappeared and have shifted to larger amplitudes (-7-25 pA). This shift in the amplitude distribution, which signifies an increase in potency (Fig. 1B3), is consistent with an increase in q during LTP. [The "peakiness" in the distribution of the small events seen in this and subsequent histograms is most likely a sampling artifact due to the relatively small number of events in each bin rather than reflecting quantal peaks due to stimulation of multiple synapses (19-21)]. Even if we assume that a large number of release sites were activated during the baseline, for an increase in Pr to account for the observed shift in the amplitude distribution, the failure rate would have had to decrease to less than 0.1 during LTP rather than the observed rate of 0.58. Similar results were observed in a total of eight cells in which LTP (258 ± 30%) was evoked. LTP was accompanied by a signficant increase in potency in all cells (194 ± 22%) and a
:*'
_S
.
-
. AN
M_m
. ......
-V. 4i w-
_ . ._
.
Lr-
14 V-.
.
pnjj."
-
a -10
-
E -15
-
z
uz-20
-
-25
-
EL
-30 ,Q %
8
4
1
pAL 25 msec
12
16
PAI
20 Time (min)
| 1
32
28
24
pAI
C-
a
cr_
a
18
-
16
-
-
BaSaline LTP
1.5
0
Er 1.0i Uc
0
0.50
a)
IL
1
2
D2 o30
0~~~~~
4-
11 2.5
3
4
o/
-
2.0 -~
~1.5-
2-
~
El 1 .0
0.5
0
-30
RESULTS
8711
Proc. Natl. Acad. Sci. USA 93 (1996)
Neurobiology: Isaac et al.
-25
-20 -15 -10 -5 Amplitude (pA)
0
0
1
2
3
4
LTP
FIG. 1. LTP monitored with whole-cell recording and minimal stimulation is associated with an increase in potency. (A) Individual response amplitudes during the course of an experiment (A-C from one experiment). Time 0 (not shown) is the time at which the whole-cell recording configuration was established. (B) Traces from the experiment in A. (B1 Left) Average of responses (n = 100) during baseline. (Bi Right) Nine superimposed consecutive responses from the baseline. (B2 Left) Average of responses (n = 100) during LTP (10 min after pairing). (B2 Right) Nine superimposed consecutive responses during LTP. (B3) Superimposed averages of successes during baseline (smaller trace) and LTP (larger trace; same epochs as used for averages inBI andB2). (C) Amplitude histograms (bin width = 0.5 pA) of all baseline data (thin line) and all data from 5 min after the end of pairing (thick line). (D) Summary data for eight whole-cell experiments (each coded with a symbol that is the same for both graphs). (Di) Success rate (SR) ratio (LTP/baseline) plotted as a function of LTP magnitude. Horizontal line represents the expected relationship for a change in q only, diagonal line for a change in Pr only at a single release site, and curved line for a change in Pr only for a Poission distribution. (D2) Potency ratio plotted as a function of LTP magnitude. Horizontal line is the expected relationship for a change in Pr only at a single site, upper diagonal line for a change in q only, and lower diagonal line for a change in Pr only for a Poisson distribution. The extent of the solid portion of the lower diagonal line represents the largest amount of LTP that can be generated using this model for the greatest experimentally observed change in failures. The shaded areas indicate the portions of the graph in which an increase in Pr alone could account for LTP.
modest reduction in failure rate in some cells (0.60 ± .04 during baseline, 0.47 ± .04 during LTP). Fig. 1D1 shows the ratio of success rates before and after LTP induction (SR Ratio) plotted as a function of the magnitude of LTP. The diagonal straight line represents the expected relationship for a change in Pr alone at a single release site, the curved line represents the expected relationship for a change in Pr alone for a Poisson distribution (a worst case scenario in which the assumption is that a large number of low Pr sites were being activated), and the horizontal line the expected relationship for a change in q alone. Fig. 1D2 shows the ratio of potencies
8712
Proc. Natl. Acad. Sci. USA 93 (1996)
Neurobiology: Isaac et al.
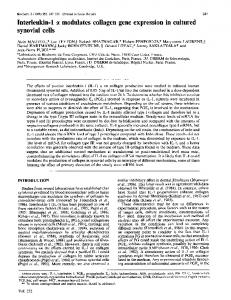
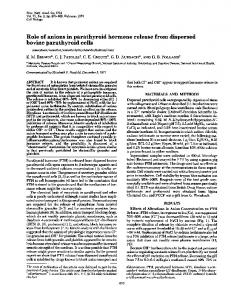
before and after LTP induction (Potency Ratio) plotted as a function of the magnitude of LTP. In this figure, the horizontal line represents the expected relationship for a change in Pr alone at a single release site, the upper diagonal line represents a change in q alone, and the lower diagonal line represents a change in Pr alone for a Poisson distribution. Whether or not single or multiple release sites were activated in each of these experiments, these data indicate that LTP was unlikely to have been generated by a change in Pr alone but instead must have involved changes in q and possibly n. Properties of LTP Monitored with Single Fiber Activation and Perforated Patch Recording. Since the whole-cell experiments produced results different from those previously reported using similar techniques (7, 8), we decided to take the additional steps of using stimulus intensity ramps (22) and paired pulse analysis (18) to maximize the likelihood of stimulating a single axon and most likely a single synapse (23) during the baseline period. With standard whole-cell recordings, the ability to induce LTP "washes out" within 10-15 min (2), and there was insufficient time to perform these single fiber/single synapse tests satisfactorily and still be able to induce LTP. We therefore used amphotericin-B perforated patch-clamp recording techniques (16) that allowed us to generate LTP more than an hour after the start of an experiment. Fig. 24 shows the data from the beginning of a typical experiment in which the stimulus intensity was increased in a stepwise manner by about 7% (0.02 V) every 25 stimuli. The EPSC amplitudes and failure rates show a threshold at a stimulation intensity of 0.30 V, and the next two successive increases in intensity did not produce any further increase in mean EPSC amplitude or a reduction in failure rate. This plateau in the response despite continued increases in stimulus intensity strongly implies that a single axon contacting the recorded cell was being activated reliably (22, 24). It is possible that with this technique, we are stimulating additional fibers that either do not contact the recorded cell or make synapses that are postsynaptically silent (10, 11). Similar single axon tests were performed in 16 cells using perforated patch recording. Because the interpretation of the data from these experiments is critically dependent on the reliable activation of a single axon contacting the recorded cell, every effort was taken to ensure that this occurred in all cells used for data analysis. To minimize any possible timedependent effects on axon excitability, the order in which the stimulus intensities were changed while performing the single axon test was varied between cells (see ref. 22): seven were performed in successive stimulus intensity increments, four in successive decrements, and five in random order. The middle of the three plateau stimulation intensities was selected for data collection. In three of the cells, the stimulating patch electrode was pressed onto the CA3 cell body layer as previously described (8). In addition, in a subset of cells (n = 8), paired pulse stimulation was used to address whether a single release site was being activated (18). The reasoning behind this approach is that paired pulse stimulation presumably only affects Pr; if two release sites are being activated, the potency of the responses to the second stimulus will be greater than the potency of the responses to the first stimulus because the increase in Pr on the second response will increase the likelihood that both sites will release simultaneously. This manipulation also permitted us to determine whether we were activating the fiber reliably. If a significant fraction of the observed failures was due to axon excitation failures, the potency of the second response would be smaller for trials in which the first response was a failure versus trials in which the first response was a success (18). By taking these precautions and performing these analyses, we have maximized the like-
lihood that only a single axon contacting the recorded cell is being stimulated reliably. Three of the 16 cells failed both the
0.4
A
~0.03 5~ 0
-
0.2
A3 0.26 V*4o...
0.32v
s
5
20 0
S
028
Vo
,
V
0.34V
20 406080 100 120
0.30 V
V2
mseL
225 rnsec
n2
b
StimulusINnibe
Pairing
0+ -5
-10 xX -1 E -20