Quantifying climate change impacts on streamflow ...
Recommend Documents
May 14, 2018 - the west side and Bhutan and Nepal on the southern side, with a mean ...... Annual mean values of basin-wide precipitation (ppt), temperature ...
Mar 20, 2017 - wet season from July (ISA I) through to October (ISA IV) before the heavy ... the study is shown in Figure 2 and involves: (i) the preparation of ...
Apr 4, 2014 - change on streamflow in four large representative African river basins: the Niger, the Upper Blue Nile, the Ouban- gui and the Limpopo. We set ...
Jul 10, 2018 - the planning and management of the west route of South-to-North Water Transfer Project (SNWTP). This paper presented an analysis of the ...
May 16, 2017 - 1 Department of Zoology, University of Otago, Dunedin, New Zealand ... originsâmay play equally important roles with regard to impacts on species ... climate change impacts emphasises the importance of managing regional.
This paper develops and applies methods to quantify and monetize projected impacts on terrestrial ecosystem carbon storage and areas burned by wildfires in ...
Smith & Lavender Environmental Consultants. R.R. # 7, Perth Ontario K7H 3C9 ... Don Hayley. EBA Engineering ... Sidney Smith Hall,. 100 St. George St., 5th ...
Jul 24, 2012 - Bain (Fig. 1), respectively. The boundaries of ...... Kirkby M, Bracken L, Reaney S (2002) The influence of land use, soils and topography on the ...
Jun 24, 2016 - Negrón Juárez, R.I.; Li, W.; Fu, R.; Fernandes, K.; de Oliveira Cardoso, ... Taylor, K.E.; Stouffer, R.J.; Meehl, G.A. An overview of CMIP5 and the ...
Dec 8, 2015 - ... and the mean base flow (Das et al., 2011; Maurer et al., 2009; Risley .... however the CRU dataset has shown comparable results to PRISM ...
High School teachers Scott Worland. (Long Trail) and ... USGS 04280450. Mettawee River near middle Granville. 13 ... Salmon River at south Plattsburgh. 17.
The Climate Council is an independent, crowd-funded organisation providing quality information on climate change to the
Sep 1, 2010 - Woodhouse3, Lindsey Gulden1, Kathy Jacobs4, Gerald North5, Ruby ... Change Technical Paper VI: Climate Change and Water (Bates et al.
In this example in north east Norfolk, and compared to the. 1970s baseline condition ... intrusion in a low-lying coastal area in eastern England. ASIA. In Mid and ...
Nov 28, 2013 - from CPR samples in the Irish Sea correlated significantly and positively with the catch rates from the plankton nets. (Lynam et al. 2011).
and ecoregions within the transboundary Kailash Sacred Landscape (KSL) of ... Twenty-eight strata, comprising seven bioclimatic zones, were aggregated to ...
... there will be impacts within the electricity industry. ... residential, commercial and municipal sectors. .... fully identify the changes in daily load profiles that will.
understated, the impacts of climate change on the sector and its implications for the .... environment and frequent occurrence of extreme events will have significant effects on the .... rise may alter the salinity of estuarine habitats, inundate wet
Adaptation of crops to the challenges of climate change will involve ... interactions between all the components of the arable environment which will require.
Driving the fire model with A1B climate change scenarios based on a set of Regional Cli- ... and future climate change on wildfires is a key topic in risk assessment and adaptation ... the number of fires display a decreasing trend (Turco et al. ...
weather events, such as heavy rain storms, flooding, fires, hurricanes, tropical storms and El .... Indian Ocean, in add
Nov 28, 2013 - Stonehaven monitoring site: C. finmarchicus is carried into the area in the spring as late stage copepodites. These produce one, sometimes two ...
Apr 28, 2011 - An international conference entitled Phenology 2010 was held in ...... time composites of VI data so that enough cloud-free imagery could ...... each of the gene regions, with haplotype diversity (Hd) ranging ...... Conference call.
Quantifying climate change impacts on streamflow ...
Grand river at Brantford: -PBIAS = 2% (very good). -NSE = 0.77 (good). -R2 = 0.88 (very good). Themes river at. Thamesville: -PBIAS = 1% (very good).
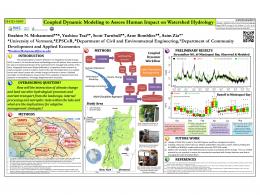
Quantifying climate change impacts on streamflow dynamics of Grand and Thames river basins, Canada Binbin Zhang, Narayan Kumar Shrestha, Prasad Daggupati, Ramesh Rudra, Rituraj Shukla, Baljeet Kaur, Jun Hou School of Engineering, University of Guelph, ON, Canada
The Great Lakes and the Grand and Thames river basins
The Northern Lake Erie (NLE) drains 21750 km2
The Grand river drains 6764 km2
The Thames drains 5883 km2
Agriculture is the dominant land use type (44% and 69%) respectively for the Grand and Thames river basin
Climate Change in Cold Climate Regions and in Great Lakes
The Great Lakes provides fresh water resources for consumption, transportation, tourism, power generation, among others The Lake Erie is home to approximately 14 million In the last few decades, serious blue-green algae blooms has been observed in the Lake Erie Growing evidences that climate change is a real In cold climate region: o o o o
o o o
Increases in winter temperature decreases in snowfall proportion on total precipitation changes in lake level changes in streamflow input to the lake changes in freeze-thaw frequencies increases in drought and flood frequency changes in ice cover, among others
The Grand and Thames river basins
Soil and Water Assessment Tool (SWAT) Precipitation and Temperature data: Gridded Climate Data for Canada (GCDC) Base period: 1980-1993 (1983-1988: Calibration, 1989-1993: Validation)
Streamflow at four stations used Bias correction tool: Climate Model data for Hydrologic modeling (CMhyd) Environment Canada (EC) station: Glen Allan is used for assessing performance of different bias correction methods
Different Bias Correction Methods and their Evaluation
Methods o
Linear Scaling of Precipitation and Temperature
o
Local Intensity Scaling (LOCI) of Precipitation
o
Power Transformation (PT) of Precipitation
o
Variance Scaling (VS) of Temperature
o
Distribution Mapping (DM) of Precipitation and Temperature
Evaluation o
Frequency based statistics
o
Time Series based statistics
o
Coefficient of Determination (R2)
o
Nash-Sutcliffe Efficiency (NSE)
o
Percentage of Bias (PBIAS)
The Climate Change Data
Canadian regional climate model (CanRCM4)
Resolution: 0.22°, equivalent to 25 km
The projections from the CanRCM4 are tailored made for applications in Canada
CanRCM4 is one of RCMs used in the Coordinated Regional Climate Downscaling Experiment (CORDEX) project implemented by the World Climate Research Programme (WCRP)
Two emission scenarios: the Representative Concentration Pathway RCP 4.5 and RCP 8.5
Two future periods: a mid-century (2043-2053) and an end-century (2083-2093)
SWAT Model Results for Streamflow during Base Period Simulated (Calibration)
Future Changes in Green Water Flow (Evapotranspiration: ET)
Future Changes in Green Water Storage (Soil Water: SW)
water stress conditions to growing crops
Future Changes in Streamflow Dynamics Historical
RCP4.5
RCP4.5
100
0
-50
120
-100
80
-150 -200
40
-250
0
Flow Discharge (m3/s)
50
160
-300
RCP4.5
100 50 0
-50
120
-100
80
-150 -200
40
-250
-300
RCP4.5
RCP8.5
200
200
160
100
0 120 -100
80 -200 40
-300
0
-400 Jan Feb Mar Apr May Jun Jul Aug Sep Oct Nov Dec
RCP8.5
Jan Feb Mar Apr May Jun Jul Aug Sep Oct Nov Dec
Flow Discharge (m3/s)
Historical
RCP4.5
0
Percentage Changes (%)
Flow Discharge (m3/s)
RCP8.5
Historical
160
Jan Feb Mar Apr May Jun Jul Aug Sep Oct Nov Dec
RCP4.5
RCP8.5
200
Percentage Changes (%)
Flow Discharge (m3/s)
200
RCP8.5
Percentage Changes (%)
RCP8.5
RCP8.5
Historical
RCP4.5
RCP8.5
200
200
160
100
0 120 -100
80 -200 40
-300
0
-400
Jan Feb Mar Apr May Jun Jul Aug Sep Oct Nov Dec
Percentage Changes (%)
RCP4.5
Uncertainty Future Changes in Streamflow Dynamics Grand river near Marsville
Thames river at Ingersoll
Grand river at Brantford
Thames river at Thamesville
Key Findings
We found the combination of distribution mapping (DM) methods for both precipitation and maximum temperature to be the best method
Results showed marked temporal and spatial variability on future changes in precipitation and temperature
Also reflected in evapotranspiration and soil water storage changes, leading to heterogeneity in streamflow changes at four considered stations
On average, increases in winter (+11%) and decreases in spring (-33%), summer (-23%) and autumn (-15%) streamflow were expected in future
Region-specific temporal variability in water resources availability, as expected in future in these river basins, pose considerable challenges to water planners and managers and to integrated water resources management of these two river basins