AQUATIC BIOLOGY Aquat Biol
Vol. 25: 53–60, 2016 doi: 10.3354/ab00657
Published August 10
OPEN ACCESS
Quantifying ontogenetic stable isotope variation between dermis and muscle tissue of two pelagic sharks Yunkai Li1, 2,*, Nigel E. Hussey3, Yuying Zhang2 1 College of Marine Sciences, Shanghai Ocean University, 999 Huchenghuan Rd., Shanghai 201306, PR China Marine Sciences Program, School of Environment, Arts and Society, Florida International University, 3000 NE 151st, North Miami, FL 33181, USA 3 Great Lakes Institute for Environmental Research, University of Windsor, 401 Sunset Avenue, ON N9B 3P4, Canada
2
ABSTRACT: Comparative analysis of isotope values from different tissues can capture temporal variation in the trophic and foraging behavior of difficult to study large marine predators, revealing either uniform or variable ecological roles over time. The isotopic values (δ13C and δ15N) of dermis, and muscle tissue of silky Carcharhinus falciformis and blue sharks Prionace glauca sampled in the northeast central Pacific were analyzed to quantify ontogenetic inter- and intra-tissue isotopic variation. Consistent differences in δ15N values occurred between dermis and muscle tissue for both species (2.5 ± 0.4 ‰ and 2.1 ± 0.3 ‰, respectively), while tissue differences in δ13C values were more variable between species (2.3 ± 0.6 ‰ and 0.7 ± 0.6 ‰, respectively), likely a result of tissue composition. The overall δ15N and δ13C values of dermis and muscle were highly correlated for blue sharks and for silky sharks with the exception of silky shark δ13C values. This pattern indicates that dermis isotope values are able to provide a proxy for muscle tissue, similar to that previously reported for fin, accepting dermis-specific diet−tissue discrimination factors. Tissue-specific ontogenetic isotopic variation for the silky shark, and the low regression slope value between dermis and muscle δ13C values, however, may suggest that dermis and muscle tissue have different isotopic turnover rates. These data demonstrate that dermis yields valuable isotope data to examine the trophic ecology and feeding/movement behavior of sharks, but further work is required to address dermis-specific turnover rates and diet−tissue discrimination factors. KEY WORDS: Pelagic shark · Stable isotope · Dermis
INTRODUCTION In recent years, our understanding of the temporal and spatial variation in trophic roles and foraging dynamics of shark species has improved based on the application of carbon and nitrogen stable isotopes (Matich et al. 2010, 2011, Hussey et al. 2011, Kim et al. 2012a). Compared to the instantaneous ‘snapshot’ of dietary information obtained from gut content analysis, stable isotope analysis (SIA) allows exami*Corresponding author:
[email protected]
nation of feeding behaviors integrated over numerous time periods (Martínez del Rio et al. 2009, Willis et al. 2013). For example, the isotopic composition of different metabolic tissues with diverse turnover rates can provide dietary information integrated over short (weeks, using plasma; Matich et al. 2011) to long (months to years, using muscle; MacNeil et al. 2005) periods. Consequently, inter-tissue stable isotope comparisons can examine dietary shifts and variation in trophic position of species (MacNeil et al. © The authors 2016. Open Access under Creative Commons by Attribution Licence. Use, distribution and reproduction are unrestricted. Authors and original publication must be credited. Publisher: Inter-Research · www.int-res.com
54
Aquat Biol 25: 53–60, 2016
2005, Malpica-Cruz et al. 2013), characterize the degree of dietary specialization at individual and population levels, and identify inter/intra-specific resource partitioning and niche overlap over time (Matich et al. 2010, 2011, Kinney et al. 2011). To date, the most common tissue analyzed for SIA in sharks is white muscle (Estrada et al. 2003, MacNeil et al. 2005), but other tissues include liver (Olin et al. 2011, Malpica-Cruz et al. 2013), blood (Matich et al. 2010, 2011, Malpica-Cruz et al. 2013), fin (Matich et al. 2010, 2011, Hussey et al. 2011), and vertebrae (Estrada et al. 2006, Kim et al. 2012b, Carlisle et al. 2015). Considering the threatened status of many shark species (Dulvy et al. 2014) and the requirement to limit mortalities, nondestructive or minimally invasive sampling methods are increasingly being adopted in field studies (Hammerschlag & Sulikowski 2011). Such tissue sampling from large sharks often includes blood (plasma and red blood cells), fin, and/ or a biopsy sample of skin, connective tissue, and muscle. Fin is considered an attractive tissue to sample, given the easy, quick, and minimally invasive sampling protocol (Matich et al. 2010, Hussey et al. 2011). Skin, or more specifically the dermal collagen fiber layers that underlie the dermal denticles of shark skin (hereafter referred to as dermis), potentially provides another tissue that is easy to sample, and is likely more homogeneous in terms of structural composition compared to fin (Matich et al. 2010, Hussey et al. 2011, Carlisle et al. 2012). To date, the isotopic composition of dermis has received limited attention (but see Carlisle et al. 2012, Jaime-Rivera et al. 2013) despite the above advantages. In this study, we analyzed the isotopic values (δ13C and δ15N) of dermis and muscle tissue sampled from silky Carcharhinus falciformis and blue sharks Prionace glauca, 2 pelagic species that are commonly caught in commercial fisheries. Both species are known to predominantly feed on cephalopods in pelagic waters, but silky sharks are considered to forage both in nearshore and pelagic habitats in contrast to the blue shark (Rabehagasoa et al. 2012, Galván-Magaña et al. 2013). Both species, however, undertake large-scale movement patterns between foraging locations (Bonfil 2008, Stevens et al. 2010). The objectives of this study were (1) to quantify intertissue isotopic differences and (2) to examine interand intra-tissue isotopic variation by age for both pelagic shark species. Overall, the aim was to determine if δ13C and δ15N values of dermis can provide valuable temporal insights into the trophic ecology and feeding behavior of these impacted pelagic species.
MATERIALS AND METHODS Sample collection Tissue samples were obtained from silky and blue sharks caught as bycatch in the Chinese tuna longline fishery operating in the northeast central Pacific (approximately 8° to 10° N, 115° to 125° W) between June and November 2014. A skin tissue sample, including both dermis and dermal denticles, was excised from the anal fin region of each individual to minimize the effects of specific variation in skin thickness, and a small portion (~10 g) of white muscle tissue was excised adjacent to the vertebral column. Tissue samples were immediately placed on ice and frozen within 30 min of sampling. For each individual, precaudal length (PCL) was measured as the straight-line distance from the tip of the snout to the beginning of the caudal fin. The age of all sharks sampled was estimated from PCL data using von Bertalanffy growth parameters for the 2 species from the same sampling region (Oshitani et al. 2003, Nakano & Stevens 2008). The length at 50% maturity was set at 151 to 156 cm PCL and 150 to 159 cm PCL for the silky and blue shark, respectively (Oshitani et al. 2003, Nakano & Stevens 2008).
Stable isotope analysis Following the removal of dermal denticles and epidermis, isolated dermis tissue was washed and soaked overnight in de-ionized water. Dermis was then freeze-dried at −55°C for 48 h using a Christ Alpha 1-4 LD plus Freeze Dryer (Martin Christ), and each sample was homogenized using a Retsch Mixer Mill MM 400 (Retsch). Sharks maintain urea and trimethylamine oxide in their tissues for osmotic balance, which are considered to be 15N-depleted and may also affect δ13C values (Fisk et al. 2002, Li et al. 2016). Consequently, urea was removed from muscle tissue using a standard water washing technique (Kim & Koch 2012, Li et al. 2016). For δ15N analysis, all muscle tissue samples were urea-extracted, while for δ13C, both urea and lipids were removed using combined water washing and standard chloroformmethanol extraction (Li et al. 2016). Tissue samples were then freeze-dried to remove remaining solvent and divided into approximately 1 to 1.5 mg subsamples for stable isotope analysis using an IsoPrime 100 isotope ratio mass spectrometer (IsoPrime) and a vario ISOTOPE cube elemental analyzer (Elementar
Li et al.: Dermis and muscle isotopic variation in pelagic sharks
Analysensysteme) at Shanghai Ocean University Stable Isotope Laboratory. Reference standards for quantifying 13C and 15N stable isotope values, were USGS 24 (−16.1± 0.04 ‰ V-PDB) and USGS 26 (53.7 ± 0.4 ‰ V-AIR), respectively. The analytical errors of δ13C and δ15N values were ± 0.05 ‰ and ± 0.06 ‰, respectively.
Statistical analysis
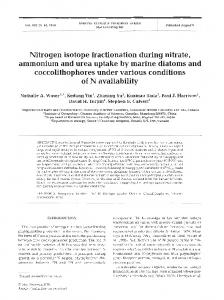
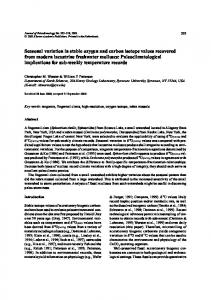
RESULTS Muscle and dermis from a total of 39 silky and 26 blue sharks ranging in size from 57 to 167 (mean: 107 ± 36) cm and 130 to 205 (mean: 153 ± 21) cm PCL, respectively, were sampled and analyzed (Fig. 1, Table 1). Paired t-tests found significant differences in δ13C and δ15N values between dermis and muscle tissue for both silky (δ13Cmuscle−dermis: t38 = 40.2, p < 0.01, δ15Nmuscle−dermis: t38 = −22.9, p < 0.01) and blue sharks (δ13Cmuscle−dermis: t25 = 37.1, p < 0.01, δ15Nmuscle−dermis: t25 = −6.5, p < 0.01). Mean dermis δ13C values of both pelagic sharks were consistently higher than those of muscle tissue by 2.5 ± 0.4 ‰ for silky and 2.1 ± 0.3 ‰ for blue sharks. In contrast, the trend of dermis−muscle δ15N values was not consistent between species. Table 1. Mean (±SD) tissue δ13C and δ15N values (‰) of Carcharhinus falciformis and Prionace glauca sampled from the northeast central Pacific Ocean. PCL: precaudal length in cm; age in yr C. falciformis (n = 39)
P. glauca (n = 26)
PCL (range) Age (range)
107 (57−167) 3.3 (0.3−8.2)a
153 (130−205) 4.0 (2.6−7.7)b
Carbon Muscle Skin Difference
−16.4 ± 0.2 −13.9 ± 0.4 −2.5 ± 0.4
−17.8 ± 0.7 −15.6 ± 0.6 −2.1 ± 0.3
Nitrogen Muscle Skin Difference
16.0 ± 0.7 13.7 ± 0.9 2.3 ± 0.6
16.1 ± 1.3 15.4 ± 1.0 0.7 ± 0.6
a
Oshitani et al. (2003) Nakano & Stevens (2008)
b
12
14
10
12
n (sample number)
n (sample number)
To examine the relationship of isotopic values between tissues, paired t-tests and correlation analyses were used to compare individual δ13C and δ15N values between dermis and muscle for silky and blue sharks. The mean differences in δ13C and δ15N values between dermis and muscle were then calculated to examine the isotopic offset between tissues for both species. To examine tissue isotopic differences over ontogeny, least squares linear regressions were fitted to determine the relationship between estimated age and muscle and dermis δ13C and δ15N values. The absolute isotopic differences between dermis and muscle per individual were calculated to further quantify age-based inter- and intra-tissue isotopic variation and to identify whether the observed agerelated trends were comparable between species. The above analyses were conducted on all the data grouped by species because an initial examination found no regional differences in isotope values. The normality of δ13C and δ15N values for dermis and muscle tissue were examined using a Shapiro-Wilk normality test. All statistical analyses were conducted using R version 3.1.2 (R Development Core Team 2014), and the level of statistical significance was set at α = 0.05.
8 6 4 2 0 20
55
10 8 6 4 2 0
40
60
80 100 120 140 160 180 200 220 240
Precaudal length (cm)
0
1
2
3
4
5
6
7
8
Age (yr)
Fig. 1. Size distribution and age of silky sharks Carcharhinus falciformis (black bars) and blue sharks Prionace glauca (grey bars) sampled from the northeast central Pacific
Aquat Biol 25: 53–60, 2016
56
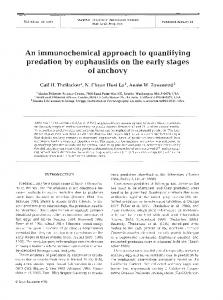
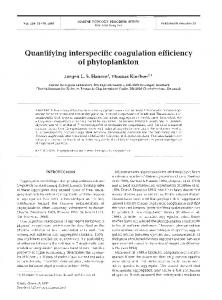
The mean difference in δ15N values between tissues was much larger for silky (2.3 ± 0.6 ‰) than blue sharks (0.7 ± 0.6 ‰) (p < 0.01; Table 1). The δ13C and δ15N values for dermis and muscle were highly correlated for both pelagic sharks. For silky sharks, the relationship between dermis and muscle δ13C values was significant but relatively weak compared to the dermis–muscle δ15N relationship (Fig. 2a,c). In contrast, the above δ13C and δ15N relationships for blue sharks were both strong with R2 > 0.84 and regression slopes that were not statistically different from 1 (Fig. 2b,d). Overall, the δ13C and δ15N values of each tissue exhibited similar trends with increasing age of shark. For silky sharks, the δ13C values of both tissues showed no relationship with age (dermis: R2 = 0.01, p = 0.5 and muscle: R2 = 0.01, p = 0.1; Fig. 3a). Conversely, there was a significant negative relationship between the δ15N values of silky shark dermis and age, and a similar but non-significant trend was observed between muscle δ15N values and age (Fig. 3c). For blue sharks, δ13C values of both tissues increased significantly with increasing age (dermis: R2 = 0.2, p < 0.05 and muscle: R2 = 0.2, p < 0.05; Fig. 3b). In –13
(a)
contrast, there was no relationship between δ15N values and age of blue sharks for either dermis or muscle (dermis: R2 = 0.01, p = 0.5 and muscle: R2 = 0.01, p = 0.1; Fig. 3d). The absolute difference between dermis and muscle δ13C values for both shark species were variable and showed no relationship with age (silky: R2 = 0.1, p = 0.06; blue: R2 = 0.1, p = 0.2, Fig. 4). For the silky shark, the absolute difference in dermis–muscle δ15N values increased significantly with age (R2 = 0.6, p < 0.001), while the absolute differences in δ15N values for the blue shark were more variable, and no age relationship was evident (R2 = 0.003, p = 0.8).
DISCUSSION Examination of the carbon and nitrogen isotopic relationships between different tissues sampled from pelagic sharks provides insights into the amenability of these tissues to address ecological questions over the species’ trophic roles, foraging behavior, and habitat use. Certain tissues may provide reliable surrogate isotope values for the most commonly ana18
y = 0.32x – 11.96 R 2 = 0.16, p = 0.01
δ15Nmuscle (‰)
–14
δ13Cmuscle (‰)
(c)
17
–15 –16 –17
16 15 14 13 y = 0.70x + 6.45 R 2 = 0.58, p < 0.001
12
–18 –18
–17
–16
–15
–14
11
–13
11
12
13
δ13Cdermis (‰) –14
15
16
17
18
18
(b)
y = 1.13x – 0.02 R 2 = 0.84, p < 0.001
(d)
17
δ15Nmuscle (‰)
δ13Cmuscle (‰)
–15
14
δ15Ndermis (‰)
–16 –17
16 15 14 13
–18 12 –19 –19
–18
–17
–16
δ13Cdermis (‰)
–15
–14
11
y = 1.21x – 2.56 R 2 = 0.86, p < 0.001 11
12
13
14
15
16
17
18
δ15Ndermis (‰)
Fig. 2. Comparison of δ13C (open circle) and δ15N (open diamond) values between skin and muscle tissue of (a,c) silky shark Carcharhinus falciformis (n = 39) and (b,d) blue shark Prionace glauca (n = 26). The dashed black line depicts the 1:1 isotopic relationship between the 2 tissues. The solid red lines indicate the regression slope for significant relationships, while the blue dashed lines represent the 95% confidence intervals of the regression analysis
Li et al.: Dermis and muscle isotopic variation in pelagic sharks
18
–12
(a)
–13
16
δ15N (‰)
δ13C (‰)
(c)
17
–14 –15 –16
15 14 13
–17
12
–18
y = –0.19x + 14.28 R 2 = 0.27, p < 0.05
11 0
2
4
6
8
10
0
2
4
Age (yr)
6
8
10
Age (yr)
y = 0.20x + 16.45 R 2 = 0.23, p < 0.01
–14
18
(b)
–15
(d)
17 16
–16
δ15N (‰)
δ13C (‰)
57
–17 –18
15 14 13
–19
y = 0.26x – 18.79 R 2 = 0.24, p < 0.01
12 11
–20 0
2
4
6
Age (yr)
8
10
0
2
4
6
Age (yr)
8
10
Fig. 3. Relationship of (a,b) δ13C and (c,d) δ15N values from paired samples of skin (solid circle and diamond) and muscle (open circle and diamond) and age for (a,c) silky shark Carcharhinus falciformis (n = 39) and (b,d) blue shark Prionace glauca (n = 26) sampled in northeast central Pacific. Solid red lines indicate the regression slope for significant relationships, while the blue dashed lines represent the 95% confidence intervals of the regression analysis. The vertical black dashed lines indicate age at 50% maturity
lyzed muscle tissue but are less invasive to sample, while multiple tissue sampling allows opportunities to examine temporal variation in diet and feeding interactions. The data present a comparative analysis of the isotope values of dermis and identify that it provides valuable information to further explore the trophic dynamics of these commercially exploited species. The fact that δ13C and δ15N values of dermis and muscle tissues for both pelagic shark species were significantly correlated and that standard deviations of each tissue were low for both isotopes indicates that dermis isotope values may provide a potential proxy for muscle tissue for specific life stages. These findings are in agreement with those previously reported for fin–muscle tissue isotopic relationships for sharks (Hussey et al. 2011, Matich et al. 2011). There was clear evidence, however, to suggest tissuespecific isotope values. Specifically, the weaker correlations between tissue isotope values for silky sharks compared to blue sharks support this latter point, identifying tissue-specific turnover rates and
isotopic integration periods. For the silky shark, this pattern may be a result of the different life-history stages sampled relative to the blue shark, given agespecific feeding reported among juvenile, sub-adult, and adult life-stages (Cabrera-Chávez-Costa et al. 2010, Malpica-Cruz et al. 2013). Marked ontogenetic dietary shifts have been previously reported for silky sharks, with juveniles feeding predominantly on jumbo squid Dosidicus gigas, whereas sub-adults consumed teleost fish Scomber japonicus (CabreraChávez-Costa et al. 2010). Variable turnover rates between dermis and muscle tissue coupled with a marked diet shift would result in the observed greater inter-tissue isotopic variation. In contrast, most blue sharks sampled were sub-adult and mature animals (Hsu et al. 2011) that consume epipelagic and mesopelagic cephalopods (Hernández-Aguilar et al. 2015), similar to the diet of juveniles (Nakano & Stevens 2008). This consumption would result in more consistent isotope values between tissues even with different turnover rates, but small sample sizes over ontogeny limit the conclusions that can be made.
Aquat Biol 25: 53–60, 2016
58
(a)
–3
3
2
15
1 y = –0.11x + 1.89 R 2 = 0.20, p < 0.05
0
–4 0
2
4
6
8
10
0
(b)
–2
4
6
8
10
(d)
2
1
0
15
13
–3
2
3
δ15N offset (δ Nmuscle-δ 13Ndermis ) (‰)
–1
δ13C offset (δ Cmuscle-δ 13Cdermis ) (‰)
(c)
4
δ15N offset (δ Nmuscle-δ 13Ndermis ) (‰)
–2
13
δ13C offset (δ Cmuscle-δ 13Cdermis ) (‰)
–1
–4
–1 0
2
4
6
Age (yr)
8
10
0
2
4
6
Age (yr)
8
10
Fig. 4. Difference of (a,b) δ13C and (c,d) δ15N values between paired skin and muscle tissue samples from (a,c) silky shark Carcharhinus falciformis and (b,d) blue shark Prionace glauca. Solid red lines indicate the regression slope for significant relationships, while the blue dashed lines represent the 95% confidence intervals of the regression analysis. The vertical black dashed lines indicate age at 50% maturity
Shark placoid scales or dermal denticles form in the dermis and increase in size with increasing body surface or body growth during the lifetime of an animal (reviewed by Meyer & Seegers 2012). The growth of these placoid scales is continuous, with substitution taking place as scales shed, resulting in different growth stages of scales occurring between fully grown dermal denticles (Meyer & Seegers 2012). Consequently, the isotopic incorporation rate of dermis is likely relatively fast, providing insight into short-term diet and feeding behavior when compared with muscle (Carlisle et al. 2012). The low regression slopes between muscle and dermis tissue isotope values of the silky shark may support this point. Previous studies have identified relatively fast isotopic turnover rates in skin tissue of marine mammals; for example, half lives of δ13C and δ15N were < 2 mo for manatees Trichechus manatus latirostris and bottlenose dolphins Tursiops truncatus, respectively (Alves-Stanley & Worthy 2009, Browning et al. 2014). Although the dermis of sharks is structurally different to that of marine mammals, the fact that skin shedding/replacement occurs across a broad
range of marine species (Alves-Stanley & Worthy 2009, Meyer & Seegers 2012, Browning et al. 2014) would suggest a faster isotopic turnover rate. For both shark species, dermis δ13C values were consistently higher than those of muscle tissue. Collagen and elastic fibers, the primary constituents of dermis (Meyer & Seegers 2012), typically drive enriched 13C values relative to diet (Kim & Koch 2012). This trend was previously reported for white shark dermal δ13C values relative to muscle (Carlisle et al. 2012, Jaime-Rivera et al. 2013). It is likely that 13C enrichment of dermis is a reflection of differences in biochemical composition between dermis and muscle, because each amino acid comprising the tissue proteins can vary in δ13C and δ15N values (Carlisle et al. 2012, Vander Zanden et al. 2014). Alternatively, tissue-specific diet discrimination factors may provide an explanation for the observed isotopic differences between tissues (Matich et al. 2010, Hussey et al. 2011, 2012, Cherel et al. 2014). It is still likely, however, that variable tissue-turnover rates explain some of the observed variation in δ13C and δ15N values between dermis and muscle (Hussey et al. 2011).
Li et al.: Dermis and muscle isotopic variation in pelagic sharks
It is important to note that the thickness of dermis can vary among species and over ontogeny, and females at different stages of reproductive maturity typically have variable dermal thickness related to mating (Motta 1977, Meyer & Seegers 2012). In this study, samples were taken from the anal fin area to minimize potential variation, but given that sex was not recorded, dermal thickness may also account for some of the observed isotopic variation. Following birth, juvenile silky sharks transition from coastal waters to offshore and pelagic habitat (Dagorn et al. 2007, Bonfil 2008) but continue to use shallow waters near the edge of the continental shelf and over deep-water reefs (Bonfil 1997). The δ13C−age relationships for both tissues of silky shark were non-significant, while the δ15N values in dermis decreased and the offset between dermis and muscle tissue δ15N values increased significantly with age, i.e. there was a large difference in values between tissues of older animals. These δ15N and δ13C relationships indicate that older and larger animals show a marked temporal shift in diet but that animals of all ages consistently occur in the same habitat (MalpicaCruz et al. 2013). For blue sharks, there were no obvious tissuespecific isotopic trends with age, but large variation among individuals was observed. This variation may suggest variable diets, but more likely reflects basinscale movements across spatial gradients in baseline δ15N values (Cherel et al. 2007, Polo-Silva et al. 2013, Kiszka et al. 2014). In contrast to the silky shark, the δ13C values of both tissues of blue sharks increased with age, possibly reflecting an ontogenetic shift in foraging location or increased consumption of 13Cenriched prey. Such size-related isotopic patterns are consistent with those reported for blue sharks in the Indian Ocean (Rabehagasoa et al. 2012, Kiszka et al. 2015). Pelagic sharks are top predators that couple marine ecosystems over large spatio-temporal scales; consequently, their removal is predicted to destabilize food web interactions (Heithaus et al. 2008). These data demonstrate that dermis can yield valuable isotope data to better understand the role of pelagic sharks, but observed differences between dermis and muscle tissue δ15N and δ13C values were species-specific and life stage-dependent, which may relate to variable isotopic routing, tissue-specific amino acid composition, and/or different turnover rates between tissues. Our data when compared to published fin and dermis isotope data for sharks suggest a combination of these influencing factors (Hussey et al. 2011, Carlisle et al. 2012), but further work will be required
59
to quantify dermis turnover rates and discrimination factors in sharks to improve confidence when interpreting multi-tissue stable isotope data.
Acknowledgements. We thank the observers who helped with the collection and processing of isotopic samples. We are grateful to Dr. Michael Heithaus for assistance with the raw data. We also acknowledge the detailed comments of 3 reviewers that improved the overall content of the manuscript. Y.L. was supported by the National Natural Science Foundation of China (#41206124; #41541042) and PhD Programs Foundation of Ministry of Education of China (#20123104120001) and N.E.H. was supported by funding from the Government of Nunavut and the Ocean Tracking Network.
LITERATURE CITED
➤ Alves-Stanley CD, Worthy GAJ (2009) Carbon and nitrogen
➤
➤
➤
➤
➤
➤
➤
➤ ➤
stable isotope turnover rates and diet−tissue discrimination in Florida manatees (Trichechus manatus latirostris). J Exp Biol 212:2349−2355 Bonfil R (1997) Status of shark resources in the southern Gulf of Mexico and Caribbean: implications for management. Fish Res 29:101−117 Bonfil R (2008) The biology and ecology of the silky shark, Carcharhinus falciformis. In: Canhi MD, Pikitch EK, Babcock EA (eds) Sharks of the open ocean: biology, fisheries and conservation. Blackwell Publishing, Oxford, p 114−124 Browning NE, Dold C, I-Fan J, Worthy GAJ (2014) Isotope turnover rates and diet−tissue discrimination in skin of ex situ bottlenose dolphins (Tursiops truncatus). J Exp Biol 217:214−221 Cabrera-Chávez-Costa AA, Galván-Magaña F, EscobarSánchez O (2010) Food habits of the silky shark Carcharhinus falciformis (Müller & Henle, 1839) off the western coast of Baja California Sur, Mexico. J Appl Ichthyol 26: 499−503 Carlisle AB, Kim SL, Semmens BX, Madigan DJ and others (2012) Using stable isotope analysis to understand the migration and trophic ecology of northeastern Pacific white sharks (Carcharodon carcharias). PLOS ONE 7: e30492 Carlisle AB, Goldman KJ, Litvin SY, Madigan DJ and others (2015) Stable isotope analysis of vertebrae reveals ontogenetic changes in habitat in an endothermic pelagic shark. Proc R Soc B 282:20141446 Cherel Y, Hobson KA, Guinet C, Vanpe C (2007) Stable isotopes document seasonal changes in trophic niches and winter foraging individual specialization in diving predators from the Southern Ocean. J Anim Ecol 76:826−836 Cherel Y, Jaquemet S, Maglio A, Jaeger A (2014) Differences in δ13C and δ15N values between feathers and blood of seabird chicks: implications for non-invasive isotopic investigations. Mar Biol 161:229−237 Dagorn L, Pincock D, Girard C, Holland K and others (2007) Satelite-linked acoustic receivers to observe behaviour of fish in remote areas. Aquat Living Resour 20:307−312 Dulvy NK, Fowler SL, Musick JA, Cavanagh RD, and others (2014) Extinction risk and conservation of the world’s sharks and rays. eLife 3:e00590
60
Aquat Biol 25: 53–60, 2016
➤ Estrada JA, Rice AN, Lutcavage ME, Skomal GB (2003) Pre-
➤ ➤
➤
➤ ➤ ➤
➤
➤
➤
➤ ➤
➤
➤
➤
➤
dicting trophic position in sharks of the northwest Atlantic Ocean using stable isotopes. J Mar Biol Assoc UK 83:1347−1350 Estrada JA, Rice AN, Natanson LJ, Skomal GB (2006) Use of isotopic analysis of vertebrae in reconstructing ontogenetic feeding ecology in white sharks. Ecology 87:829−834 Fisk AT, Tittlemier SA, Pranschke JL, Norstrom RJ (2002) Using anthropogenic contaminants and stable isotopes to assess the feeding ecology of Greenland sharks. Ecology 83:2162−2172 Galván-Magaña F, Polo-Silva C, Hernández-Aguilar SB, Sandoval-Londoño A and others (2013) Shark predation on cephalopods in the Mexican and Ecuadorian Pacific Ocean. Deep-Sea Res II 95:52−62 Hammerschlag N, Sulikowski J (2011) Killing for conservation: the need for alternatives to lethal sampling of apex predatory sharks. Endang Species Res 14:135−140 Heithaus MR, Frid A, Wirsing AJ, Worm B (2008) Predicting ecological consequences of marine top predator declines. Trends Ecol Evol 23:202−210 Hernández-Aguilar SB, Escobar-Sánchez O, Galván-Magaña F, Abitia-Cárdenas LA (2015) Trophic ecology of the blue shark (Prionace glauca) based on stable isotopes (δ13C and δ15N) and stomach content. J Mar Biol Assoc UK 9:1−8 Hsu HH, Joung SJ, Lyu GT, Liu KM, Huang CC (2011) Age and growth of the blue shark, Prionace glauca, in the northwest Pacific. ISC/11/SHARKWG-2/INFO02 Hussey NE, Chapman DD, Donnelly E, Abercrombie DL, Fisk AT (2011) Fin-icky samples: an assessment of shark fin as a source material for stable isotope analysis. Limnol Oceanogr Methods 9:524−532 Hussey NE, MacNeil MA, Olin JA, McMeans BC, Chapman DD, Fisk AT (2012) Stable isotopes and elasmobranchs: tissue types, methods, applications and assumptions. J Fish Biol 80:1449−1484 Jaime-Rivera M, Caraveo-Patiño J, Hoyos-Padilla M, Galván-Magaña F (2013) Evaluation of biopsy systems for sampling white shark Carcharodon carcharias (Lamniformes: Lamnidae) muscle for stable isotope analysis. Rev Biol Mar Oceanogr 48:345–351 Kim SL, Koch PL (2012) Methods to collect, preserve, and prepare elasmobranch tissues for stable isotope analysis. Environ Biol Fishes 95:53−63 Kim SL, Casper DR, Galván-Magaña F, Ochoa-Díaz R, Hernández-Aguilar SB, Koch PL (2012a) Carbon and nitrogen discrimination factors for elasmobranch soft tissues based on a long-term controlled feeding study. Environ Biol Fishes 95:37−52 Kim SL, Tinker MT, Estes JA, Koch PL (2012b) Ontogenetic and among-individual variation in foraging strategies of northeast Pacific white sharks based on stable isotope analysis. PLOS ONE 7:e45068 Kinney MJ, Hussey NE, Fisk AT, Tobin AJ, Simpfendorfer CA (2011) Communal or competitive? Stable isotope analysis provides evidence of resource partitioning within a communal shark nursery. Mar Ecol Prog Ser 439:263−276 Kiszka JJ, Charlot K, Hussey NE, Heithaus MR and others (2014) Trophic ecology of common elasmobranchs exploited by artisanal shark fisheries off south-western Madagascar. Aquat Biol 23:29−38 Kiszka JJ, Aubail A, Hussey NE, Heithaus MR and others (2015) Plasticity of trophic interactions among sharks from the oceanic south-western Indian Ocean revealed by stable Editorial responsibility: Roderick Finn, Bergen, Norway
isotope and mercury analyses. Deep-Sea Res I 96:49−58 (2016) Urea and lipid extrac➤ Li Y, Zhang Y, Hussey N, Dai X 15 13
➤
➤ ➤
➤ ➤ ➤
➤
➤ ➤
➤
➤
➤
➤
tion treatment effects on δ N and δ C values in pelagic sharks. Rapid Commun Mass Spectrom 30:1−8 MacNeil MA, Skomal GB, Fisk AT (2005) Stable isotopes from multiple tissues reveal diet switching sharks. Mar Ecol Prog Ser 302:199−206 Malpica-Cruz L, Herzka SZ, Sosa-Nishizaki O, EscobedoOlvera A (2013) Tissue-specific stable isotope ratios of shortfin-mako (Isurus oxyrinchus) and white (Carcharodon carcharias) sharks as indicators of size-based differences in foraging habitat and trophic level. Fish Oceanogr 22:429−445 Martínez del Rio C, Wolf N, Carleton SA, Gannes LE (2009) Isotopic ecology of ten years after a call for more laboratory experiments. Biol Rev Camb Philos Soc 84:91−111 Matich P, Heithaus MR, Layman CA (2010) Size-based variation in intertissue comparisons of stable carbon and nitrogen isotopic signatures of bull sharks (Carcharhinus leucas) and tiger sharks (Galeocerdo cuvier). Can J Fish Aquat Sci 67:877−885 Matich P, Heithaus MR, Layman CA (2011) Contrasting patterns of individual specialization and trophic coupling in two marine apex predators. J Anim Ecol 80:294−305 Meyer W, Seegers U (2012) Basics of skin structure and function in elasmobranchs: a review. J Fish Biol 80: 1940−1967 Motta PJ (1977) Anatomy and functional morphology of dermal collagen fibers in sharks. Copeia 1977:454−464 Nakano H, Stevens JD (2008). The biology and ecology of the blue shark, Prionace glauca. In: Camhi MD, Pikitch EK, Babcock EA (eds) Sharks of the open ocean: biology, fisheries and conservation. Blackwell Publishing, Oxford, p 140−159 Olin JA, Hussey NE, Fritts M, Heupel MR and others (2011) Maternal meddling in neonatal sharks: implications for interpreting stable isotopes in young animals. Rapid Commun Mass Spectrom 25:1008−1016 Oshitani S, Nakano H, Tanaka S (2003) Age and growth of the silky shark Carcharhinus falciformis from the Pacific Ocean. Fish Sci 69:456−464 Polo-Silva C, Newsome SD, Galván-Magaña F, GrijalbaBendeck M, Sanjuan-Muñoz A (2013) Trophic shift in the diet of the pelagic thresher shark based on stomach contents and stable isotope analyses. Mar Biol Res 9:958−971 R Development Core Team (2014) R: a language and environment for statistical computing. R Foundation for Statistical Computing, Vienna Rabehagasoa N, Lorrain A, Bach P, Potier M, Jaquemet S, Richard P, Ménard F (2012) Isotopic niches of the blue shark Prionace glauca and the silky shark Carcharhinus falciformis in the south western Indian Ocean. Endang Species Res 17:83−92 Stevens JD, Bradford RW, West GJ (2010) Satellite tagging of blue sharks (Prionace glauca) and other pelagic sharks off eastern Australia: depth behavior, temperature experience and movements. Mar Biol 157:575−591 Vander Zanden HB, Tucker AD, Bolten AB, Reich KJ, Bjorndal KA (2014) Stable isotopic comparison between loggerhead sea turtle tissues. Rapid Commun Mass Spectrom 28:2059−2064 Willis TJ, Sweeting CJ, Bury SJ, Handley SJ and others (2013) Matching and mismatching stable isotope (δ13C and δ15N) ratios in fin and muscle tissue among fish species: a critical review. Mar Biol 160:1633−1644 Submitted: December 2, 2015; Accepted: June 20, 2016 Proofs received from author(s): July 21, 2016