variation in thermal performance curves of short-term caterpillar growth rate in a
population of .... do not actively regulate body temperature (Casey 1993), we.
Evolution, 58(7), 2004, pp. 1521–1529
QUANTITATIVE GENETICS OF CONTINUOUS REACTION NORMS: THERMAL SENSITIVITY OF CATERPILLAR GROWTH RATES JOEL G. KINGSOLVER,1 GREGORY J. RAGLAND,
AND
J. GWEN SHLICHTA2
Department of Biology, CB-3280, University of North Carolina, Chapel Hill, North Carolina 27599-3280 1 E-mail:
[email protected] Abstract. A continuous reaction norm or performance curve represents a phenotypic trait of an individual or genotype in which the trait value may vary with some continuous environmental variable. We explore patterns of genetic variation in thermal performance curves of short-term caterpillar growth rate in a population of Pieris rapae. We compare multivariate methods, which treat performance at each test temperature as a distinct trait, with functionvalued methods that treat a performance curve as a continuous function. Mean growth rate increased with increasing temperatures from 8 to 358C, was highest at 358C, and declined at 408C. There was substantial and significant variation among full-sib families in their thermal performance curves. Estimates of broad-sense genetic variances and covariances showed that genetic variance in growth rate increased more than 30-fold from low (8–118C) to high (35–408C) temperatures, even after differences in mean growth rate across temperatures were removed. Growth rate at 35 and 408C was negatively correlated genetically, suggesting a genetic trade-off in growth rate at these temperatures; this trade-off may represent either a generalist-specialist trade-off and/or variation in the optimal temperature for growth. The estimated genetic variance-covariance function (G function), the function-valued analog of the variance-covariance matrix (G matrix), was quite bumpy compared with the estimated G matrix; and results of principal component analyses of the G function were difficult to interpret. The use of orthogonal polynomials as the basis functions in current function-valued estimation methods may generate artifacts when the true G function has prominent local features, such as strong negative covariances at nearby temperatures (e.g. at 35 and 408C); this may be a particular issue for thermal performance curves and other highly nonlinear reaction norms. Key words.
Continuous reaction norms, genetic variation, insect growth, performance curves, temperature. Received September 29, 2003.
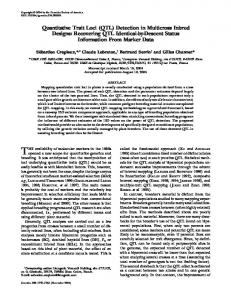
The relationship between the phenotypic or genotypic value of an individual as a function of environmental conditions is called a reaction norm. If the environmental state varies continuously, as with temperature, light intensity, or soil moisture, then the phenotypic value may also vary continuously, yielding a continuous reaction norm. Understanding variation, selection, and evolution of continuous reaction norms has been a central challenge for evolutionary ecology for several decades (Scheiner 1993; Stearns 1989; Schlichting and Pigliucci 1998). One important question about continuous reaction norms concerns their genetic architecture: specifically, what are the patterns of genetic variation and covariation in continuous reaction norms found in natural populations (Scheiner 1993)? There are both biological and methodological aspects to this question. To explore the biological aspects, consider the relationship between organismal performance to temperature as an example of a continuous reaction norm, sometimes called a thermal performance curve (TPC; Huey and Stevenson 1979; Huey and Kingsolver 1989; Angilletta et al. 2003; Fig. 1). Evolutionary physiologists have proposed three distinct patterns of variation in such performance curves: the hotter-colder, the faster-slower, and the generalist-specialist hypotheses (Huey and Kingsolver 1989; Fig. 1). First (hottercolder, Fig. 1, top panel), a set of individuals or genotypes might vary in the temperature at which performance is maximal, such that some individuals or genotypes have maximal performance at hotter temperatures, whereas other individuals or genotypes have maximal performance at colder temperatures relative to the mean reaction norm for the popu2 Present address: Department of Entomology, University of Maryland, College Park, Maryland 20742.
Accepted March 19, 2004.
lation. Alternatively, (faster-slower hypothesis, Fig. 1, middle), imagine a set of individuals or genotypes that vary in the overall height of the reaction norm, such that some individuals or genotypes have greater performance at all temperatures, or lesser performance at all temperatures relative to the mean TPC for the population. A third possibility (generalist-specialist, Fig. 1, bottom) is that a set of individuals or genotypes might vary in the width of the reaction norm, such that individuals or genotypes with greater performance at intermediate temperatures have lower performance at low and high temperatures (specialists), whereas individuals or genotypes with lower performance at intermediate temperatures have greater performance at low and high temperatures (generalists) relative to the mean reaction norm for the population. We can think of these three different patterns—hotter-colder, faster-slower, and generalist-specialist—as different possible ‘‘directions’’ of variation in TPCs within a population; of course real populations may contain mixtures of genotypes that vary along these (and other possible) axes of variation. A central challenge is to quantify how different components of variation contribute to the total genetic variation in thermal performance curves in a population (Kingsolver et al. 2001). A related biological issue is the contrast between two different types of phenotypic plasticity: developmental reaction norms and performance curves. For a developmental reaction norm, the temperature(s) experienced during development may affect the trait value expressed at some later stage (e.g. adult body size), but an individual expresses only a single trait value. By contrast, for a thermal performance curve the performance of an individual may vary continuously and reversibly as its body temperature varies, so that an individual may express a wide range of performance values within its
1521 q 2004 The Society for the Study of Evolution. All rights reserved.
1522
JOEL G. KINGSOLVER ET AL.
covariation in growth rate across temperatures? Second, do patterns of genetic variation indicate genetic trade-offs in growth rate across temperatures? Third, are multivariate or function-valued methods of estimation more informative about patterns of variation in thermal performance curves for growth rate? MATERIALS
AND
METHODS
The Study System
FIG. 1. Hypothetical patterns of variation in thermal performance curves. Adapted from figure 1 in Huey and Kingsolver (1989). Top panel: hotter-colder; middle: faster-slower; bottom: generalist-specialist.
lifetime. Many studies have explored genetic variation in developmental reaction norms for temperatures (Scheiner 1993), but only a handful of studies have examined the quantitative genetics of thermal performance curves (Gilchrist 1996). The methodological issue is how best to estimate genetic variation from data on continuous reaction norms, including performance curves. Suppose z(T) represents a continuous reaction norm for some environmental variable, T. Typically we can measure phenotype z at a (finite) series of values of T for each individual or genotype. The standard, multivariate approach to these data is to represent the phenotype as a vector of distinct, correlated traits at each value of T (Falconer and MacKay 1996; Via and Lande 1985). One can then estimate the genetic variance-covariance matrix for this set of traits by standard quantitative genetic methods (Falconer and MacKay 1996; Shaw 1987). However, this approach ignores the continuous nature of such reaction norms, and may seriously underestimate the magnitude of constraints on patterns of genetic variation (Kirkpatrick et al. 1990; Kirkpatrick and Lofsvold 1992). The alternative, ‘‘function-valued’’ approach treats reaction norms explicitly as continuous functions (Kirkpatrick and Heckman 1989; Gomulkiewicz and Kirkpatrick 1992; Meyer and Hill 1997; Meyer 1998; Pletcher and Geyer 1999; Kingsolver et al. 2001). The relative merits of multivariate versus function-valued approaches have not been investigated for strongly nonlinear reaction norms, such as thermal performance curves. Here we explore these biological and methodological issues in a study of quantitative genetic variation in thermal performance curves for growth rate in larvae of the cabbage white butterfly, Pieris rapae. We address three main questions. First, what are the patterns of genetic variation and
The cabbage white butterfly Pieris rapae L. (Lepidoptera: Pieridae) is native to Europe, and was introduced to eastern North America more than 140 years ago. It now occurs on every continent except Antarctica in a variety of open habitats. Pieris rapae caterpillars may feed on a wide variety of different host plants in the family Brassicaeae. Pieris rapae is an agricultural pest on domesticated varieties of Brassica oleracea, including collards, and it is abundant in vegetable gardens and organic farms in many areas of North America. Because of its pest status and ease of maintenance in the lab, many aspects of the feeding, and thermal and population biology of P. rapae have been studied (Slansky and Feeny 1977; Van Driesche 1988; Mauricio and Bowers 1990; Slansky 1993). As with other ectotherms, growth and developmental rates of P. rapae caterpillars depend strongly on body temperature, and the effects of temperature on growth and development rates are similar in each of the five larval instars (Chen and Su 1982; Kingsolver 2000). In optimal conditions development from egg to pupation can occur in less than three weeks. More than 93% of all larval growth (mass increase) occurs in the fourth and fifth (final) instars. These caterpillars feed during both day and night (light and dark) if temperature conditions are appropriate. For both fourth and fifth instar P. rapae caterpillars from Seattle, Washington, mean short-term (6 h) growth rate increases with increasing temperatures between 8 and 358C, reaches a maximum near 358C, and declines at temperatures above 358C (Kingsolver 2000). Because P. rapae caterpillars are thermoconformers that do not actively regulate body temperature (Casey 1993), we have successfully used physical models to assay caterpillar (operative) temperatures in the field (Kingsolver 2000; Kingsolver et al. 2001). Continuous temperature measurements of arrays of model caterpillars in an experimental collard (Brassica oleracea var. collard) garden in Seattle show that caterpillar temperatures frequently vary by 20–258C over a single diurnal cycle. For example, during a three-week period in July–August 2000, operative temperatures in the garden ranged from 6 to 388C, covering nearly the entire temperature range allowing effective growth (J. G. Kingsolver and J. G. Shlichta, unpubl. data). Consequently, an individual caterpillar experiences a wide range of temperature conditions during its lifetime, and thus may express a wide range of growth rates (see Fig. 1). In addition, the wide diurnal temperature fluctuations imply that caterpillars only experience any particular temperature for a short time period, especially at higher temperatures. As a result, our assays of growth rate use measurements over short time intervals (2–14 h) (see next section). The studies described here consider the population of P.
VARIATION IN CONTINUOUS REACTION NORMS
rapae in Puget Sound, Washington, within 50–100 km of Seattle. Pieris rapae adults are highly dispersive, and Puget Sound likely represents a single, large, well-mixed genetic population over this spatial scale (Vawter 1977). Pieris rapae occur throughout this region, but are most abundant in gardens and organic farms where Brassica crops are grown. Pieris rapae have three to four generations per year in this region, with adult flight seasons between May and October, and a pupal diapause stage during the winter months. Our studies used wild-caught females obtained from several organic farms in the Puget Sound area. Experimental Design The purpose of these studies was to measure short-term growth rate at a series of temperatures for individual caterpillars within a full-sib breeding design. The studies began with young, wild-caught females obtained from organic farms near Seattle (see above). In the field, females almost always mate within a few hours of adult eclosion; after mating there is a refractory period of two to four days before a female mates again (Wiklund et al. 2001). In addition, there is nearly complete sperm precedence when females remate (Wedell and Cook 1998, 1999a,b; Wiklund et al. 2001). Thus, all offspring of each female in our studies very likely represented full-sibs although we cannot rule out some possibility for multiple paternity. The consequences of some multiple paternity (resulting in half-sibs rather than full-sibs) would be to reduce the nonadditive components of genetic variance in our estimates (see below). Each adult female was fed a mixture of 20% honey water and allowed to oviposit on a collard plant in a small individual cage in the greenhouse. After hatching, larvae were transferred to collard leaves (Champion variety) in petri dishes, and fresh leaves were provided every one to two days. Caterpillars were reared in an environmental chamber under a diurnally fluctuating light and temperature regime (10–308C) that simulated the operative temperature conditions experienced in the field in Seattle (Kingsolver 2000). Following molt into the third instar, each caterpillar was housed in an individual petri dish. The measurements began with caterpillars newly molted into the fourth instar. In the morning following molt, the growth rate (mass increase/time) of each caterpillar was measured at a series of six constant temperatures, such that all measurements on an individual were completed within a 48h period. All mass measurements were made with a Mettler Toledo (Columbus, OH) electronic microbalance (60.01 mg) interfaced to a notebook computer. The duration and time of day of exposure to each measurement temperature were chosen to reflect thermal conditions experienced during rearing (and during natural conditions in the field): higher temperatures involved shorter measurement durations during daytime, whereas lower temperatures involved longer measurement durations during nighttime. No acclimation period was used before measurements. Two independent sets of experiments were performed, involving different sets of families: experiment I measured growth rates for temperatures between 8 and 358C; experiment II measured growth rates for temperatures between 11 and 408C. The temporal order (and
1523
duration) of the growth rate measurements were as follows: for experiment I, 238C (4–5 h), 298C (3–4 h), 118C (12 h), 178C (5–6 h), 358C (2–3 h), 88C (14–16 h); for experiment II, 238C (4–5 h), 298C (3–4 h), 118C (12 h), 178C (5–6 h), 358C (2–3 h), 408C (2 h). In this design, all caterpillars experienced the same order of temperature measurement, rather than a random order. This ordering yielded measurements at higher temperatures over shorter time periods during daytime, and at lower temperatures for longer time periods during nighttime, as experienced during rearing and in natural conditions. Note that measurements at the most extreme temperatures (8 and 408C) were made last, since these temperatures are most likely to be stressful and to alter subsequent growth responses (see the Discussion). Our goal was to estimate growth rate as a function of temperature for early fourth instar caterpillars that were healthy and actively feeding. To achieve this we excluded some data from further analysis using the following data selection criteria. First, newly molted fourth instar caterpillars typically weigh 10–15 mg. Thus, caterpillars weighing more than 20 mg prior to the first measurement period were excluded, both to reduce initial size variation and to exclude caterpillars that were likely to enter molt into the fifth instar before the completion of the measurements. Second, measurements for a caterpillar that did not actively ingest food during a measurement period (some visible consumption of leaf material) were excluded. If a caterpillar failed to feed actively during more than two measurement periods, all data for that caterpillar were excluded. Third, caterpillars that were visibly unhealthy (e.g. spots or brown coloration) or that died during any measurement period were excluded. Fourth, fourth instar caterpillars typically stop feeding and begin to enter molt at a weight of 45–50 mg. Thus, if a caterpillar weighed more than 40 mg at the start of a measurement period, data for that measurement period were excluded. Fifth, data for families with less than three caterpillars represented were excluded. After excluding data using these criteria, the two experiments resulted in data for 1088 individuals from 90 full-sib families, with a mean (median) family size of 12 (13). There were 559 individuals from 55 families (median family size 5 10) in experiment I, and 529 individuals from 35 families (median family size 5 17) in experiment II. Growth in caterpillars and other insects is not strictly isometric, such that mass-specific growth rate may change with size. Although all caterpillars in our experiments started at a similar size and stage, variation in mass did occur both within and between temperature measurements. We regressed growth rate on initial mass within each temperature, and used residuals from these regressions in subsequent analyses. We also considered log-transformed data, but this did not increase the variation explained by the regressions. The variation explained by these regressions was relatively small, ranging from 0.2% (88C) to 11% (408C). Note that because our subsequent analyses used residuals, the mean value of growth rate at each temperature was zero. Quantitative Genetic Analyses Because we used a full-sib breeding design, our analyses provide estimates of broad-sense genetic variances and co-
1524
JOEL G. KINGSOLVER ET AL.
variances that include additive genetic, nonadditive genetic, and maternal effects. To estimate the quantitative genetic parameters of the multivariate and continuous models described below we implemented the ‘‘average information’’ restricted maximum likelihood (REML) algorithm in the program DFREML (Meyer 1998). Preliminary analyses indicated that treating the experiments separately did not improve model fit (based on the Bayesian information criterion, BIC: see below), so data from the two experiments were combined. For the standard multivariate analyses, growth rate at each temperature is considered as a distinct trait so that the phenotype of an individual is represented as a vector of seven traits (growth rate at each of the seven temperatures measured). The genetic variance-covariance matrix (G matrix) was estimated using the REML procedure described by Meyer and Smith (1996). Note that an off-diagonal element in the G matrix represents the genetic covariance between growth rate at temperature (say) T1 and growth rate at temperature T2. In reality the seven traits represent a single trait (growth rate) measured in different environmental conditions, so we focus our presentation on variances and covariances rather than heritabilities and genetic correlations. The multivariate analysis ignores the fact that growth rate is a continuous function of temperature. For example, the multivariate approach does not take into account that temperatures are naturally ordered, nor that our test temperatures are not uniformly spaced: measurements at low (8 and 118C) and high (35 and 408C) are more closely spaced than at intermediate temperatures. We chose this temperature spacing because of our specific interest in high and low temperature responses that might reflect trade-offs (see introduction). In the function-valued approach, the phenotype of an individual is represented as a continuous function of temperature, z(T). The function-valued analysis estimates the genetic variancecovariance function, G(T, u): this represents the genetic variance or covariance between growth rate at temperature T and growth rate at temperature u, where T and u are continuous. Kirkpatrick and colleagues (Kirkpatrick and Heckman 1989; Kirkpatrick et al. 1990; Kirkpatrick and Lofsvold 1992) described a least-squares method for estimating the G function using Legendre polynomials; the maximum order of the polynomials is set by the number of temperatures at which the trait is measured. We fit the genetic covariance function to Legendre polynomials using an alternative random regression model (and REML procedure) described in Meyer (1998). The Bayesian information criterion (BIC) was used to select the order of fit for G(T, u) that best fits the data; the BIC represents a trade-off between the likelihood of the model (more is better) and the number of model parameters (fewer is better). Use of the Aikaike information criterion (AIC) identified the same best model as the BIC in our analyses. Principal Component (Eigen) Analyses It is often difficult to interpret general patterns of genetic covariation from visual inspection of the G matrix (or G function). The standard multivariate method to address this is to decompose the G matrix into a set of eigenvectors (principal components) and associated eigenvalues. An eigenvector represents a direction (a linear combination of the original
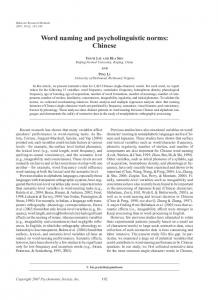
traits) of variation in the data; its associated eigenvalue represents the amount of genetic variation in the direction represented by the eigenvector. By convention, the eigenvectors are ordered so that the first (leading) eigenvector represents the greatest amount of overall genetic variation. Of particular interest are the eigenvector loadings, which represent the correlation of the original traits (in our case growth rate at each measurement temperature) with the eigenvector. Indeed, there is a useful relationship between eigenvector (and eigenfunction) loadings and the biological hypotheses represented in Figure 1 (Kingsolver et al. 2001). For example, if the loadings on an eigenvector all have the same sign, this would indicate that genotypes or families with relatively (compared to the mean) higher growth rates at one temperature would have relatively higher growth rates at all other temperatures, and that genotypes or families with relatively lower growth rates at one temperature would have relatively lower growth rates at all other temperatures. This is the pattern of loadings that would result from the fasterslower pattern of variation (Fig. 1, middle). Conversely, if the loadings on an eigenvector are of opposite sign at two different temperatures T1 and T2, then genotypes or families with relatively higher growth rates at T1 would have relatively lower growth rates at T2, and genotypes or families with relatively lower growth rates at T1 would have relatively higher growth rates at T2. This pattern of positive and negative loadings across temperatures may be generated by genetic trade-offs as represented by the hotter-colder or specialist-generalist patterns of variation (Fig. 1). Thus, eigenvectors provide information about the patterns of genetic covariation in growth rate across temperatures (Kingsolver et al. 2001). In the function-valued case, we can similarly decompose the G function into a set of eigenfunctions and associated eigenvectors (Kirkpatrick and Lofsvold 1988; Kirkpatrick et al. 1990). The eigenfunctions are the continuous analog of eigenvectors, and the loadings on eigenfunctions and eigenvectors have similar interpretations (Kingsolver et al. 2001). In current implementations of this method, Legendre polynomials provide the basis functions for eigenfunction decomposition (Kirkpatrick et al. 1990; Meyer 1998). RESULTS Figure 2 presents mean thermal performance curves for growth rate (mass increase/time) across temperatures for each of the 90 families, with 55 families measured from 8 to 358C (experiment I) and 35 families measured from 11 to 408C (experiment II). Visual inspection suggests that there was substantial variation in growth rate among families at each temperature. The mean growth rate across all families (heavy line) increased with increasing temperatures from 8 to 358C, was greatest at 358C, and declined at 408C; however, there was considerable variation among families in the temperature at which growth rate is greatest. Recall that all subsequent analyses used residual values of growth rate, such that mean growth rate at each temperature was zero (see Materials and Methods). Analyses of the broadsense genetic variance-covariance matrix indicated significant genetic variation in growth rate at each temperature (Ta-
1525
VARIATION IN CONTINUOUS REACTION NORMS
FIG. 2. Thermal reaction norms for mean growth rate (mg/h) for 90 sib families of fourth-instar Pieris rapae caterpillars from Seattle, Washington. Data from experiments I (dashed lines) and II (solid lines) are combined.
ble 1). Broad-sense heritabilities (not shown) ranged from 16% at 358C to 43% at 238C. Genetic variances increased with increasing temperature, especially at the highest temperatures. For example, genetic variances at 35 and 408C were more than 30 times greater than those at 8 and 118C. Since our analyses used residual values with mean zero at each temperature, these changes in variance were not simply associated with changes in mean values. Many of the estimated genetic covariances (off-diagonal elements of the G matrix) were relatively small. However, there was a large and significant negative genetic covariance between growth rate at 358C and at 408C (genetic correlation rg 5 20.59). As a result, individuals from families with relatively high growth rates at 358C have relatively low growth rates at 408C, and vice versa. A seventh order (full fit) polynomial was the best-fit model for the G function selected by the BIC. A likelihood ratio
FIG. 3. Estimated broad-sense genetic variance-covariance function (G function) for short-term growth rate (mg/h) as a function of temperature (8C) in fourth-instar caterpillars of Pieris rapae from Seattle, Washington.
test indicated that a reduced-order polynomial provided a significantly worse fit to the data. The estimated G function (Fig. 3) indicated that genetic variance increased with increasing temperature. The G function also indicated strong negative genetic covariances for growth rates between 35 and 408C, as with the G matrix. However, the estimated G function was quite ‘‘bumpy’’; these bumps may be the result of fitting polynomials to the strong negative covariance between 35 and 408C (see Discussion). The first three eigenvectors produced from the principal component decomposition of the G matrix accounted for 94% of the total genetic variation (Fig. 4). The first eigenvector, accounting for 60% of the total variation, had a large positive loading at 358C and large negative loading at 408C; loadings at the other temperatures were comparatively small in magnitude. This eigenvector reflects the large, negative genetic covariance between growth rate at 358C and 408C as a dominant feature of the G matrix (Table 1). The second eigenvector, accounting for 19% of the total variation, had positive
TABLE 1. Estimated broad-sense genetic variance-covariance matrix for short-term growth rate at different temperatures (8–408C) in fourth-instar caterpillars of Pieris rapae from Seattle, Washington. Genetic variances are on the diagonal, and genetic covariances are below the diagonal; standard errors (SE) are given in parentheses below each estimate. Estimates greater than 2 3 SE are in bold.
8 11 17 23 29 35 40
8
11
17
23
29
35
40
0.0067 (0.0021) 0.0020 (0.0016) 0.0037 (0.0048) 0.0012 (0.0062) 0.0031 (0.0063) 0.0249 (0.0120) NA (NA)
0.0079 (0.0020) 20.0028 (0.0038) 0.0086 (0.0055) 20.0055 (0.0056) 20.0116 (0.0092) 0.0069 (0.0165)
0.0479 (0.0129) 20.0112 (0.0140) 0.0161 (0.0139) 0.0686 (0.0234) 0.0187 (0.0340)
0.1472 (0.0299) 20.0241 (0.0213) 20.0235 (0.0355) 0.1266 (0.0630)
0.1174 (0.0291) 0.0058 (0.0349) 0.0570 (0.0568)
0.2723 (0.0826) 20.2065 (0.0933)
0.4472 (0.1666)
1526
JOEL G. KINGSOLVER ET AL.
FIG. 4. Eigenvectors (EV) from the principal components analysis of the G matrix in Table 1. The loadings at each temperature for the first three eigenvectors are given.
loadings for all temperatures between 17 and 408C; loadings at lower temperatures (8 and 118C) were comparatively small in magnitude. Growth rates tended to be positively genetically correlated for temperatures above 178C within this axis of variation. Principal components analysis of the G function showed that the first three eigenfunctions accounted for 94% of the total genetic variation (Fig. 5). The first two eigenfunctions account for similar amounts of variation (42% and 36%, respectively). Each of the first three eigenfunctions was quite bumpy, with a complex pattern of positive and negative loadings that had no obvious biological interpretation. The bumpiness of the eigenfunctions reflects the bumpiness of the G function, resulting from the high order (seventh) polynomial fitting involved. DISCUSSION Limitations of the Studies There are several limitations of our studies for inferring patterns of genetic variation. First, for practical reasons our studies employ full-sib families; as a result we can only estimate broad-sense genetic variances that may include additive and nonadditive genetic components as well as maternal effects. Numerous studies have documented the contributions of maternal or paternal effects on body size, life history, and other traits (Rossiter 1996; Mousseau and Fox 1998). We have tried to reduce possible maternal effects due to overall size or vigor by using residual values corrected for size (body mass) in our analyses. A recent study with P. rapae manipulated protein concentration and glucosinolate concentration in artificial diets and tested whether diet quality of the parents affected growth or development of their offspring (Rotem et al. 2003). Dietary protein concentration during parental development affected egg size and early larval growth rates (first to second instar) in their offspring, but had no effects on later offspring growth or development
FIG. 5. Eigenfunctions (EF) from the principal components analysis of the G function in Figure 3. The loadings for the first three eigenfunctions are given.
(fourth or fifth instar). There were no parental effects of glucosinolate concentration on offspring growth or development. Note that our primary goal here is explore genetic variation in thermal sensitivity to growth rate, rather than in growth rate per se. To our knowledge, the most direct evaluation of parental effects on thermal sensitivity in insects is with Drosophila melanogaster (Gilchrist and Huey 2001). In this study, parents (maternal and paternal effects were not distinguished) were reared at 18, 25 or 298C, and their offspring then reared at 18, 25 or 298C. Their results showed that higher parental temperatures increased mean offspring fitness, but this effect was independent of offspring temperature. Increased offspring fitness was largely due to decreased development time. Thus, parental effects contributed to variation in offspring fitness, but not to the thermal sensitivity of offspring fitness. The precision of estimates of genetic variances and covariances is largely determined by sample size (in our breeding design by the number of full-sib families). The number of families in our study (90) is large compared with most studies of natural (nondomesticated) animal populations, with the exceptions of Drosophila and laboratory mice. Nonetheless, the standard errors on our estimates are sizeable (Table 1). Compared with most quantitative genetic studies we used relatively large numbers of individuals per family (median 5 13) because of the inherent variability of short-term growth rate, which may be influenced by a caterpillar’s behavioral motivation, leaf food quality, and other factors. This variability will increase phenotypic variances and covariances, and will decrease estimates of heritability. In our analyses we have emphasized patterns of genetic variances and covariances rather than heritabilities and genetic correlations. Our studies used measurements of growth rate (mass increase) over short-term (2–12 h) time periods rather than chronic exposure to constant temperatures. We believe that short-term measurements more accurately reflect conditions
VARIATION IN CONTINUOUS REACTION NORMS
in natural field conditions where individuals routinely experience body temperatures ranging over 208C during a single diurnal cycle (Kingsolver 2000). Indeed, chronic exposure to constant temperatures may have quite different effects on growth and survival than short-term exposure. For example, in P. rapae, mean short-term (2–6 h) growth rate is greatest at 358C (Fig. 1; see also Kingsolver 2000), but longer exposure (.48 h) at 358C yields negative growth rates and increased mortality (J. G. Kingsolver and J. G. Shlichta, unpubl. data). We note that at these short-time scales, our index of growth rate (net mass increase per time) may reflect processes in addition to accumulation of new tissue, including transient changes in ingestion, water balance, and gut volume that are averaged over longer time scales. However, because the caterpillars in our study were from a single population and were feeding on a single host plant cultivar, we believe that short-term mass increase is tightly associated with tissue accumulation, and is thus an appropriate index of growth rate in this system. The experimental design used in these experiments involved repeated measurements of short-term growth rate for each individual at a series of temperatures, with the same order of temperatures for every individual in a study. We did not randomly order temperatures for three reasons. First, during development (and in nature) the caterpillars consistently experienced higher temperatures for shorter time periods during daytime and lower temperatures for longer periods during nighttime. Our design preserves this pattern, whereas random ordering would not. Second, the lowest (88C) and the highest (408C) temperatures considered may be stressful; for example, exposure of P. rapae caterpillars to 408C can induce increased Hsp70 expression (J. G. Kingsolver and K. Massie, unpubl. data). Because exposure to stressful temperatures could affect subsequent growth, measurements at these temperatures were always done last, and 358C was always next to last. We are unaware of evidence for any insect that shortterm exposure to nonstressful temperatures affects subsequent growth. Third, to avoid confounding growth (i.e., mass increase) responses from developmental responses (e.g. molting), we restrict our measurements to a 48-h period with a single larval instar. The combination of these constraints precluded random ordering. An alternative design would be to measure each individual at only a single (randomly assigned) temperature. Such a design would not only increase the number of individuals required by sixfold, but would also inflate the sampling error, because the only information available for estimating genetic covariances would come from measurement on different (genetically related) individuals (Meyer 1991). One important limitation of our design is that temperature effects are potentially confounded with time, age, and size. However, recall that our measurements were completed during a 48-h period within the fourth larval instar, starting with newly molted individuals in a restricted range of initial mass (see Materials and Methods). Previous data for this population shows that the thermal sensitivity of short-term growth rate is very similar for fourth and for fifth instar caterpillars (see Kingsolver 2000; Fig. 1). In addition, our analyses used size-corrected residuals to eliminate effects of size in our estimates of quantitative genetic parameters.
1527
Patterns of Genetic Variation The effects of temperature on mean short-term growth rate were similar to those documented in previous studies with P. rapae (Chen and Su 1982; Gilbert 1984; Kingsolver 2000). Mean growth rate increased with increasing temperatures from 8 to 358C, is highest near 358C, and declined at temperatures above 358C. However, there was substantial variation among families in the shape and position of their thermal performance curves (Fig. 2). Estimates of broad-sense genetic variance indicate that genetic variance in short-term growth rate increased with increasing temperature (Table 1; Fig. 3). Although the genetic analyses used size-corrected residuals (such that the mean value at each temperature is zero), this pattern of genetic variation may result largely from the increasing mean growth rate with temperature. For example, mean growth rate was four to 19-fold greater at 35–408C than at 8–118C, whereas genetic variances were 30–60-fold greater at 35–408C than at 8–118C. Increased genetic variation at higher temperatures is also seen in several other studies of thermal performance curves (Gilchrist 1996; Herron 1996), including our preliminary analyses for P. rapae (Kingsolver et al. 2001). (We note that our previous, independent studies with P. rapae involved many fewer families [,25], fewer and a narrower range of temperatures [11–358C], and did not use REML estimation methods, so that assessing goodness of fit was not possible.) This pattern may also be the result of increased behavioral or physiological variability or the asymmetric nature of thermal performance curves. Regardless of the causes, greater genetic variation in performance traits at higher temperatures could lead to greater evolutionary responses to selection in performance at higher than lower temperatures, causing evolutionary changes in the shape of the mean performance curve. Genetic Architecture of G Most off-diagonal elements of the broad-sense geneticcovariance matrix (Table 1)—that is, the genetic covariances of growth rate at different temperatures—were relatively small in magnitude, at least within the resolution of our estimates. The one notable exception is the large, negative genetic covariance between growth rate at 35 and 408C (genetic correlation 5 20.59). This pattern is also seen in the principal components analysis (Fig. 4) in which the first eigenvector (explaining 59% of total genetic variance) is dominated by a positive loading for growth rate at 358C and a negative loading at 408C. This result, also seen in a smaller, independent study with P. rapae (J. G. Kingsolver, J. G. Shlichta, G. Ragland, and K. Massie, unpubl. data), indicates a genetic trade-off for growth rate at 358C and growth rate at 408C. Several other studies have detected genetic trade-offs in performance at different temperatures (Gilchrist 1996; Herron 1996). Because the mean performance curve for the population was greatest at 358C and declined at 408C, the negative genetic correlation of growth rate at 35 and 408C might appear to support a specialist-generalist trade-off between growth rate at optimal temperatures and growth rate at extreme high temperatures (Fig. 1). However, pairwise genetic covariances
1528
JOEL G. KINGSOLVER ET AL.
between any pair of temperatures may be generated by either hotter-colder or by generalist-specialist patterns of variation (Fig. 1); thus, the negative correlation between growth rate at 35 and 408C could also be caused by variation in the location of the optimum. Recent theoretical analyses suggest that standard principal component analyses (either discrete or continuous) cannot distinguish between these two patterns of variation and that new methods that account for the nonlinear nature of thermal performance curves are required (R. Izem, J. S. Marron, and J. G. Kingsolver, unpubl. data). The second eigenvector (Fig. 4), accounting for 19% of the total genetic variation, has positive loadings for all temperatures from 17 to 408C, and small loadings at 8–118C. This pattern of loadings is qualitatively consistent with the faster-slower hypothesis (Fig. 1, middle), supporting the notion that there is some genetic variation in overall growth rate regardless of temperature in this system (Kingsolver et al. 2001). This could arise as a result of genetic variation in feeding, digestive, assimilation, or metabolic efficiency acting at all temperatures (Slansky 1993; Slansky and Feeny 1977). Multivariate and Function-Valued Approaches to Performance Curves The standard multivariate approach to analyzing reaction norms treats growth rate at each test temperature as a distinct (but potentially correlated) trait. This ignores the fact that a performance curve is a continuous function, and does not take into account the order or intervals between the test temperatures. Kirkpatrick and colleagues (Kirkpatrick and Lofsvold 1992; Kirkpatrick and Heckman 1989; Gomulkiewicz and Kirkpatrick 1992) have demonstrated theoretically some of the problems with discrete methods as applied to functionvalued traits. However, the relative merits of discrete versus function-valued analyses for reaction norms have not been previously investigated. Both the G matrix (Table 1) and G function (Fig. 3) showed increased genetic variance in growth rate with increasing temperature, and negative genetic covariance between growth rate at 358C and at 408C. The best model for the G function included the full-fit (seventh degree polynomial), presumably because of the strong negative covariance between the highest two test temperatures (35 and 408C). However, the estimated G function showed a striking bumpiness, with alternating positive and negative covariance values across much of the function. Because methods for placing support or confidence limits on estimated G functions are not currently available (Meyer and Hill 1997; Meyer 1998), we cannot evaluate how informative these bumps are. An important point is that Legendre polynomials are used as the basis functions in current function-valued methods (Kirkpatrick and Heckman 1989; Meyer 1998). Although they are flexible and straightforward to compute, fitting of such orthogonal polynomials can cause artifacts when there are strong high-dimensional signals. Of particular concern here is that fitting the strong negative covariance between growth rates at 35 and 408C may be generating bumps in the G function at other temperatures. The eigenfunctions of the G function (Fig. 5), the functionvalued equivalent of principal components, also exhibited
large bumps. Each of the first two eigenfunctions accounted for a similar amount of the total genetic variation (42 and 36%, respectively), and each showed a complex pattern of positive and negative loadings that cannot be readily interpreted in terms of the proposed patterns of variation outlined in Figure 1. There are two issues here. First, the bumpiness of the eigenfunctions is a consequence of the high-degree polynomial fit of the estimated G function; as noted above this may result from the strong negative covariance of growth at 35 and 408C. Second, principal components analysis may yield ambiguous or unstable results when two or more of the principal components account for similar amounts of the variation in the data. In any case, neither the G function nor its eigenfunctions appear to provide additional useful information or insight beyond that obtained from standard multivariate analyses for this dataset. Our tentative conclusion is that for the data considered here, the function-valued analyses that we used did not improve our estimates or understanding of genetic variation in thermal performance curves compared with standard multivariate analyses. Some features of the G functions and eigenfunctions appear to be artifacts of polynomial fitting, and are difficult to interpret. By contrast, recent function-valued analyses of age-related traits, such as age-specific mortality and reproduction in Drosophila (Pletcher and Geyer 1999) and milk production in cattle (Meyer and Hill 1997), have provided important advances in improved estimation and understanding of the architecture of genetic variation in those systems. We suggest that the highly nonlinear nature of thermal performance curves (and perhaps other physiological reaction norms), relative to the coarseness of the sampling intervals (5–68C) in our data, is key here. The rapid changes in performance at higher temperatures near 35–408C in many families (Fig. 1) generate strong genetic covariances at these temperatures. The use of orthogonal polynomials as basis functions may be inappropriate when G functions have such prominent local features within narrow temperature ranges. However, the use of alternative basis functions such as bsplines, which are much superior in modeling such local features, would likely reduce these problems for estimating G functions (N. Heckman, pers. comm.). The issue is directly analogous to the use of polynomial versus cubic-spline techniques in estimating complex fitness surfaces during analyses of selection (Schluter 1988; Schluter and Nychka 1994; Brodie et al. 1995). We hope that our results may help motivate the extension of current function-valued methods to allow alternative basis functions. ACKNOWLEDGMENTS We thank K. Balitero, K. Massie, H. Swanson, M. Wehling, and especially K. Williams for their help with the lab studies and measurements; P. Carter, G. Gilchrist, R. Gomulkiewicz, N. Heckman, R. Huey, R. Izem, M. Kirkpatrick, S. Marron, P. Phillips, and an anonymous reviewer for helpful discussion and comments on the manuscript; and the Whiteley Center for the perfect setting to complete the analyses and the writing. Research was supported by National Science Foundation grants IBN-0196132 and IBN-0212798 to JGK.
VARIATION IN CONTINUOUS REACTION NORMS
LITERATURE CITED Angilletta, M. J., R. S. Wilson, C. A. Navas, and R. S. James. 2003. Trade-offs and the evolution of thermal reaction norms. Trends Ecol. Evol. 18:234–240. Brodie, E. D. I., A. J. Moore, and F. J. Janzen. 1995. Visualizing and quantifying natural selection. Trends Ecol. Evol. 10: 313–318. Casey, T. M. 1993. Effects of temperature on foraging of caterpillars. Pp. 5–28 in N. E. Stamp and T. M. Casey, eds. Caterpillars: ecological and evolutionary constraints on foraging. Chapman and Hall, New York. Chen, C. N., and W. Y. Su. 1982. Influence of temperature on development and leaf consumption of three caterpillars on cauliflower Artogeia rapae crucivora, Trichoplusia ni, Spodoptera litura. Plant Prot Bull 24:131–141. Falconer, D. S., and T. F. C. MacKay. 1996. Introduction to quantitative genetics. Longman, Essex. Gilbert, N. 1984. Control of fecundity in Pieris rapae. II. Differential effects of temperature. J. Anim. Ecol. 53:589–597. Gilchrist, G. W. 1996. A quantitative genetic analysis of thermal sensitivity in the locomotor performance curve of Aphidius ervi. Evolution 50:1560–1572. Gilchrist, G. W., and R. B. Huey. 2001. Parental and developmental temperature effects on the thermal dependence of fitness in Drosophila melanogaster. Evolution 55:209–214. Gomulkiewicz, R., and M. Kirkpatrick. 1992. Quantitative genetics and the evolution of reaction norms. Evolution 46:390–411. Herron, J. C. 1996. Genetic variation, thermal sensitivity, and thermal acclimation in Volvox aureus and Volvox globator. P. 131. Department of Zoology, University of Washington, Seattle, WA. Huey, R. B., and J. G. Kingsolver. 1989. Evolution of thermal sensitivity of ectotherm performance. Trends Ecol. Evol. 4: 131–135. Huey, R. B., and R. D. Stevenson. 1979. Integrating thermal physiology and ecology of ectotherms: a discussion of approaches. Am. Zool. 19:357–366. Kingsolver, J. G. 2000. Feeding, growth and the thermal environment of cabbage white caterpillars, Pieris rapae L. Physiol. Biochem. Zool. 73:621–628. Kingsolver, J. G., R. Gomulkiewicz, and P. A. Carter. 2001. Variation, selection and evolution of function-valued traits. Genetica 112/113:87–104. Kirkpatrick, M., and N. Heckman. 1989. A quantitative genetic model for growth, shape, reaction norms, and other infinitedimensional characters. J. Math. Biol. 27:429–450. Kirkpatrick, M., and D. Lofsvold. 1992. Measuring selection and constraint in the evolution of growth. Evolution 46:954–971. Kirkpatrick, M., D. Lofsvold, and M. Bulmer. 1990. Analysis of the inheritance, selection and evolution of growth trajectories. Genetics 124:979–993. Mauricio, R., and M. D. Bowers. 1990. Do caterpillars disperse their damage?: Larval foraging behaviour of two specialist herbivores, Euphydryas phaeton (Nymphalidae) and Pieris rapae (Pieridae). Ecol. Entomol. 15:153–161. Meyer, K. 1991. Estimating variances and covariances for multivariate animal models by restricted maximum likelihood. Genet. Sel. Evol. 23:67–83. ———. 1998. Estimating covariance functions for longitudinal data using a random regression model. Genet. Sel. Evol. 30:221–240.
1529
Meyer, K., and W. G. Hill. 1997. Estimation of genetic and phenotypic covariance functions for longitudinal or repeated records by restricted maximum likelihood. Livestock Production Sci. 47: 185–200. Meyer, K., and S. P. Smith. 1996. Restricted maximum likelihood estimation for animal models using derivatives of the likelihood. Genet. Sel. Evol. 28:23–49. Mousseau, T. A., and C. W. Fox. 1998. The adaptive significance of maternal effects. Trends Ecol. Evol. 13:403–407. Pletcher, S. D., and C. J. Geyer. 1999. The genetic analysis of agedependent traits: modeling the character process. Genetics 151: 825–835. Rossiter, M. C. 1996. Incidence and consequences of inherited environmental effects. Annu. Rev. Ecol. Syst. 27:451–476. Rotem, K., A. A. Agrawal, and L. Kott. 2003. Parental effects in Pieris rapae in response to variation in food quality: adaptive plasticity across generations? Ecol. Entomol. 28:211–218. Scheiner, S. M. 1993. Genetics and evolution of phenotypic plasticity. Annu. Rev. Ecol. Syst. 24:25–68. Schlichting, C. D., and M. Pigliucci. 1998. Phenotypic evolution: a reaction norm perspective. Sinauer Associates, Sunderland, MA. Schluter, D. 1988. Estimating the form of natural selection on a quantitative trait. Evolution 42:849–861. Schluter, D., and D. Nychka. 1994. Exploring fitness surfaces. Am. Nat. 143:597–616. Shaw, R. G. 1987. Maximum-likelihood approaches applied to quantitative genetics of natural populations. Evolution 41: 812–826. Slansky, F. J. 1993. Nutritional ecology: the fundamental quest for nutrients. Pp. 29–91 in N. E. Stamp and T. M. Casey, eds. Caterpillars: ecological and evolutionary constraints on foraging. Chapman and Hall, New York. Slansky, F. J., and P. Feeny. 1977. Stabilization of the rate of nitrogen accumulation by larvae of the cabbage butterfly on wild and cultivated food plants. Ecol. Monogr. 47:209–228. Stearns, S. C. 1989. The evolutionary significance of phenotypic plasticity. BioScience 39:436–445. Van Driesche, R. G. 1988. Survivorship patterns of larvae of Pieris rapae (L.) (Lepidoptera: Pieridae) in Massachusetts kale, with special reference to mortality due to Apanteles glomeratus (L.) (Hymenoptera: Braconidae). Bull. Entomol. Res. 78:397–405. Vawter, A. T. 1977. Ecological genetics of the European cabbage butterfly, Pieris rapae, in North America. Ph.D. diss. Department of Biology. Cornell University, Ithaca, NY. Via, S., and R. Lande. 1985. Genotype-environment interaction and the evolution of phenotypic plasticity. Evolution 39:505–522. Wedell, N., and P. A. Cook. 1998. Determinants of paternity in a butterfly. Proc. R. Soc. Lond. B 265:625–630. ———. 1999a. Butterflies tailor their ejaculate in response to sperm competition risk and intensity. Proc. R. Soc. Lond. B 266: 1033–1039. ———. 1999b. Strategic sperm allocation in the small white butterfly Pieris rapae. Funct. Ecol. 13:85–93. Wiklund, C., B. Karlsson, and O. Leimar. 2001. Sexual conflict and cooperation in butterfly reproduction: a comparative study of polyandry and female fitness. Proc. R. Soc. of Lond. B 268: 1661–1667. Corresponding Editor: P. Phillips