RADAR TARGET TYPE CLASSIFICATION AND VALIDATION Prabu Dheenathayalan and Ramon Hanssen Delft University of Technology, Delft, The Netherlands (
[email protected]) ABSTRACT
the launch of high-resolution satellites such as TerraSAR-X, COSMO-SkyMed, TanDEM-X, and Radarsat-2, the PS spatial sampling has improved considerably especially in urban environments, and it is now feasible to monitor single buildings or even parts of buildings from space with millimeteric accuracy. However, the main limitation is in our understanding where these radar reflections stem from, which real world object is exactly deforming, and with respect to what. We propose that this limitation can be solved in two phases: (i) target classification - associating radar reflections to real-world objects [8, 3], and (ii) deformation classification - comparing and/or grouping deformation from different real-world objects to further characterize the estimated deformation signal [3]. Various types of information such as height estimated from PSI, size of scatterer estimated from amplitude scattering pattern variation over various incidence and squint angles, and scattering type estimated from polarimetric information can be combined to perform this classification [8, 3]. However, due to the limited variation in the baseline distribution (orbital tube) from ERS 1/2, Envisat, TerraSAR-X to Sentinel, target size estimation is difficult. Sparse availability of full polarimetric data further limits the use of scattering type estimations in the classification process. In addition, the analysis by [2] shows that the height is key information to discriminate scatterers from-and-above the ground surface. Due to the above reasons only the estimated height is exploited in our method to perform target type classification. Once a target is classified then deformation type classification can be performed to understand in detail the underlying deformation phenomena. A discussion related to deformation type classification can be found in [3, 2].
The main challenge in analyzing the results of persistent scatterer techniques is to associate each coherent radar reflection to a real-world object, referred to as target type classification. In recent years different methods to perform target type classification were studied. In this paper we propose a height-based target type classification method to discriminate radar reflections emanating from the ground and above-ground objects. Data acquired from multiple spaceborne satellites such as ERS, Envisat, and TerraSAR-X covering Amsterdam, the Netherlands spanning over two decades from 1992 to 2012 are processed. The target classification results are validated with highly precise elevation data obtained from an independent airborne laser altimetry technique. In this paper we demonstrate that our target type classification method is accurate and thereby the generated DEM of the ground is of nearly sub-metric accuracy in case of ERS and Envisat, and TerraSAR-X. Index Terms— PSI, Target type classification, Validation, DEM, Urban infrastructure monitoring, Mapping of urban areas. 1. INTRODUCTION Numerous applications will emerge when real world objects can be identified in satellite radar data, and when the estimated deformation is associated to a specific real world object. One such application is to estimate relative surface motion (building versus ground, building versus building, or ground versus ground) in an urban environment. This relative surface motion estimation can be used as one of the metrics to identify potentially unsafe urban infrastructures or zones and alert respective stakeholders. For example, to detect relative surface motion, reflections from the ground, and above ground objects (such as buildings and other structures) have to be separated [2, 7]. Persistent Scatterer Interferometry (PSI) is a singlemaster interferometric stack approach to estimate the Line of Sight (LOS) deformation and height of phase coherent pixels known as Persistent Scatterers (PS) [4]. These coherent pixels are a random subset of image pixels usually but not necessarily man-made objects such as buildings, facades, bridges, lamp posts, roof-tops, highway barriers, dikes, etc. With
978-1-4799-1114-1/13/$31.00 ©2013 IEEE
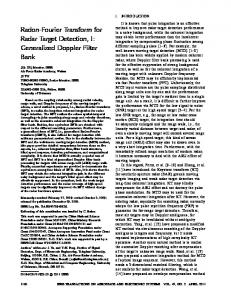
2. METHOD A stack of Single Look Complex (SLC) images are processed by PSI [4, 6] to estimate parameters such as deformation and height relative to a reference point for each of these PS. Estimated height and their standard deviations are considered the preliminary inputs to our target classification. Our height based target type classification method is shown in Fig. 1. The method is divided into five main steps. Steps I, III and V perform classification, while steps II and IV refine the ground height estimation by kriging. The classification step is performed iteratively. During first iteration, a circular re-
923
IGARSS 2013
Fig. 1: Target type classification method based on PS heights gion R around a point of interest is selected. The radius of the circular region R is adaptively scaled based on the PS spatial density and the nature of the terrain. For example, the radius of region R is increased gradually until there is a sufficient number of points to determine the ground height. If the given area has significant topography, the maximum value for the radius of circular region R is limited. During the first iteration, we assume all the points selected in region R are from the ground surface. Now, from all the points selected in region R the local ground height at the location of the point of interest is interpolated using Best Linear Unbiased Estimation (BLUE) [9]. Hypothesis testing is conducted to see if the height of point of interest is significantly different from the interpolated value. Based on outcome of this hypothesis testing, the point of interest is classified as either ground type or elevated type. This procedure is repeated for all the PS points in the area of interest. Hence, we know the target class type for all the PS. Now, we iterate this procedure to re-assign the class type, but during the subsequent iterations, PS that are of the ground class type are selected for local ground height interpolation. These iterations can be continued until there are no significant changes in either target class type or local terrain height interpolated. Steps II to IV are introduced to perform a refined spatial smoothing to remove outliers from classification and obtain a better estimate of the local topography. To eliminate the impact of the terrain, the local ground topography estimated from step IV is removed from the PS heights, and the classification is performed again in step V. In the end the method yields two key outcomes. First, the target type which helps us in understanding where the reflections come from and what is deforming. Second, as a result of classification, an estimate of the local ground height or Digital Elevation Model (DEM) of the terrain.
(a) Height map showing the build- (b) Height map showing a random ing points being distributed in five distribution of buildings and ground building groups viz. left top, right points. top, right bottom, left bottom and center. Ground points are distributed in the space between these building groups.
Fig. 2: A scenario of simulation for (a) grouped and (b) random distribution of building and ground points. Points on building and ground are marked as squares and circles respectively. Color represents the height of the simulated points in metres.
(a) Classification results for simula- (b) Classification results for simulation of grouped distribution of points tion of random distribution of points
Fig. 3: Target classification results for (a) grouped and (b) random distribution of building and ground points. Shown are the results of target classification for different building profiles (1 to 5) and percentages of points on ground versus building. tain point density. Hence these two distinct spatial distributions of building and ground points (grouped (Fig. 2a), and random (Fig. 2b)) are simulated. Each marker (square or circle) in Fig.2a and Fig. 2b represents a PS point. Each square marker represents a PS on a building and each circle represents a PS lying on a ground. For each spatial distribution, the simulation is repeated for different building heights, which is achieved through five building (height) profiles. The term building profile refers to height of all building points distributed in either grouped or random pattern. For example, building profile 2 is obtained by adding a constant height increment to all building points in building profile 1. Similarly, building profiles 3 to 5 are obtained such that the heights of building points are increased in the following order: Building profile 1 < Building profile 2 < Building profile 3