veterinarian; Oregon State University. Each calf should receive 8 to. 10 percent of its body weight, about. 1 gallon, of colostrum in the first. 24 hours. Feed it from ...
AN ABSTRACT OF THE THESIS OF Vikas Vikram for the degree of Master of Science in Forest Science presented on December 5, 2008. Title: Stiffness of Douglas-fir Lumber: Effects of Wood Properties and Genetics. Abstract approved: _____________________________________________________________________ Glenn T. Howe
Wood stiffness is one of the most important properties of lumber and veneer. We studied wood stiffness (modulus of elasticity, MOE), wood density, microfibril angle, and knots in a 25 year-old wind-pollinated progeny test (50 families, ~ 373 trees) of coastal Douglas-fir to understand the potential for genetically improving wood stiffness. We measured the stress wave MOE of standing trees (MOEST) and logs (MOEHM) using field-based tools (ST300 and HM200) that measure stress wave velocity. We then milled the logs into 2x4s to obtain direct estimates of MOE using bending tests (MOEbl) and indirect estimates using transverse vibration (MOEtv) and stress wave (MOEsw) techniques. On basal wood disks, we measured green (DENgd) and dry (DENdd) wood density; on 2x4s, we measured lumber density (DENdl), sizes of the largest edge (KNTedg) and center knots (KNTcnt), number of knots (KNTtot), and lumber grade; and on small clearwood samples, we measured dry density (DENsc), as well as MOE (MOEsc) and microfibril angle (MFAsc) using the SilviScan system. MOEbl had moderate to strong phenotypic (rp) and additive genetic (ra) correlations with MOEHM, MOEST, MOEtv, and MOEsw (rp = 0.45 to 0.91; ra = 0.57 to 1.03) suggesting that the HM200 and ST300 tools
can be used to genetically improve bending stiffness. MOEbl had moderate to strong genetic correlations with DENdl and DENdd (ra = 0.37 to 0.91), and weak correlations with KNTedg and KNTtot (ra = -0.24 and 0.22). MOEbl had a strong phenotypic correlation with DENsc (rp = 0.72) and moderate negative correlation with MFAsc (rp = -0.42). Together, DENdl, MFAsc, and KNTedg explained 49% to 62% of the variance in 2x4 MOEbl, MOEtv, and MOEsw. Compared to MFAsc and KNTedg, path analysis suggested that density had the strongest direct effect on MOEbl. Nonetheless, because density is negatively correlated with growth, and because field-based stress wave tools are now available, there is no great need to measure wood density or MFA to improve wood stiffness. Because the phenotypic and genetic correlations between knot traits and bending MOE are either weak or nonsignificant, knot traits do not seem to be important to include in breeding programs for structural lumber. The STR lumber grade had a higher MOEbl and lower KNTedg than either the S1 or S2 grades.
© Copyright by Vikas Vikram December 5, 2008 All Rights Reserved
Stiffness of Douglas-fir Lumber: Effects of Wood Properties and Genetics
by Vikas Vikram
A THESIS submitted to Oregon State University
in partial fulfillment of the requirements for the degree of Master of Science
Presented December 5, 2008 Commencement June, 2009
Master of Science thesis of Vikas Vikram presented on December 5, 2008.
APPROVED: _____________________________________________________________________ Major Professor, representing Forest Ecosystems and Society _____________________________________________________________________ Head of the Department of Forest Ecosystems and Society _____________________________________________________________________ Dean of the Graduate School
I understand that my thesis will become part of the permanent collection of Oregon State University libraries. My signature below authorizes release of my thesis to any reader upon request. _____________________________________________________________________ Vikas Vikram, Author
ACKNOWLEDGEMENTS This thesis work could be completed only with the help of many people with whom I interacted during my stay at Corvallis. First and foremost I acknowledge the tutelage provided by my major advisor, Dr. Glenn T. Howe, who has helped me during various phases of this research project and my academic life at the Oregon State University. I express my sincere gratitude to the members of my graduate committee, Dr. Doug Maguire and Dr. Mike Milota for the continuous support and encouragement they provided for the completion of my research work. I would also like to thank Dr. Rob Evans, CSIRO, Australia for helping me to get SilviScan data on my wood samples.
Thanks are due to Dr. Marilyn Cherry who provided a motivating environment to work and helped with various aspects of my fieldwork and data analyses. I thank Dana Howe for helping me in fieldwork. Dan Cress and staff members of Olympic Resource Management provided assistance with various field aspects of this project. Milo Clauson helped me to setup most of my laboratory-based experiments. Glenn Holloway and Donald A DeVisser form West Coast Lumber Inspection Bureau helped us to visually grade all the boards.
I thank Nick Augsburger, Brooke Morris, and David Griffith for helping me to collect data. The support and amity provided by my friends Dana Howe, Dr. James Kathilankal, Dr. Sudeep Perumbakkam, Dr. Anand Paul Mangalam, Kathy Wanvomer, and Eric Dinger require special mention.
This study was funded by Pacific Northwest Tree Improvement Research Cooperative. The financial support I received from the PNWTIRC is appreciated at the highest degree. I received additional support from Henry and Mildred Fowells Fellowship. I greatly cherish the opportunity and infrastructure provided by the Department of Forest Science and the Oregon State University.
Lastly, I thank my mom, dad, brother, and family members for your encouragement, prayers, and love as I strive towards my dreams.
TABLE OF CONTENTS Page AN ABSTRACT OF THE THESIS OF ............................................................................. 1 Title: Stiffness of Douglas-fir Lumber: Effects of Wood Properties and Genetics. ........... 1 Glenn T. Howe .................................................................................................................... 1 Stiffness of Douglas-fir Lumber: Effects of ....................................................................... 4 A THESIS ........................................................................................................................... 4 Oregon State University...................................................................................................... 4 Master of Science................................................................................................................ 4 Presented December 5, 2008 .............................................................................................. 4 APPROVED: ...................................................................................................................... 5 Major Professor, representing Forest Ecosystems and Society .......................................... 5 Head of the Department of Forest Ecosystems and Society ............................................... 5 Dean of the Graduate School .............................................................................................. 5 Vikas Vikram, Author......................................................................................................... 5 ACKNOWLEDGEMENTS ................................................................................................ 6 LIST OF FIGURES .......................................................................................................... 10 LIST OF TABLES .............................................................................................................. 1 Stiffness of Douglas-fir lumber: Effects of wood properties and genetics ................... 1 1. Introduction ..................................................................................................................... 1 2. Materials and Methods.................................................................................................... 8 2.1. Plant materials .......................................................................................................... 8 2.2. Field measurements ............................................................................................... 10 2.3. Wood properties of trees ........................................................................................ 11 2.4. Log milling............................................................................................................. 12 2.5. Wood properties of lumber and logs...................................................................... 12 2.6. Wood properties of small clearwood samples ....................................................... 16 2.7. Lumber grading ...................................................................................................... 17 2.8. Statistical analyses ................................................................................................. 17 2.8.1. Phenotypic relationships among wood properties.......................................... 18 2.8.2. Genetics of wood properties ........................................................................... 18 2.8.3. Phenotypic relationships between wood properties of small clearwood samples...................................................................................................................... 20 2.8.4. Differences between lumber grades ................................................................ 21 3. Results ........................................................................................................................... 22 3.1. Direct and indirect tests yielded different estimates of wood stiffness ................. 22 3.2. Phenotypic correlations between bending stiffness and indirect estimates of wood stiffness ......................................................................................................................... 26 3.3. Wood stiffness is phenotypically correlated with wood density, MFA, and knots 31 3.4. Combined effects of density, MFA, and knots ...................................................... 38 3.5. Effects of ring age and ring orientation on bending stiffness, density, and knots . 40 Ring orientation .............................................................................................................. 42 3.6. Bending MOE and knots, but not density were associated with lumber grade ..... 44 3.7. Stiffness and density are heritable ......................................................................... 44
9 3.8. Genetic correlations between stiffness traits and density ...................................... 48 3.9. Genetic control of knots ......................................................................................... 48 4. Discussion ..................................................................................................................... 52 4.1. Direct and indirect tests yielded different estimates of wood stiffness ................. 52 4.2. Phenotypic correlations between bending stiffness and indirect estimates of wood stiffness ......................................................................................................................... 54 4.3. Wood stiffness is phenotypically correlated with wood density, MFA, and knots 55 4.3.1. Correlations between bending stiffness and wood density ............................. 56 4.3.2. MFA was negatively correlated with stiffness ................................................ 57 4.3.3. Knots were weakly correlated with stiffness ................................................... 59 4.4. Combined effects of density, MFA, and knots ...................................................... 60 4.5. Use of SilviScan for Douglas-fir tree improvement .............................................. 61 4.6. Effects of ring age and ring orientation on wood stiffness and density ................. 61 4.7. Bending MOE and knots, but not density, were associated with lumber grade .... 63 4.8. Genetics of Douglas-fir wood quality .................................................................... 64 4.9. Conclusions ............................................................................................................ 66 Bibliography ..................................................................................................................... 68 Appendix ........................................................................................................................... 76 A1: Estimation of MOEtv ............................................................................................... 76 The SAS code used to arrive this equation is given below:.............................................. 76 Extraction of transverse vibration moe ; .......................................... 76 HOW “(11.8125*moeec)/(w*t**3)” ?? ........................................................... 76 After accounting for constants Ecomputer MOE depends on, .... 77 E= constant/ w thickness^3 ............................................................................ 77 MOE of a particular board of given dimensions is ....................... 77 A2: Estimation of MOEsw ............................................................................................... 77 The SAS code used to arrive this equation is given below: (MOEsw = v2d/g) .................. 77 Extraction of stresswave moe from weight and time; .................. 77
LIST OF FIGURES Figure
Page
1. Ring orientation classes of the 2x4s relative to the applied load used to measure bending MOE…………………………………………………………………...
13
2. Relationships between static bending MOE (MOEbl) and other measures of wood stiffness measured on 2x4s from a 25-year-old Douglas-fir progeny test.
29
3. Relationships between static bending MOE (MOEbl) and densities measured on 2x4s and disks from a 25-year-old Douglas-fir progeny test. …………………
33
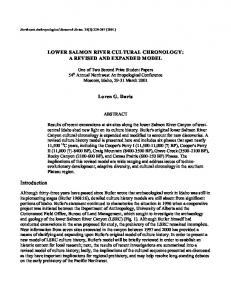
4. Relationships between static bending MOE (MOEbl) and knot traits measured on 2x4s from a 25-year-old Douglas-fir progeny test..........................................
37
5. Path diagram showing the relationships between selected wood properties (DENdl, DENsc, MFAsc, and KNTedg) versus direct and indirect measures of stiffness of 2x4s harvested from a 25-year-old Douglas-fir progeny test............
39
6. Relationships between static bending MOE (MOEbl) and lumber density (DENdl) versus ring age (RA) of 2x4s from a 25-year-old Douglas-fir progeny test. …………………………………………………………………………….
41
7. Relationships between ring orientation versus static bending MOE (MOEbl) and ring age (RA) of 2x4s from a 25-year-old Douglas-fir progeny test. …………
42
8. Relationships between lumber grade and wood properties of 2x4s from a 25-year-old Douglas-fir progeny test...................................................................
45
LIST OF TABLES Table
Page
1. Wood properties of trees from a 25-year-old wind-pollinated progeny test of Douglas fir………………………………………………………………….......
9
2. Wood properties of Douglas-fir 2x4s harvested from a 25-year-old windpollinated progeny test of Douglas-fir………………………………………….
23
3. Wood properties of Douglas-fir butt logs (2.7 m long) harvested from a 25-yearold wind-pollinated progeny test of Douglas-fir. Log values were derived from the corresponding values measured on 2x4s……………………………...
24
4. Phenotypic correlations between laboratory measures of wood properties of 2x4s (above the diagonal) and butt logs (below the diagonal) harvested from a 25-year-old wind-pollinated progeny test of Douglas-fir. All traits were measured on individual 2x4s, and log values were derived from the corresponding values measured on 2x4s……………………………………….
28
5. Phenotypic correlations between wood properties of butt logs harvested from a 25 year-old wind-pollinated progeny test of Douglas-fir.
30
6. Wood properties of a subset of 2x4s and small clearwood samples harvested from a 25-year-old wind-pollinated progeny test of Douglas-fir………………
32
7. Phenotypic correlations between wood properties of 2x4s and small clearwood samples harvested from a 25 year-old wind-pollinated progeny test of Douglas-fir (n = 56-58)……………………………………………………........
35
8. Covariance parameter estimates for ring age (RA) and ring orientation (RO) in the analyses of MOEbl, MOEpca, and DENdl of lumber harvested from a 25year-old wind pollinated progeny test of Douglas-fir (standard errors are given in parentheses)……………………………………………….............................
43
9. Variance components, individual-tree narrow-sense heritabilities (hi2), and standard errors of heritabilities (SE) for Douglas-fir wood properties and growth in a 25-year-old wind-pollinated progeny test of Douglas-fir………….
46
10. Narrow-sense genetic (rA), error (rE), and phenotypic (rP) correlations between stiffness and velocity traits of butt logs harvested from a 25-year-old windpollinated progeny test of Douglas-fir (standard errors are given in parentheses)…………………………………………………………………….
49
11. Narrow-sense genetic (rA), error (rE), and phenotypic (rP) correlations between stiffness, density, and growth traits of butt logs harvested from a 25-year-old wind-pollinated progeny test of Douglas-fir (standard errors are given in parentheses)………………………………………………………….................
50
12. Narrow-sense genetic (rA), error (rE), and phenotypic (rP) correlations between stiffness and knot traits of butt logs harvested from a 25-year-old wind-pollinated progeny test of Douglas-fir (standard errors are given in parentheses)…………………………………………………………………….
51
Stiffness of Douglas-fir lumber: Effects of wood properties and genetics 1. Introduction Douglas-fir (Pseudotsuga menziesii (Mirb.) Franco) is one of the principal lumber species in the Pacific Northwest because it is widely distributed, grows fast, and has excellent wood quality. Douglas-fir is widely used to make structural lumber, plywood, laminated veneer lumber (LVL), poles, and pilings because its wood is strong, stiff, highly workable, and dimensionally stable (Bormann 1984). Nonetheless, the quality of Douglas-fir wood products may decline because rotations are becoming shorter ( 0.05; Table 4, Fig. 4). MOEtv, MOEsw, and MOEpca were also weakly correlated with the presence of knots at both the
36 log and lumber levels (Table 4). The correlations between stiffness and knot traits at the log level were similar to those at lumber level (Table 4, below the diagonal).
37 18
A. KNTedg 16 14 12 10 8
r = -0.21 R2 = 0.04
6 0
10
20
30
40
50
Static Bending MOE (GPa)
Size of edge knots (mm) 18
B. KNTcnt
r = 0.11 R2 = 0.01
16 14 12 10 8 6 0
10
20
30
40
Size of center knots (mm) 18
C. KNTtot
r = 0.02 R2 = 0.0004
16 14 12 10 8 6 0
5
10
15
20
25
Number of knots
Fig. 4. Relationships between static bending MOE (MOEbl) and knot traits measured on 2x4s harvested from a 25-year-old Douglas-fir progeny test. A. KNTedg is the diameter of the largest edge knot. B. KNTcnt is the diameter of the largest center knot. C. KNTtot is the total number of knots greater than 12.7 mm.
38
3.4. Combined effects of density, MFA, and knots
Together, density (DENdl or DENsc), MFAsc, and KNTedg explained 49% to 62% of the variance in 2x4 MOEbl, MOEtv, and MOEsw (Fig. 5). The path coefficients suggest that density (DENdl or DENsc) had a much greater direct effect on MOE than did MFAsc or KNTedg (Fig. 5). The path coefficients between MFAsc and MOEbl (-0.16 to -0.19) were considerably weaker than the path coefficients between MFAsc and either MOEtv or MOEsw (-0.24 to -0.35). In the lumber subset (i.e., 2x4s from which small clearwood samples were collected), KNTedg had no significant correlation with MOEbl, MOEtv, or MOEsw (p > 0.05; Table 7), but it did have weak negative correlations with these stiffness traits in the full lumber dataset (rp = -0.13 to -0.21, p < 0.0001; Table 4).
39
A.
MOEbl
0.66
R2 = 0.58
-0.19
DENdl
-0.28
-0.30 0.61 -0.35
MFAsc
0.09
MOEtv
R2 = 0.62
-0.16
0.12
0.59 -0.27
KNTedg
B.
-0.11
MOEsw
0.65
MOEbl
R2 = 0.49 R2 = 0.54
-0.16
DENsc
-0.19
-0.36 0.58 -0.05
-0.33
MFAsc
MOEtv
R2 = 0.54
-0.08
0.12
0.60 -0.24
KNTedg -0.03
MOEsw
R2 = 0.50
Fig. 5. Path diagram showing the relationships between selected wood properties (DENdl, DENsc, MFAsc, and KNTedg) versus direct and indirect measures of stiffness of 2x4s harvested from a 25-year-old Douglas-fir progeny test. All path coefficients (i.e., straight-line relationships between traits) were significant at p < 0.0001. The correlation coefficients (i.e., curved-line relationships) between density (DENdl and DENsc) versus MFAsc (-0.30 and -0.36) were significant at p < 0.02, whereas all other correlations were nonsignificant.
40
3.5. Effects of ring age and ring orientation on bending stiffness, density, and knots
On a lumber basis, MOEbl and DENdl were positively correlated with RA (rp = 0.42 and 0.23; Fig. 6). MOEbl was also higher when the load was applied tangentially to the growth rings as compared to radially or diagonally (Fig. 7). The 2x4s with tangentially or diagonally applied loads also had higher average ring ages (i.e., 9.6 and 11.7 years) compared to the 2x4s with radially applied loads (6.4 years). As expected, DENdl was unaffected by ring orientation (data not shown). Based on these results, we adjusted MOEbl and MOEpca using RA and RO as covariates (= AMOEbl and AMOEpca), and adjusted DENdl using RA as covariate (= ADENdl). These were the only statistically significant covariates in the analyses of MOEbl, MOEpca, and DENdl (Table 8).
Static bending MOE (GPa)
41
18
A. MOEbl
16 14 12 10 8
r = 0.42 R2 = 0.18
6
Lumber density (kg m-3)
0
600
5
10
15
20
B. DENdl
550 500 450 400
r = 0.23 R2 = 0.05
350 0
5
10
15
20
Ring age (Years)
Fig. 6. Relationships between static bending MOE (MOEbl) and lumber density (DENdl) versus ring age (RA) of 2x4s harvested from a 25-year-old Douglas-fir progeny test. A. MOEbl is static bending MOE of lumber. B. DENdl is dry lumber density.
18 MOEbl
16
RA
14
b
12
a
10 8
12
8 6 n = 38
n = 1067
2
14
10
a
6 4
c
b
c
16
0
4
Ring age (years)
18
n = 242
Static bending MOE (GPa)
42
2 0
R T D Ring orientation
Fig. 7. Relationships between ring orientation versus static bending MOE (MOEbl) and ring age (RA) of 2x4s harvested from a 25-year-old Douglas-fir progeny test. R is radial, T is tangential, and D is diagonal ring orientation. All differences among ring orientation classes are significant at p = 0.05 using Tukey’s HSD.
Table 8. Covariance parameter estimates for ring age (RA) and ring orientation (RO) in the analyses of MOEbl, MOEpca, and DENdl of lumber harvested from a 25-year-old wind pollinated progeny test of Douglas-fir (standard errors are given in parentheses).a
Ring orientation (RO)b Trait
Intercept
Ring age (RA)b
Rc
Tc
Dc
MOEbl
8.5134 (0.14)
0.2295 (0.01)
0.0 (nd)
0.3673 (0.08)
0.0953 (0.19)
MOEpca
9.1275 (0.16)
0.3066 (0.01)
0.0 (nd)
0.4416 (0.10)
0.1205 (0.22)
3.4672 (0.17)
ns
ns
ns
DENdl
446.20 (4.65)
a
Traits are described in Table 1. All fixed effects are significant at p < 0.0001 except where indicated by ns. nd indicates that the standard error was not determined. c Ring orientation of 2x4s in relation to bending load. b
43
3.6. Bending MOE and knots, but not density were associated with lumber grade
The lumber grades of the 2x4s differed significantly in MOEbl and KNTedg, but not in DENdl (Fig. 8). MOEbl, MOEtv, and MOEsw were higher for the STR grade followed by the S1 and S2 grades (p < 0.0001). Because we had only one 2x4 in each of the S3 and E grades, we did not include those 2x4s in these analyses. In contrast to stiffness, the largest edge knots were observed for the S2 grade, followed by the S1 and STR grades. DENdl ranged from 474.7 to 478.0 kg m-3 among the three visual grades.
3.7. Stiffness and density are heritable
MOEbl had a moderate narrow-sense individual-tree heritability (hi2 = 0.31) (Table 9). Heritabilities of MOEtv, MOEsw, and MOEpca were similar to that of MOEbl (hi2 = 0.22 to 0.38; Table 9). The heritabilities of lumber stiffness adjusted to a ring age of 9.1 years and a radial ring orientation (AMOEbl hi2 = 0.35 and AMOEpca hi2 = 0.40) were higher than the heritabilities of the unadjusted traits. DENdl and ADENdl had moderately high heritabilities (hi2 = 0.41 to 0.42), the heritabilities of Dengd and Dendd were low to moderate (hi2 = 0.14 to 0.29), and the heritabilities of other wood properties are presented in Table 9.
14
A. MOEbl a
12
b
c
10
4
n = 75
6
n = 770
8
n = 457
Static bending MOE (GPa)
16
2 0
600 500
B. Dendl a
S1
S2
a
a
400
100
n = 72
200
n = 758
300
n = 450
Lumber density (Kg m-3)
STR
0
STR
C. KNTedg
16
S2
c
b
a
4
n = 74
8
n = 766
12
n = 455
Edge knot size (mm)
20
S1
0
STR
S1
S2
Lumber grade
Fig. 8. Relationships between lumber grade and wood properties of 2x4s harvested from a 25-year-old Douglas-fir progeny test. A. MOEbl is static bending MOE. B. DENdl is dry lumber density. C. KNTedg is the diameter of the largest edge knot. Lumber grade STR is select structural, S1 is select 1, and S2 is select 2. Lumber grades marked with same letter are not statistically different from one-another at p = 0.05 using Tukey’s HSD.
Table 9. Variance components, individual-tree narrow-sense heritabilities (hi2), and standard errors of heritabilities (SE) for Douglas-fir wood properties and growth in a 25year-old wind-pollinated progeny test of Douglas-fir.
Variance componentsb Traita Stiffness (GPa) MOEbl AMOEbl MOEtv MOEsw MOEpca AMOEpca MOEHM MOEST
σ2 S
σ2F(S)
σ2R(S)
σ2R*F(S)
σ2 ε
hi2
0.00 0.00 0.02 0.00 0.00 0.00 0.00 0.13
0.15 0.18 0.16 0.05 0.25 0.27 0.16 0.18
0.19 0.14 0.15 0.06 0.25 0.18 0.18 0.45
0.18 0.05 0.26 0.19 0.21 0.00 0.00 0.00
1.13 1.27 1.03 0.45 1.47 1.74 1.32 2.30
0.31 0.35 0.33 0.22 0.38 0.40 0.33 0.22
Density (kg m-3) 39.43 DENgd DENdd 22.87 DENdl 47.59 ADENdl 53.27
205.43 59.81 140.14 144.43
400.98 160.77 26.41 22.44
0.00 0.00 51.92 22.05
1894.94 1215.14 825.60 860.17
0.29 0.14 0.41 0.42
Table 9 continued on the next page.
46
Table 9 cont. Variance components, individual-tree narrow-sense heritabilities (hi2), and standard errors of heritabilities (SE) for Douglas-fir wood properties and growth in a 25year-old wind-pollinated progeny test of Douglas-fir.
Variance componentsb Traita
σ2 S
σ2F(S)
Acoustic Velocity (m s-1) VELHM 0.00 4600.00 VELST 3485.00 4392.00
σ2R(S)
2215 4091
σ2R*F(S)
σ2 ε
hi2
0.00 0.00
31533.00 39649.00
0.38 0.30
Knots (mm, number, or score) KNTedg 0.00 0.20 KNTcnt 0.00 0.00 KNTtot 0.00 0.38 KNTpca 0.00 0.31
0.57 0.00 0.00 0.00
3.95 0.44 0.05 2.60
16.18 13.42 7.87 21.17
0.03 0.00 0.14 0.04
Diameter growth (cm) DBH25 0.20
0.00
1.50
9.66
0.13
a
0.50
Traits are described in Table 1. σ S, σ2F(S), σ2R*F(S), and σ2ε are variance components associated with Ss, F(S)sf , R*F(S)srf, and εsrfl in model 10.
b 2
47
48
3.8. Genetic correlations between stiffness traits and density
The genetic correlations between MOEbl versus MOEtv and MOEsw were higher than their respective phenotypic correlations (ra = 1.03 and 0.98; Table 10). MOEbl, MOEtv, and MOEsw were also highly correlated with AMOEbl, MOEpca, and AMOEpca. The genetic correlations between the laboratory measures of stiffness (MOEbl, MOEtv, and MOEsw) versus the field measures (MOEHM and MOEST) were moderate to strong (ra = 0.54 to 0.93; Table 10). The genetic correlation between DENdl versus MOEbl, MOEtv, and MOEsw ranged from 0.81 to 0.91. The genetic correlation between DENdd versus MOEbl, MOEtv, and MOEsw ranged from 0.37 to 0.48 (Table 11).
3.9. Genetic control of knots
KNTtot was weakly heritable (hi2 = 0.14), whereas KNTcnt and KNTedg had no significant genetic variation (Table 12). KNTtot had a favorable but weak genetic correlation with bending stiffness (Table 12).
49 Table 10. Narrow-sense genetic (rA), error (rE), and phenotypic (rP) correlations between stiffness and velocity traits of butt logs harvested from a 25-year-old wind-pollinated progeny test of Douglas-fir (standard errors are given in parentheses). Trait 1a
Trait 2
Families
Trees
rA
Direct and indirect estimates of wood stiffness MOEbl MOEtv 50 368 1.03 (0.03)
rE
rP
0.89 (0.01)
0.91 (0.00)
MOEbl
MOEsw
50
370
0.98 (0.07)
0.78 (0.02)
0.80 (0.01)
MOEbl
MOEpca
50
367
1.01 (0.01)
0.97 (0.00)
0.97 (0.00)
MOEbl
MOEHM
50
282
0.92 (0.16)
0.62 (0.04)
0.65 (0.01)
MOEbl
MOEST
50
304
0.57 (0.27)
0.44 (0.05)
0.45 (0.02)
MOEtv
MOEsw
50
369
0.99 (0.05)
0.81 (0.02)
0.83 (0.01)
MOEtv
MOEpca
50
367
1.00 (0.01)
0.96 (0.00)
0.97 (0.00)
MOEtv
MOEHM
50
279
0.93 (0.16)
0.56 (0.05)
0.59 (0.02)
MOEtv
MOEST
50
302
0.65 (0.24)
0.39 (0.05)
0.42 (0.02)
MOEsw
MOEpca
50
367
0.98 (0.05)
0.83 (0.02)
0.84 (0.01)
MOEsw
MOEHM
50
281
0.89 (0.22)
0.49 (0.05)
0.52 (0.02)
MOEsw
MOEST
50
304
0.54 (0.28)
0.33 (0.06)
0.35 (0.02)
MOEpca
MOEHM
50
278
0.91 (0.16)
0.60 (0.04)
0.63 (0.02)
MOEpca
MOEST
50
300
0.62 (0.24)
0.42 (0.05)
0.44 (0.02)
MOEHM
MOEST
50
279
0.96 (0.20)
0.55 (0.05)
0.59 (0.01)
Stiffness vs stress wave velocity MOEbl VELHM 50 338
0.75 (0.18)
0.55 (0.04)
0.57 (0.02)
a
MOEbl
VELST
50
364
0.49 (0.17)
0.33 (0.04)
0.35 (0.02)
MOEtv
VELHM
50
336
0.80 (0.17)
0.51 (0.02)
0.54 (0.01)
MOEtv
VELST
50
363
0.60 (0.14)
0.29 (0.01)
0.34 (0.01)
MOEsw
VELHM
50
338
0.67 (0.25)
0.45 (0.05)
0.47 (0.02)
MOEsw
VELST
50
365
0.51 (0.26)
0.22 (0.05)
0.25 (0.03)
MOEpca
VELHM
50
334
0.78 (0.16)
0.53 (0.04)
0.56 (0.02)
MOEpca
VELST
50
360
0.57 (0.15)
0.32 (0.04)
0.35 (0.02)
VELHM
VELST
50
335
0.96 (0.16)
0.33 (0.05)
0.41 (0.02)
Traits are described in Table 1.
50
Table 11. Narrow-sense genetic (rA), error (rE), and phenotypic (rP) correlations between stiffness, density, and growth traits of butt logs harvested from a 25-year-old wind-pollinated progeny test of Douglas-fir (standard errors are given in parentheses). Trait 1a
Trait 2
Families
Stiffness vs density of wood MOEbl DENdd 50
rA
rE
rP
307
0.37 (0.37)
0.51 (0.05)
0.50 (0.02)
MOEtv
DENdd
50
305
0.48 (0.29)
0.46 (0.05)
0.46 (0.02)
MOEsw
DENdd
50
307
0.40 (0.37)
0.41 (0.05)
0.41 (0.02)
MOEpca
DENdd
50
303
0.46 (0.29)
0.49 (0.05)
0.49 (0.02)
MOEHM
DENdd
50
280
0.47 (0.43)
0.58 (0.04)
0.57 (0.02)
MOEST
DENdd
50
303
0.50 (0.36)
0.53 (0.04)
0.52 (0.02)
MOEbl
DENdl
50
370
0.91 (0.01)
0.64 (0.03)
0.67 (0.01)
MOEtv
DENdl
50
369
0.91 (0.08)
0.68 (0.03)
0.71 (0.01)
MOEsw
DENdl
50
372
0.81 (0.13)
0.70 (0.03)
0.70 (0.01)
MOEpca
DENdl
50
367
0.88 (0.09)
0.69 (0.03)
0.71 (0.01)
MOEHM
DENdl
50
281
0.68 (0.24)
0.44 (0.05)
0.46 (0.02)
MOEST
DENdl
50
304
0.56 (0.24)
0.35 (0.05)
0.38 (0.03)
50
370
0.10 (0.40)
-0.14 (0.05)
-0.12 (0.02)
Stiffness vs growth MOEbl DBH25
a
Trees
MOEtv
DBH25
50
369
0.20 (0.04)
0.00 (0.06)
0.02 (0.02)
MOEsw
DBH25
50
371
0.57 (0.39)
0.02 (0.06)
0.06 (0.02)
MOEpca
DBH25
50
366
0.15 (0.45)
-0.09 (0.06)
-0.07 (0.02)
MOEHM
DBH25
50
282
0.61 (0.53)
-0.38 (0.06)
-0.30 (0.03)
MOEST
DBH25
50
-0.24 (0.36)
-0.32 (0.06)
-0.31 (0.03)
Traits are described in Table 1.
51
Table 12. Narrow-sense genetic (rA), error (rE), and phenotypic (rP) correlations between stiffness and knot traits of butt logs harvested from a 25-year-old wind-pollinated progeny test of Douglas-fir (standard errors are given in parentheses). Trait 1a
Families
Trees
Stiffness vs knots MOEbl KNTedg
50
371
MOEbl
KNTcnt
50
MOEbl
KNTtot
50
a
Trait 2
rA
rE
rP
0.24 (1.14)b
-0.13 (0.06)
-0.12 (0.02)
371
0.00 (0.00)b
-0.10 (0.05)
-0.09 (0.02)
371
0.22 (0.43)
-0.09 (0.06)
-0.07 (0.02)
Traits are described in Table 1. Genetic variation was not significant for trait 2.
b
52
4. Discussion 4.1. Direct and indirect tests yielded different estimates of wood stiffness
We used three techniques (static bending, transverse vibration, and stress waves) to estimate the stiffness of Douglas-fir lumber. Although the resulting estimates are highly correlated with each other, these techniques use different principles to estimate MOE. Growth ring orientation, moisture content, knots, and shear effects may differentially influence estimates of MOE obtained from these techniques (Gerhards 1975; Mack 1979, cited in Hansen et al. 2004; Gerhards 1982; Ilic 2001; Beall 2002; Wang et al. 2003; Greens and Rosales 2006). Therefore, we used PCA to combine the advantages of alternative measurement techniques and to lessen the impacts of measurement errors (i.e., by combining independent estimates of MOE). Although the resulting MOE PCA scores (MOEpca) may be superior to any of the single estimates of MOE, comparable results were obtained from analyses of MOEbl and MOEpca. Therefore, we focus our discussion on MOEbl.
On average MOEtv and MOEsw underestimated MOEbl by 10 to 35%. In other studies, differences among estimation methods were attributed to shear effects (Lindström et al. 2002; Raymond et al. 2007) and moisture content (Gerhards 1975; Wu 1999). Shear is the slippage of wood layers along the grain that occurs when wood is subjected to slowly increasing loads, such as the loads we used in our bending tests (Mack 1979, cited in Hansen et al. 2004). When this occurs, the apparent bending MOE of 2x4s is expected to be lower than the MOE of individual rings. Because shear effects do not influence
53 MOEtv and MOEsw, these estimates were expected to be higher than MOEbl, but this was not the case. Estimates of MOE may also be affected by moisture content when moisture content is below the fiber saturation point. Although bending stiffness increases by 2% for each 1% reduction in bound water (Gerhards 1975), stress wave velocity increases by only 1% (Wu 1999). Therefore, MOEbl may be larger than MOEsw because our 2x4s were below the fiber saturation point (< 7% MC). Stress wave MOE also underestimated bending MOE in sweet gum, southern pine, and 4-year-old radiata pine (Gerhards 1975; Halabe et al. 1997; Lindström et al. 2004), but overestimated bending MOE in western hemlock, Sitka spruce, lodgepole pine, and 3-year-old radiata pine (Wang et al. 2001; Lindström et al. 2002). Therefore, it seems that a consistent relationship may not be found among these alternative measures of MOE. Although the different measurement techniques ranked our 2x4s consistently (discussed below), they yielded different absolute estimates of MOE, and it is unclear whether these absolute differences will be repeated in other situations.
Of the two field-based stress wave tools, the ST300 overestimated MOEbl by 15%, whereas the HM200 underestimated MOEbl by 13%. Although both tools are based on the same principle (stress waves), the ST300 measures stress wave velocity in the outerwood of the tree, whereas the HM200 provides an integrated estimate of stress wave velocity across the whole log. Because the outerwood is denser and stiffer than the juvenile core (Megraw et al. 1986), the higher values for VELST and MOEST (i.e., as compared to VELHM and MOEHM) were expected. Although we developed equations to
54 predict MOEbl from the lab and field-based tools (discussed below), absolute estimates of MOE are not necessary for making genetic selections and obtaining genetic gain. 4.2. Phenotypic correlations between bending stiffness and indirect estimates of wood stiffness
Our study suggests that the MOEbl of 2x4s and logs can be predicted from MOEtv (R2 = 0.83) and MOEsw (R2 ≥ 0.59) (Fig. 2). Our correlations between bending stiffness and transverse vibration MOE were comparable to those observed in red pine (rp = 0.97), jack pine (rp = 0.92), and southern pine (rp = 0.83) (Ross et al. 1994; Halabe et al. 1997). In contrast, our correlations between bending stiffness and stress wave MOE were lower than those observed in radiata pine and Eucalyptus (rp = 0.89 to 0.95) (Ilic 2001; Wang et al. 2001, 2002; Lindstöm et al. 2002, 2004; Raymond et al. 2007; Wang et al. 2007). In the plot of MOEbl versus MOEsw (Fig. 2B), two populations of values appeared to be present, but we are unable to explain this effect. Therefore, we may have underestimated the true correlation between MOEbl and MOEsw in Douglas-fir.
Because MOEbl is costly and time-consuming to measure, it is not feasible to use MOEbl for making genetic selections in large-scale breeding programs. However, the correlation between MOEbl and MOEsw indicates that field tools based on stress waves (e.g., HM200 and ST300) will be useful for predicting bending stiffness in Douglas-fir breeding programs, and quantitative genetic analysis support these conclusions (Cherry et al. 2008).
55 On a log and tree basis, bending stiffness was more highly correlated with MOEHM (R2 = 0.42) than with MOEST (R2 = 0.20). In radiata pine, bending stiffness was also more strongly correlated with HM200 MOE than with ST300 MOE (Wang et al. 2003). A number of reasons have been cited for the better performance of the HM200 compared to the ST300 (Andrews 2000; Carter et al. 2005; Cherry et al. 2008). First, because the HM200 samples a greater amount of wood than does the ST300 (i.e., whole log versus only the outerwood between the ST300 probes), it is less affected by within-tree variation in MOE. Second, the HM200 estimates stress wave velocity from the resonant frequencies of waves that repeatedly reverberate between the ends of the logs. In contrast, the ST300 estimates velocity from a single pass of the stress wave (time-offlight). Compared to resonance-based methods on logs, large knots and branches greatly affect the precision of time-of-flight measurements made on standing trees (Briggs et al. 2005). The HM200 is also less complicated and demanding to operate than the ST300 because the ST300 measurements are influenced by the insertion angle of the probes and hammer impact angle (Andrews 2000). Nonetheless, simply increasing the distance between the probes and taking many measurements per tree can improve the prediction potential of standing tree tools such as the ST300 (Wanger et al. 2003).
4.3. Wood stiffness is phenotypically correlated with wood density, MFA, and knots
Wood density, MFA, and knots are believed to be the most important traits affecting the stiffness of wood (Ifju and Kennedy 1962; Tsoumis 1991; Beaulieu et al. 2006). Furthermore, reports from studies that focused on clearwood MOE suggested that density and MFA are the most important traits in knot free wood (Evans and Ilic 2001; Yang and
56 Evans 2003; Xu et al. 2004). Therefore, we used 2x4s to study the relationships between wood stiffness, density, and knots; and small clearwood specimens to study the associations between stiffness, density, and MFA. 4.3.1. Correlations between bending stiffness and wood density
On a tree basis, the phenotypic correlation between MOEbl and DENdl (rp = 0.67) was stronger than the correlation between MOEbl and DENdd (rp = 0.50), and roughly comparable to the correlation between MOE and density in small clearwood samples of Douglas-fir (rp = 0.76; B. Lachenbruch, pers. comm., 8 August 2008). One reason for the higher correlation between MOEbl and DENdl is that these traits were measured on the same 2x4s, whereas DENdd was measured on basal wood disks. The basal wood disks sampled a different vertical portion of a tree (immediately below the 2x4s) and sampled outerwood that was not sampled by the rectangular 2x4s. In radiata pine, the radial variation in density is greater than the vertical variation (Xu et al. 2004). Therefore, it appears that within-tree variation in wood properties resulted in only a moderate correlation between DENdl and DENdd (rp = 0.60), and between MOEbl and DENdd. In contrast to our results, bending stiffness was more strongly correlated with the density of wood disks collected at breast height (rp = ~0.75; Knowles et al. 2003, cited in Johnson and Gartner 2006; Johnson and Gartner 2006). Therefore, densities obtained from breastheight increment cores may be more strongly correlated with bending stiffness than are densities obtained from basal wood disks. Although increment core densities are often used to select superior trees for seed orchards and tree breeding, the density of increment cores was not evaluated in this study.
57 The phenotypic correlation between DENdl and DENsc (rp = 0.80; 2x4 basis) was stronger than the correlation between DENdl and DENdd (rp = 0.60; log basis), perhaps because the 2x4s and small clearwood samples shared the same growth rings. In contrast, the wood disks sampled a larger proportion of outerwood and greater number of growth rings than did the 2x4s. Because variation in wood density (i.e., measured on lumber, disks, or small clearwood samples) explained less than 45% of the phenotypic variation in MOEbl, we studied whether better predictive equations could be developed by incorporating additional traits (discussed below).
4.3.2. MFA was negatively correlated with stiffness
On a lumber basis, MOEbl had a moderate negative phenotypic correlation with MFAsc (rp = -0.42). Comparable negative correlations between stiffness and MFA have been reported in Douglas-fir and several other species, including radiata pine, loblolly pine, red pine, western pine, and Eucalyptus spp. (Downes et al. 2002; Knowles et al. 2003, cited in Johnson and Gartner 2006; Yang and Evans 2003; Baltunis et al. 2007; Raymond et al. 2007; B. Lachenbruch, pers. comm., 8 August 2008). Studies on the elastic properties of cell wall layers using fiber composite models suggest that small MFAs increase wood stiffness because cell layers with vertically oriented microfibrils (i.e., small MFAs) are stiffer than cell layers with more horizontally oriented microfibrils (i.e., large MFAs; Cave 1968; Megraw 1985; Cave and Walker 1994).
Compared to our results, the phenotypic correlation between bending stiffness and MFA was generally stronger in radiata pine (-0.45 to -0.82; Bendsten and Senft 1986; Downes
58 et al. 2002; Raymond et al. 2007), red pine (-0.68; Deresse et al. 2003), cottonwood (-0.62; Bendsten and Senft 1986), and Eucalyptus spp. (-0.93; Yang and Evans 2003). MOE increased 5- to 6-fold in radiata pine, loblolly pine, and Sitka spruce when MFA decreased from 40º to 10º, and this decrease was associated with increasing ring age (Cave 1968; Bendsten and Senft 1986). Our variation in MFAsc (9.2º to 21.6º) may be modest because we selected small clearwood samples from 2x4s that had a ring age of only 9.0 to 9.5 years. Similarly, the variation in MFA (9.4º to 23.2º), and the correlation between MFA and stiffness (-0.34 to -0.45) were modest in studies involving older Douglas-fir (17 to 49-years old; B. Lachenbruch, pers. comm., 8 August 2008). However, the correlation between MFA and bending stiffness was slightly stronger (-0.56 to -0.58) in a study of increment cores collected from 41-year-old Douglas-fir trees growing in New Zealand (Knowles et al. 2003, cited in Johnson and Gartner 2006).
Earlier studies on the radial variation of Douglas-fir MFA using polarized light microscopy and the pit aperture method yielded more variation in MFA than we observed (~10º to 30º; Ifju and Kennedy 1962; Erickson and Arima 1974) but correlations between stiffness and MFA were not reported. Based on our analysis, MFAsc explained only 18% of the phenotypic variation in MOEbl compared to 52% for Densc. Although MFA was not strongly associated with bending stiffness in our samples (which were chosen to minimize variation in vertical tree position and ring age), the correlation between MFA and bending stiffness is expected to be stronger in a more diverse set of samples (e.g., samples with younger and older ring ages) with greater variation in MFA.
59 Although the correlation between MOEbl and MFAsc was only moderate (rp = -0.42), the correlation between MOEsc and MFAsc was strong (rp = -0.87). Strong correlations between SilviScan MOE and SilviScan MFA have been widely reported (Knowles et al. 2003, cited in Johnson and Gartner 2006; Baltunis et al. 2007). These correlations, however, are expected to overestimate the true correlation between bending stiffness and MFA because SilviScan MOE and SilviScan MFA are predicted from the same data; i.e., azimuthal intensity profile calculated from X-ray diffraction data. 4.3.3. Knots were weakly correlated with stiffness
On a lumber basis, MOEbl had a weak negative phenotypic correlation with KNTedg (rp = -0.21), weak positive correlation with KNTcnt (rp = 0.11), and no significant phenotypic correlation with KNTtot. Knots lower lumber stiffness because they cause deviations from optimal grain orientation and concentrate stress (i.e., at the knot) (Megraw 1986; Kabir et al. 2003). Negative associations between knot traits and stiffness have been reported in white spruce, Scots pine, Japanese larch and other species (Samson 1993; Forest Products Laboratory 1999; Takeda and Hashizume 1999; As et al. 2006; Beaulieu et al. 2006).
Although two of the knot traits had significant correlations with 2x4 stiffness, these correlations were weak, presumably because the knots were small and few. The largest knot was only 47 mm (1.85 in) in diameter, and the average sizes of KNTedg and KNTcnt were below 18 mm (0.70 in). Furthermore, there were only about 7 knots per 2x4. In white spruce lumber, the correlation between knot size (mean = 17 mm) and bending MOE was also low and negative (rp = -0.20; Beaulieu et al. 2006), but the correlation
60 between the number of knots and bending MOE was moderate (rp = -0.40), perhaps because the lumber had many more knots (38 per board) than we found in our 2x4s. In contrast to progeny tests that are planted on a uniformly spaced grid, variation in spacing should be larger in operational plantations and naturally regenerated stands. Because variation in spacing should lead to greater variation in knot traits (Roth et al. 2007), the correlations between knot traits and stiffness may be stronger in these stands. In white spruce, knot traits also had moderately negative correlations with MOR on a family mean basis (Beaulieu et al. 2006), but we did not measure MOR in this study.
4.4. Combined effects of density, MFA, and knots
We used path analysis to partition the correlations between stiffness versus density, MFA, and knots into their direct and indirect components. Path analysis is an extension of multiple linear regression that accounts for the covariance between independent variables before the strength of relationships are estimated via path coefficients (i.e., straight-line relationships in Fig. 5). The correlations between the variables are indicated by the curved-line relationships in Fig. 5. Compared to MFAsc and KNTedg, the larger path coefficients for DENdl and DENsc suggest that wood density has the greatest direct effect on 2x4 stiffness (Fig. 5). Both the path coefficients and correlation coefficients indicate that edge knots had a weak negative effect on bending stiffness.
61 4.5. Use of SilviScan for Douglas-fir tree improvement
Results from the 2x4 subset indicate that information on wood density, MFA, and edge knots can be combined to predict wood stiffness of Douglas-fir lumber (R2 = 54 to 58%), but density alone was almost as good (R2 = 49 to 52%). Although SilviScan variables can be used to predict bending stiffness, MOEsc explained only 45% of the variation in MOEbl. Nonetheless, SilviScan has been valuable for studying radial and vertical variation in MOE, MFA, and density at a fine scale (Baltunis et al. 2007). For example, SilviScan analyses have shown that density is relatively uniform from the base to the top of radiata pine trees (within the corewood), whereas stiffness increases from the pith to the outside of the bole (Cown et al. 1992; Xu et al. 2004). Our results suggest that similar fine scale analyses of Douglas-fir wood properties would be possible using SilviScan. However, because MFA added little to the prediction of wood stiffness in our study and is difficult to measure on thousands of trees in progeny tests, we do not recommend incorporating MFA or SilviScan MOE into Douglas-fir breeding programs if standing-tree or whole log stress wave measurements can be obtained (e.g., Cherry et al. 2008).
4.6. Effects of ring age and ring orientation on wood stiffness and density
We observed a radial increase in MOEbl with increasing RA (rp = 0.42), presumably because the older outerwood had a higher wood density (discussed below) and lower MFA than the younger juvenile core (Cave and Walker 1994). Wood stiffness also increased from the pith to cambium in Douglas-fir and radiata pine (Cown et al. 1992; Knowles et al. 2003, cited in Johnson and Gartner 2006; Xu et al. 2004). We were
62 unable to study the relationship between MFA and RA because the 2x4s we used to analyze MFA were chosen to have a RA of 9.0 to 9.5 years. MFA was associated with ring age, however, in other studies of Douglas-fir (Ifju and Kennedy 1962; Erickson and Arima 1974; Knowles et al. 2003, cited in Johnson and Gartner 2006).
MOEbl was also associated with the orientation of the growth rings in relation to the applied load (Fig. 1). Compared to the radially applied load, MOEbl was greater when the load was applied either tangentially or diagonally to the growth rings. However, the 2x4s with tangentially or diagonally applied loads also had higher average ring ages (i.e., 9.6 and 11.7 years) than did the 2x4s that received the radially applied load (i.e., 6.4 years). Because ring orientation and ring age are related (Fig. 7), the differences in MOEbl among ring orientation classes may result from differences in ring age plus differences in RO per se. In contrast to our findings, bending stiffness of small clearwood samples did not differ significantly among ring orientation classes in a previous study of Douglas-fir, but ring age was not held constant (Grotta et al. 2005).
The correlation between DENdl and RA (rp = 0.25) was weaker than the correlation between MOEbl and RA (rp = 0.42), and DENdl did not differ among RO classes. In radiata pine, the radial increase in wood density was also weaker than the radial increase in stiffness (Cown et al. 1992; Xu et al. 2004), which is consistent with our results. To account for the influence of RA and RO on stiffness and density, we adjusted MOEbl using RA and RO as covariates (= AMOEbl), and adjusted DENdl using RA as a
63 covariate (= ADENdl). Nonetheless, because the results from analyses of AMOEbl and ADENdl were nearly identical to the results from analyses of MOEbl and DENdl, we focused our discussion on these latter two traits.
4.7. Bending MOE and knots, but not density, were associated with lumber grade
Visual grades of Douglas-fir lumber differed in MOEbl, MOEtv, and MOEsw, indicating that visual grading can be used to sort Douglas-fir lumber into classes that have small but significant (p < 0.0001) differences in wood stiffness. For example, the STR grade had a higher mean MOEbl (11.5 GPa) than either S1 or S2 grades (10.5 and 9.6 GPa; Fig. 8). Visual grading of structural lumber is based on specific grading rules that are designed to classify lumber based on the defects that affect the quality and value of lumber for structural purposes. These defects include knots, checks, shakes, splits, and warps. However, because we did not analyze 2x4s with splits, checks, or warps, the differences in average MOE among lumber grades probably reflects the presence of knots. The STR grade had a lower mean KNTedg (14.1 mm) than either the S1 or S2 grades (16.7 and 17.9 mm; Fig. 8). The STR grade, the best grade in terms of strength and appearance, is used for making high quality posts, beams, and interior paneling. In descending order of quality, the STR grade is followed by S1, S2, S3, and E grades. Because we had only one 2x4 in each of the S3 and E grades, we did not include those 2x4s in these analyses. In contrast to the stiffness and knot traits, DENdl did not differ among lumber grades (p = 0.54).
64 4.8. Genetics of Douglas-fir wood quality
Previous studies of Douglas-fir indicated that stress wave MOE, bending MOE, and wood density had moderate to high heritabilities (Johnson and Gartner 2006; Cherry et al. 2008). Johnson and Gartner (2006) suggested that breeders can select for stress wave MOE or velocity to improve stiffness. In a subsequent study, Cherry et al. (2008) suggested that breeders should select for HM200 or ST300 traits to achieve gains in bending stiffness. The bending MOE data reported in Cherry et al. (2008) came from the experiments reported in this paper. Our laboratory analyses of transverse vibration MOE and stress wave MOE suggest that wood stiffness is under modest genetic control (hi2 = 0.22 to 0.33). These estimates are comparable to the heritabilities of MOEbl, MOEHM, and MOEST reported by Cherry et al. (2008) (hi2 = ~ 0.30). Because we used a coefficient of relationship of 0.33 to account for relatedness among wind-pollinated siblings (i.e., σ2A was estimated as 3σ2F(S)), these heritabilities would have been a third higher (i.e., 0.29 to 0.44) had we used a coefficient of relationship of 0.25 (i.e., assumed the progeny were true half-sibs). Although previous estimates of the heritabilities of stress wave MOE in Douglas-fir (0.30 to 0.55) were also based on a coefficient of relationship of 0.33 (Johnson and Gartner 2006; Cherry et al. 2008), the heritabilities of stress wave MOE in radiata pine and hybrid larch ranged from 0.47 to 0.70 using a coefficient of relationship of 0.25 (Kumar 2002, 2004; Fugimoto et al. 2006). Because our heritabilities were based on observations from a single site, they may overestimate multi-site heritabilities that include among-site genotype by environment interaction (G x E). G x E was nonsignificant, however, in our multi-site
65 analysis of stress wave velocity (Cherry et al. 2008) and in a previous study of Douglasfir stress wave MOE (Johnson and Gartner 2006).
In addition to the strong phenotypic correlations, MOEtv and MOEsw had strong genetic correlations with MOEbl (ra = 1.03 to 0.98) and moderate to strong genetic correlations with MOEHM and MOEST (ra = 0.54 to 0.93). The strong genetic correlation between MOEbl and MOEsw (ra = 0.98) is consistent with our earlier findings that field-based stress wave tools can be used to achieve genetic gains in bending stiffness (Cherry et al. 2008).
MOEbl had a weak positive genetic correlation with KNTtot (ra = 0.22), but this correlation also had a high standard error (SE = 0.43), and the phenotypic correlations between these traits were non-significant on a lumber and log basis. Furthermore, the genetic correlations between MOEbl versus KNTedg and KNTcnt are unreliable because there was no significant genetic variation for these knot traits. As discussed above, the family mean correlations between knot traits and lumber bending MOE were moderately negative in white spruce, but genetic correlations were not reported (Beaulieu et al. 2006).
Previous studies of Douglas-fir suggested that simultaneous improvement in stem volume and wood quality would be challenging because fast growing families produce a greater number of larger branches (King et al. 1992; St.Clair 1994). Our study suggests that selection for smaller or fewer knots will not have any large positive impact on bending
66 stiffness of Douglas-fir because the phenotypic and genetic correlations between knot traits and bending MOE are either weak or nonsignificant, and knot traits are weakly heritable (h2 ≤ 0.14).
4.9. Conclusions
We demonstrated that stress wave tools such as the HM200 and ST300 can be used to genetically improve bending stiffness of Douglas-fir. Because breeders can avoid costly and labor-intensive bending tests, stress wave MOE or velocity are good indirect traits to use to genetically improve bending MOE of Douglas-fir. Our findings support the recommendations of Cherry et al. (2008) that breeders should consider the advantages and disadvantages of the HM200 and ST300 before using them in breeding programs. Compared to the ST300 traits, the HM200 traits are more strongly genetically correlated with bending MOE, but require tree harvesting. Therefore, if harvesting is possible, we recommend that breeders use the HM200 to get higher gains in bending stiffness. Estimates of MOE from the ST300 may be less reliable than estimates from the HM200, but the ST300 is still useful for improving stiffness, particularly when the trees cannot be destructively sampled, and when family means are used to identify desirable genotypes.
Estimates of wood stiffness from stress wave tools are clearly superior to estimates from either MFA or wood density alone. Although previous studies in pine suggested that density and MFA are good surrogate traits for stiffness, our results suggest that stress wave measurements are more reliable. Furthermore, because wood density is negatively correlated with diameter growth, it is not wise to select for higher density alone. In
67 Douglas-fir, MFA had only a moderate to weak phenotypic correlation with bending MOE. In summary, no real advantage is apparent for including density or MFA as selection criteria in Douglas-fir breeding programs. Instead, we recommend that breeders focus on stress wave velocity as a more reliable method for making selections to increase bending stiffness without adversely affecting growth.
Although, large branches or knots are generally regarded as detrimental to wood quality, our results suggest little need to focus on knots in breeding programs for structural lumber.
The HM200 or ST300 can also be used by silviculturists and forest managers to predict the bending stiffness of logs or standing trees. These tools should help silviculturists define the relationships between MOE versus site characteristics and silvicultural regimes, thereby enhancing the ability of growth models to predict the financial outcomes of management alternatives. Standing-tree tools can be used to monitor the effects of silvicultural practices such as thinning and fertilization, evaluate the value of plantations, plan harvest operations, and improve the marketing or processing options of logs.
Lastly, our results suggest that wood engineers and wood scientists can use transverse vibration or stress wave MOE to predict bending MOE of Douglas-fir 2x4s. Because Douglas-fir is widely used as structural lumber, the ability to predict bending MOE will help engineers to determine the safety margins of Douglas-fir wood structures without conducting bending tests.
68
Bibliography
Andrews M (2000) Where are we with sonics? In: Proceedings of capturing the benefits of forestry research: Putting ideas to work, workshop, Wood Technology Research Center, University of Canterbury, New Zealand, 18 October 2000, pp 57-61 Andrews M (2002) Wood quality measurement — son et lumiere. NZ J For Sci 47:19-21 Anon. (2003) Director HM200 operation manual. Fiber-gen, 7140 SW Fir Loop, Suit 200, Tigard, Oregon, USA Anon. (1990) Metriguard model 340 E-computer operation manual. Metriguard Inc, SE 1120 Latah, PO Box 339, Pullman, Washington, USA Anon. (1990) Metriguard model 239A Stress wave timer operation manual. Metriguard Inc, SE 1120 Latah, PO Box 339, Pullman, Washington, USA As N, Goker Y, Dundar T (2006) Effect of knots on the physical and mechanical properties of Scots pine (Pinus sylvestris L.). Wood Research 51:51-57 ASTM standard D 198 (2005) Standard test methods of static tests of lumber in structural sizes. ASTM International, Philadelphia Baltunis BS, Wu HX, Powell MB (2007) Inheritance of density, microfibril angle, and modulus of elasticity in juvenile wood of Pinus radiata at two locations in Australia. Can J For Res 37:2164-2174 Beall FC (2002) Overview of the use of ultrasonic technologies in research on wood properties. Wood Sci Technol 36:197-212 Beaulieu J, Zhang SY, Yu QB, Rainville A (2006) Comparison between genetic and environmental influences on lumber bending properties in young white spruce. Wood Fiber Sci 38:553-564 Bendtsen BA, Senft J (1986) Mechanical and anatomical properties in individual growth rings of plantation-grown eastern cottonwood and loblollypine. Wood Fiber Sci 18:23-38 Bormann BT (1984) Douglas-fir an American wood. USDA Forest Service, FS-235 Washington, DC
69 Brazier JD (1977) Effect of forest practices on quality of harvested crop. Forestry 50:49-66 Brazier JD, Mobbs ID (1993) The Influence of Planting Distance on Structural Wood Yields of Unthinned Sitka Spruce. Forestry 66:333-352 Burdon RD, Kibblewhite RP, Walker JCF, Megraw RA, Evans R, Cown DJ (2004) Juvenile versus mature wood: A new concept, orthogonal to corewood versus outerwood, with special reference to Pinus radiata and Pinus taeda. Forest Sci 50:399-415 Busing RT, Garman SL (2002) Promoting old-growth characteristics and long-term wood production in Douglas-fir forests. Forest Ecol Manag 160:161-175 Carter P, Briggs D, Ross RJ, Wang X (2005) Acoustic testing to enhance western forest values and meet customer wood quality needs. In: Harrington, CA, Schoenholz SH (eds) Productivity of western forests: a forest products focus. USDA Forest service Pacific northwest research station, Portland, OR, General technical report, PNW-GTR-642, pp 121-129 Carter P, Briggs D, Ross RJ, Wang X (2005) Acoustic testing to enhance western forest values and meet customer wood quality needs. In Productivity of western forests: a forest products focus. Edited by C.A. Harrington and S.H. Schoenholz. USDA Forest service Pacific northwest research station, Portland, OR, General technical report, PNW-GTR-642, pp 121-129 Cave ID (1968) Anisotropic elasticity of the plant cell wall. Wood Sic Technol 2(4):268-278 Cave ID, Walker JCF (1994) Stiffness of wood in fast-grown plantation softwoods - the influence of microfibril angle. Forest Prod J 44:43-48 Chauhan SS, Walker JCF (2006) Variations in acoustic velocity and density with age, and their interrelationships in radiata pine. Forest Ecol Manag 229:388-394 Cherry ML, Vikram V, Briggs D, Cress DW, Howe GT (2008) Genetic variation in direct and indirect measures of wood stiffness in coastal Douglas-fir. Can J For Res 38:2476-2486
70 Cown DJ, Young D, Burdon RD (1992) Variation in wood characteristics of 20-year-old half-sib families of Pinus radiata. NZ J For Sci 22:63-76 Deresse T, Shepard RK, Shaler SM (2003) Microfibril angle variation in red pine (Pinus resinosa Ait.) and its relation to the strength and stiffness of early juvenile wood. Forest Prod J 53:34-40 Downes GM, Nyakuengama JG, Evans R, Northway R, Blakemore P, Dickson RL, Lausberg M (2002) Relationship between wood density, microfibril angle and stiffness in thinned and fertilized Pinus radiata. IAWA J 23:253-265 Erickson HD, Arima T (1974) Douglas-fir wood quality studies part 2: Effects of age and stimulated growth on fibril angle and chemical constituents. Wood Sic Technol 8:255-265 Evans R (1994) Rapid measurement of the transverse dimensions of tracheids in radial wood sections from Pinus radiata. Holzforschung 48(2):168-172 Evans R (1999) A variance approach to the X-ray diffractometric estimation of microfibril angle in wood. Appita J 52(4):283-289 Evans R (2006) Wood stiffness by x-ray diffractometry. In: "Characterisation of the Cellulosic Cell Wall", Chapter 11. Proceedings of the workshop. Southern Research Station, University of Iowa and the Society of Wood Science and Technology. D. Stokke and L. Groom, eds. Blackwell Publishing. Grand Lake, Colorado, USA, 25-27 August 2003 Evans R, Hughes M, Menz D (1999) Microfibril angle variation by scanning X-ray diffractometry. Appita J 52(5):363-367 Evans R, Ilic J (2001) Rapid prediction of wood stiffness from microfibril, angle and density. Forest Prod J 51:53-57 Evans R, Stuart SA, Van der Touw J (1996) Microfibril angle scanning of increment cores by X-ray diffractometry. Appita J 49(6):411-414 Evans R, Kibblewhite RP, Stringer SL (2001) Variation in microfibril angle, density and fibre orientation in twenty-nine Eucalyptus nitens trees. Appita J 53(5):450-457 Forest Products Laboratory (1999) Wood handbook: Wood as an engineering material. USDA Forest Service, Forest Products Laboratory, Madison, WI, General
71 technical report FPL-GTR-113. 463 p http://www.fpl.fs.fed.us/documnts /fplgtr/fplgtr113/fplgtr113.htm (Accessed 29 Aug 2008) Fujimoto T, Akutsu H, Nei M, Kita K, Kuromaru M, Oda K (2006) Genetic variation in wood stiffness and strength properties of hybrid larch (Larix gmelinii var. japonica x L kaempferi). J For Res 11:343-349 Gerhards CC (1975) Stress wave speed and MOE of Sweetgum ranging from 150 to 15 percent MC. Forest Prod J 25(4): 51-57 Gerhards CC (1982) Effect of knots on stress waves in lumber. USDA Forest Service, Forest Products Laboratory, Madison, WI, General technical report FPL 384. 23 p Greens DW, Rosales AN (2006) Properties and grading of Danto and Ramon 2 by 4's. Forest Prod J 56:19-25 Grotta AT, Leichti RJ, Gartner BL, Johnson GR (2005) Effect of growth ring orientation and placement of earlywood and latewood on MOE and MOR of very-small clear Douglas-fir beams. Wood Fiber Sic 37:207-212 Halabe UB, Bidigalu GM, GangaRao HVS, Ross R (1997) Nondestructive evaluation of green wood using stress wave and transverse vibration techniques. Mater Eval 55:1013-1018 Hansen LW, Knowles RL, Walford GB (2004) Residual within-tree variation in stiffness of small clear specimens from Pinus radiata and Pseudotsuga menziesii. NZ J For Sci 34(2): 206–216 Howe GT, Jayawickrama KJ, Cherry ML, Johnson GR, Wheeler NC (2006) Breeding Douglas-fir. Plant breed Rev 27:245-353 Ifju G, Kennedy RW (1962) Some variables affecting microtensile strength of Douglas-fir. Forest Prod J 12(5):213-217 Ilic J (2001) Relationship among the dynamic and static elastic properties of air-dry Eucalyptus delegatensis R. Baker. Holz Als Roh-Und Werkstoff 59:169-175 Jayne BA (1959) Vibrational properties of wood as indices of quality. Forest Prod J 9(11):413-416 Johnson GR, Gartner BL (2006) Genetic variation in basic density and modulus of elasticity of coastal Douglas-fir. Tree Genetics & Genomes 3:25-33
72 Kabir MF, Araman PA, Schafer M (2003) Pallet part and cant evaluation for grading and processing using high-speed ultrasound. Proceedings of Scan Tech 2003 International Conference, Seattle, Washington, U.S.A. 133-138 King JN, Yeh FC, Heaman JC, Dancik BP (1992) Selection of crown form traits in controlled crosses of coastal Douglas-fir. Silvae Genet 41:362-370 Kliger IR, Perstorper M, Johansson G, Pellicane PJ (1995) Quality of Timber Products from Norway Spruce. Wood Sci Technol 29:397-410 Knowles L, Hansen L, Downes G, Kimberley M, Gaunt D, Lee J, Roper J (2003) Modelling within-tree and between-tree variation in Douglas-fir wood and lumber properties. Paper presented at the IUFRO all division 5 conference, Rotorua, New Zealand, 11-15 March Kretschmann DE, Bendtsen BA (1992) Ultimate tensile-stress and modulus of elasticity of fast-grown plantation loblolly-pine lumber. Wood Fiber Sci 24:189-203 Kumar S (2004) Genetic parameter estimates for wood stiffness, strength, internal checking, and resin bleeding for radiata pine. Can J For Res 34:2601-2610 Kumar S, Dungey HS, Matheson AC (2006) Genetic parameters and strategies for genetic improvement of stiffness in radiata pine. Silvae Genet 55:77-84 Kumar S, Jayawickrama KJS, Lee J, Lausberg M (2002) Direct and indirect measures of stiffness and strength show high heritability in a wind-pollinated radiata pine progeny test in New Zealand. Silvae Genet 51:256-261 Li CC (1975) Path analysis: a primer. Boxwood Press; Pacific Grove, California. 346 pp. Li XB, Huber DA, Powell GL, White TL, Peter GF (2007) Breeding for improved growth and juvenile corewood stiffness in slash pine. Can J of For Res 37:1886-1893 Lindstom H, Harris P, Sorensson CT, Evans R (2004) Stiffness and wood variation of 3year old Pinus radiata clones. Wood Sci Technol 38:579-597 Lindstrom H, Harris P, Nakada R (2002) Methods for measuring stiffness of young trees. Holz Roh Werkst 60:165-174 Lynch M, Walsh B (1980) Genetics and analysis of quantitative traits. Sinauer associates, Inc. Sunderland, MA
73 Macdonald E, Hubert J (2002) A review of the effects of silviculture on timber quality of Sitka spruce. Forestry 75:107-138 Mack JJ (1979) Australian methods for mechanically testing small clear specimens of timber. CSIRO Division of building research. Technical paper (2nd series), No 31, 19 pp Maguire DA, Kershaw JA, Hann DW (1991) Predicting the effects of silvicultural regime on branch size and crown wood core in Douglas-fir. Forest Sci 37:1409-1428 Megraw RA (1985) Wood quality factors in loblolly pine. The influence of tree age, position in tree, and cultural practice on wood specific gravity, fiber length, and fibril angle. TAPPI Press, Atlanta, Georgia Megraw RA (1986) Douglas-fir wood properties. In: Oliver CDO, Hanley DP, Johnson JA (eds) Proceedings, Douglas-fir: Stand management for the future. Institute of Forest Resources, University of Washington, Seattle, Washington. pp. 81-96 Megraw RA, Bremer D, Leaf G, Roers J (1999) Stiffness in loblolly pine as a function of ring position and height, and its relationship to microfibril angle and specific gravity. In: Connection between silviculture and wood quality through modeling approaches, IUFRO W.P.S5.01-04, La, USA, 5-12 August 1999 Neter J, Kutner MH, Nachtsheim CJ, Wasserman W (1996) Applied linear statistical models. 4th ed. McGraw-Hill Co., Inc., Chicago, IL Pellerin RE (1965) A vibrational approach to nondestructive testing of structural lumber. Forest Prod J 15(3):93-101 Pellerin RF, Ross RJ (2002) Nondestructive evaluation of wood. Forest Prod Soc., Madison, WI Peterson MG, Dietterich HR, Lachenbruch B (2007) Do DOUGLAS-FIR branches and roots have juvenile wood? Wood Fiber Sci 39:651-660 Raymond CA, Joe B, Evans R, Dickson RL (2007) Relationship between timber grade, static and dynamic modulus of elasticity, and silviscan properties for Pinus radiata in New South Wales. NZ J For Sci 37:186-196 Rippy RC, Wagner FG, Gorman TM, Layton HD, Bodenheimer T (2000) Stress-wave analysis of Douglas-fir logs for veneer properties. For Prod J 50:49-52
74 Ross RJ, Pellerin RF (1994) Nondestructive testing for assessing wood members in structures: A review. USDA, forest products laboratory, Madison, WI, general technical report, FPL-GTR-70 (Rev), 40p Ross RJ, Geske EA, Larson GR, Murphy JF (1991) Transverse vibration nondestructive testing using a personal computer. USDA, forest service, forest products laboratory, Madison,WI, research paper, FPLRP- 502, 17 p Ross RJ, Groot D, Nelson WJ (1994) Technique for nondestructive evaluation of biologically degraded wood. Exp Tech 18(5):29-32 Roth BE, Li X, Huber DA, Peter GF (2007) Effects of management intensity, genetics and planting density on wood stiffness in a plantation of juvenile loblolly pine in the southeastern USA. Forest Ecol Manag 246:155-162 Samson M (1993) Method for assessing the effect of knots in the conversion of logs into structural lumber. Wood Fiber Sci 25:298-304 Senft JF, Bendtsen BA, Galligan WL (1985) Weak wood. J Forest 83:476-484 Squillace AE (1974) Average genetic correlations among offspring from open-pollinated forest trees. Silvae Genet 23:149-156 St.Clair JB (1994) Genetic variation in tree structure and its relation to size in Douglas-fir. I. Biomass partitioning, foliage efficiency, stem form and wood density. Can J For Res 24:1226-235 Takeda T, Hashizume T (1999) Differences of tensile strength distribution between mechanically high-grade and low-grade Japanese larch lumber II: Effect of knots on tensile strength distribution. J Wood Sci 45:207-212 Tsoumis G (1991) Science and technology of wood- structure, properties, utilization. Van Nostrand Reinhold, NY Wagner FG, Gorman TM, Wu SY (2003) Assessment of intensive stress-wave scanning of Douglas-fir trees for predicting lumber MOE. Forest Prod J 53:36-39 Wang SY, Lin CJ, Chin CM (2003) Effects of thinning and pruning on knots and lumber recovery of Taiwania (Taiwania cryptomerioides) planted in the Lu-Kuei area. J Wood Sci 49:444-449
75 Wang XP, Carter P, Ross RJ, Brashaw BK (2007) Acoustic assessment of wood quality of raw forest materials- A path to increased profitability. Forest Prod J 57:6-14 Wang XP, Ross RJ, Carter P (2007) Acoustic evaluation of wood quality in standing trees. Part I. Acoustic wave behavior. Wood Fiber Sci 39:28-38 Wang XP, Ross RJ, Mattson JA, Erickson JR, Forsman JW, Geske EA, Wehr MA (2002) Nondestructive evaluation techniques for assessing modulus of elasticity and stiffness of small-diameter logs. Forest Prod J 52:79-85. Wang XP, Ross RJ, McClellan M, Barbour RJ, Erickson JR, Forsman JW, McGinnis GD (2001) Nondestructive evaluation of standing trees with a stress wave method. Wood Fiber Sci 33:522-533 White TL, Adams WT, Neale DB (2007) Forest genetics. CABI Publishing. Oxford University Press, USA Wu Q (1999) Influence of moisture on stress-wave properties of wood-based panels. Eleventh Symposium on the Nondestructive testing of Wood Proceedings. Forest Products Society. p19-26 Xu P, Donaldson L, Walker J, Evans R, Downes G (2004) Effects of density and microfibril orientation on the vertical variation of low-stiffness wood in radiata pine butt logs. Holzforschung 58:673-677 Yang JL, Evans R (2003) Prediction of MOE of eucalypt wood from microfibril angle and density. Holz Als Roh-Und Werkstoff 61:449-452 Zobel B (1972) Three rings per inch, dense southern pine - should it be developed. J Forest 70(6):332-336 Zobel BJ, Sprague JR (1998) Juvenile wood in forest trees. Springer-Verlag, Berlin
76
Appendix A1: Estimation of MOEtv
E-computer estimates the transverse vibration MOE in psi based on the equation given below (Metriguard 1991). MOE1tv =
wL3 f 2 Kbh 3
where w is the weight of the 2x4 (lb), L is the span length (in), f is the vibration frequency, b is the 2x4 width (in), h is the 2x4 thickness (in), and K is the calibration constant to accommodate the units used and the support conditions of the instrument. Because we had to test ~1500 2x4s in this study, we used a default width of 3.5 in and thickness of 1.5 in rather than adjusting the E-computer for the excat dimensions of each 2x4. Later, we recalculated the MOEtv (psi) of individual 2x4s based on the actual width and thickness using the following simplified equation: MOEtv =
11.8125 × MOEtv1 bh3
MOEtv was then converted to GPa by multiplying by 6.895 x 10⁻⁹.
The SAS code used to arrive this equation is given below: Extraction of transverse vibration moe ; ecmoe= (11.8125*moeec)/(w*t**3); /* HOW “(11.8125*moeec)/(w*t**3)” ??
MOE of E-computer= [(weight)* (length^3)* (f^2)] / K *w* (t^3) 10^6psi] weight= weight of test specimen
[Unit-
77 K= adjustment constant used to accomodate units used and the support conditions; f= undamped natural frequency; w= width of 2x4 (in)-the default is set as 3.5in t=the thickness of 2x4 (in), default is set as 1.5 in length=span between the blades of e-computer (a constant)=82''in To get the board specific MOE for given width and thickness (the two variables which will change in a 2x4 because e-computer was setup with a default width and thickness setting): After accounting for constants Ecomputer MOE depends on, E= constant/ w thickness^3 where width is 3.5 inch and thickness is 1.5 inch MOE of a particular board of given dimensions is E'= constant/(width') (thickness'^3) where width' is the width of a particular board and thickness' is thickness of a particular board So solve for E'/E: MOE specific for a particular board, E'= [width* thickness^3 * E]/width' * thickness'^3 =[11.8125*E]/width'* thickness'^3 specific.
where b' and h' are board
*/
**conversion to SI units(GPa); ecmoesi= ecmoe*6.894757
A2: Estimation of MOEsw
The SAS code used to arrive this equation is given below: (MOEsw = v2d/g) Extraction of stresswave moe from weight and time; moestress=(length)**2/(time*10**-6)**2 * (weight*.00220462)/(length*w*t) /(386.08858 );
/*v^2*/ /*d*/ /*g*/
/* moestress= [(v^2) d] /g v= velocity of propagation=distance between transducers(in)/propagation time(sec)
78 =length (in)/ [time(micro-sec)*10^6] (sec) d=density=weight of 2x4 (lb)/[length x width x thickness](in^3) =[weight(gm)*.00220462 ](lb)/ [length x w x t ](in^3) g=gravity constant= 386.08858 in/sec^2 [where g= 9.80665 2 ] substituting in the formulae, moestress={[(length)/(time*10**-6)]**2} * [(weight*.0022)/(length*w*t)]/386 [unit-psi] */ *conversion to SI units (GPa); estresssi=moestress*6.894757* 10**-6; /* 1psi= 6.894757* 10^-6 GPa */
m·s-