Supplementary Material (ESI) for Lab on a Chip This journal is © The Royal Society of Chemistry 2009
Rapid, cost-efficient fabrication of microfluidic reactors in thermoplastic polymers by combining photo-lithography and hot embossing Jesse Greenera, Wei Lia‡, Judy Rena, Dan Voicua, Viktoriya Pakharenkoa, Tian Tangb, and Eugenia Kumachevaa
a
Department of Chemistry, University of Toronto, 80 Saint George St, Toronto Ontario, Canada b
EV Group, Inc., 7700 S. River Parkway, Tempe, Arizona 85284, USA ‡ Co-first author
Fax/Tel: 416-978-3576; E-mail:
[email protected]
Materials A photoresist SU-8 3050 was supplied by Microchem Corp. (MA). Cycloolefin polymer (COP, 1420R) was purchased from Zeonor Chemicals. Polycarbonate (Lexan 9034-112) was supplied by Sabic Polymershapes. The acrylic polymer (Acrylite OP-4) was acquired from Evonik CYRO LLC. Monomers tri(propylene glycol) diacrylate (TPGDA) and N-isopropylacrylamide (NIPAAm), a crosslinker N,N'-methylenebisacrylamide (BIS), surfactants sorbitane monooleate (Span 80), polyoxyethylenesorbitan
monooleate
(Tween
80),
and
Triton
X-100,
photo-initiators
1-
hydroxycyclohexyl phenyl ketone (HCPK) and 2-hydroxy-2-methylpropiophenone (HMPP), and light mineral oil were purchased from Sigma-Aldrich (Canada) and used as received. Characterisation of surface patterning Topographies of the master and of the patterned thermoplastic polymer were examined using optical profilometerty (Veeco NT 1100), optical microscopy (Olympus BX41) coupled with a CCD
2
camera (EvolutionTM VF) using ImagePro software, and scanning electron microscopy (SEM) (Hitachi TM-1000).
Characterisation of droplet dimensions An optical microscope (Olympus BX41) coupled with a CCD camera (Evolution VF) was used to image the emulsified droplets. The distribution of the sizes of at least 200 droplets was determined by image analysis of the micrographs (Software Image-Pro Plus 5.0). The magnification of the objective was 20 times (2 times objective and 10 times eyepiece). The software defined the boundary between the droplet and surrounding oil phase, and determined mean diameter, standard deviation and CV of the droplets.
Characterization of interfacial tension The interfacial tension between the droplet and continuous phases was measured by a droplet shape analyzer (DSA100, Kruss) at room temperature, as described elsewhere.1 A pendent droplet of the disperse phase was generated in a transparent container of the continuous phase. Five measurements have been taken and an average value of interfacial tension was obtained.
Imprint template fabrication An imprint template (master) for hot embossing was fabricated using a copper plate coated with a two-layer film of SU-8. Figure S1 shows a cross-section of the template.
3
Feature layer Seed layer Imprint template base Fig. S 1. (a) A schematic of an imprint template showing the SU-8 seed and feature layers applied to the copper base.
Smooth surface of the side walls of master’s features simplified the de-embossing step and resulted in a smoother finish on imprinted microchannels. To investigate the effect of the resolution of the printed photomask on the smoothness of the side walls, multiple SEM images were acquired from the masters prepared from masks printed at resolution of 1,000, 5080 dpi, and 20,000 dpi. Representative images are shown in Figure S2. Based on the SEM images, the surface roughness was quantified by calculating the surface distance index (SDI). SDI = ds/d (1), where ds is the measured path length (encompassing wall roughness) between two points along the embossing feature wall and d is the distance of a straight line between the same two end points. From eq. (1), SDI was calculated to be 1.06, 1.008, and 1.0001 for the imprint templates fabricated from the masks printed at the resolution 1,000, 5,080 and 20,000 dpi, respectively. (a)
(b)
(b)
(c)
(c)
Fig. S2 SEM images (top view) of master’s feature edges and protrusions for the masters fabricated using masks with resolution of 1,000 dpi (a) 5,080 dpi (b) and 20,000 dpi (c). In each case, the feature edge occupies the top portion of the image. Wall edges, extending horizontally along the middle of the images, appear brighter due to the charging of the SU-8 surface during image acquisition. Scale bars are 10 μm.
Microfluidic device fabrication: Thermoembossing Thermoembossing was conducted in a hydraulic press (Model 3851-C Carver Inc., Wabash, IN) with +/- 1 oC temperature control of the top and bottom platens. The optimised embossing conditions are
4
listed in Table S1 along with material properties relevant to the embossing process. All reported temperature measurements are taken directly from the platens. In a separate calibration measurement, we determined that the temperatures of polymer sheets were ca. 4-6 oC lower than the platen. The master was loaded with its features facing up onto the bottom platen of the press. A 1 mm-thick sheet of the thermoplastic polymer was placed on top of the imprint template (in the case of PC, its relatively high water absorption required a dehydration step which involved pre-heating of PC at roughly 80 oC for 40-80 minutes (td) before embossing). A square polished copper plate with dimensions 7.6 x 7.6 cm and the thickness of 1 mm was placed on top of the polymer, with the polished side against it. Table S1 Material properties and optimised HE conditions for the fabrication of microfluidic reactions in COP, acrylate based polytmer and PC. Material
Material Properties Glass transition temperature,
Wetting angle,
Tg o
COP Acrylic PC
Embossing Conditions Heating time,
θw
Thermal expansion coefficient, α
th
Embossing temperature, Te
De-embossing temperature,
Pressure,
Time,
Cooling time,
Td
Pe
te
tc
C
deg
ppm K-1
min
C
kPa
min
min
138a
84 +/-2
70
15
155 +/- 0.5
100–125 +/- 0.5
400–620
10
20
b
64 +/-1
52
15
117 +/-0.5
90 +/- 0.5
400–620
10
20
b
68 +/-2
58
20
170 +/- 0.5
110 +/- 0.5
400–620
10
30
113
149
o
C
o
Tg is the glass transition temperature, measured by differential scanning calorimetry (a) or given by manufacturer (b). θw is the wetting angle for a droplet of water on the original material surface. td is the material dehydration time at 80 oC as recommended by PC manufacturer.
A 1 mm-thick sheet of temperature resistant silicone rubber (Mcmaster-Carr 378T22) was placed between the copper metal plate and the top platen in order to redistribute potential pressure imbalances. Irrespective of the thermoplastic polymer used for microreactor fabrication, important parameters of the HE process included temperature ramping times (th and tc), the embossing temperature (Te) and pressure (Pe), and the time of embossing (te). The schematic of the hot embossing process is shown in Figure S3 (a–c). In the first step (Fig. S3a), the press was heated until the top and the bottom platens reached the temperature of embossing, Te.
5
Next the pressure was increased to the required embossing pressure, Pe, (Fig. S3b) which resulted in the transfer of bas-relief features from the imprint template to the polymer sheet. Pressure was calculated by dividing the platen force by the total template surface area (and not by the active feature area of the master). After 5-10 min, the heaters were turned off and the system cooled under pressure Pe for 20–30 min. Once the temperature reached the de-embossing temperature, Td, the pressure was reduced and platens were separated. The imprinted thermoplastic polymer sheet was de-embossed (Figure S3c) while the imprint template was in thermal contact with the heated platen, in order to avert thermal shock associated with rapid cooling. No mold release or anti-adhesion layer between the imprint template and substrate were used.
Embossing
Sealing (d)
(a)
Activating bonding surfaces Apply pressure at elevated temperature
(b)
Bonding under pressure and temperature
(e) De-embossing
(c)
Fig. S3 (a) A polymer sheet is lightly pressed against the master while system heats. (b) After application of embossing pressure, the heated polymer conforms to the master bas-relief features. (c) After cooling to 125 oC (Td), the master is separated from the patterned polymer. The polished copper plate and the silicone rubber sheet referred to in the text are not shown. (d) The patterned and non-patterned polymer sheets are activated via exposure to plasma or to solvent vapour and then pressed against each other in a preheated hydraulic press (e). The silicone rubber sheet referred to in the text is not shown.
6
Microfluidic device fabrication: Low-temperature sealing Following thermoembossing, the imprinted and the non-patterned polymer sheets were sealed by low-temperature bonding. Conditions used in the sealing step are given in Table S2. Surface activation for low-temperature sealing of COP microreactors (Figure S3d) was achieved by exposing the polymer sheets to either O2 plasma in a plasma chamber for 30 sec at 0.8 mBar or to the vapour of methylcyclohexane (MCH). In the latter case, the COC sheets and 2 mL of MCH were placed a preheated to 30 oC glass-covered Petri dish for 3.5 min. To seal PC or acrylic polymer sheets we used air plasma activation for 30 sec at 0.8 mBar. Following activation, the patterned and non-patterned polymer sheets were brought in contact and loaded into a hydraulic press, which was preheated to the bonding temperature, Tb (Figure S3e). A thin sheet of rubber was placed between the top platen and the polymer sheets to distribute even pressure across the entire polymer surface (not shown in Figure S3e). Following bonding, we allowed the sealed microfluidic device to cool down slowly (tc) to room temperature under the pressure Pb, in order to prevent the build-up of thermal stress. In some cases a subsequent annealing cycle to 85 oC was implemented to further reduce thermal stress, thereby suppressing solvent cracking in the presence of mineral oil and monomers. Table S2 Microreactor sealing conditions Material COP COP Acrylic PC
Surface Activation Solventa Plasmab Plasmac Plasmac
texp (sec) 210 90 90 90
a
Tb (C) 70-110 70-110 60-80 70-110
Pb (MPa) 1.0-3.0 1.0-3.0 1.0-3.0 1.0-3.0
tb (min) 10 10 10 10
tc (min) 30-40 30-40 30-40 30-40
Solvent used was methylcyclohexane. O2 plasma c Air plasma texp is the time of exposure to either plasma, or to solvent vapour. Bonding conditions: bonding temperature, pressure and time (Tb, Pb, tb) and cooling time tc under pressure, Pb. b
Emulsification of monomer solution
7
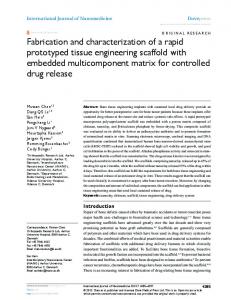
Figure 4 shows he results of emulsification conducted in COP microreactors imprinted with the SU8/Cu stamp and sealed with MCH-activated bonding. We conducted emulsification of an aqueous monomer solution comprising 5 wt% NIPAAm, 0.5 wt. % of BIS, and 0.25 wt. % of HMPP in light mineral oil comprising 4 wt. % of surfactant Span 80 (Figure S4a). In a second experiment, we emulsified tripropylene glycol diacrylate (TPGDA) mixed with 2 wt. % surfactant Tween 80 and (HCPK) in water comprising 3 wt. % of Triton X-100 (Figure S4b). The interfacial tension between the droplet phase and continuous phases were 2.8 mN/m and 0.83 mN/m for systems shown in Figures S4a and S4b, respectively.1 The diameters of approximately 200 droplets were measured using optical microscopy, yielding a mean diameter (dm) and polydispersity or coefficient of variance (CV) of the droplets. The value of CV was calculated as δ/dm × 100%, where δ is the standard deviation of droplet diameters. The droplets shown in Fig. S4a had dm = 47 μm and CV = 1.5%. The droplets shown in Fig. S4b had dm = 124 μm and CV = 2.6%. (a)
(b)
Fig. S4 Emulsificated droplets of (a) NIPAAm in light mineral oil and (b) TPGDA in water in COP the microfluidic reactor, sealed via MCH-activation. The flow rates of the droplet and continuous phases are (respectively) 0.1 mL/h and 1.0 mL/h in (a) and 0.05 mL/h and 1.0 mL/h in (b). The scale bars are 200 μm.
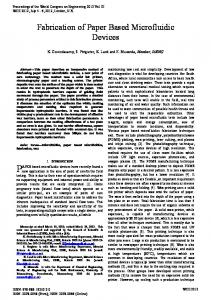
Characterisation of transmission properties of PC, COP, and acrylic polymer (Acrylite OP-4) Optical transmission properties were examined in the UV-Vis spectral region for PC, COP and the acrylic polymer (Acrylite OP-4). Based on the results of these experiments (Figure S4), we conclude that COP was the most transparent material to UV-irradiation: above 350 nm it showed transmission of ca. 90 %.
8
(b) (a)
(c)
Fig. S5 Transmission measured in the spectral region 200 to 800 nm for (a) acrylic polymer Acrylite
OP-4, (b) cycloolefin polymer (COP), (c) polycarbonate (PC). Sample thickness is 1 mm. References 1. W. Li, Z. H. Nie, H. Zhang, C. Paquet, M. Seo, P. Garstecki and E. Kumacheva, Langmuir, 2007, 23, 8010-8014.