810730
research-article2018
JLSXXX10.1177/0261927X18810730Journal of Language and Social PsychologyGrondelaers et al.
Article Journal of Language and Social Psychology 1–22 © The Author(s) 2018
Re-evaluating the Prestige of Regional Accents in Netherlandic Standard Dutch: The Role of Accent Strength and Speaker Gender
Article reuse guidelines: sagepub.com/journals-permissions DOI: 10.1177/0261927X18810730 journals.sagepub.com/home/jls
Stefan Grondelaers1, Roeland van Hout1, and Paul van Gent1
Abstract This article investigates three neglected determinants of native speakers’ attitudes toward regional accent variation in Netherlandic Standard Dutch, namely, accent strength, speaker gender, and the evaluation dimension dynamism. Nineteen participants first rated 126 speech clips representing three regional accents (Randstad, Groningen, Limburg) in terms of the expected regional origin of the speakers and their accent strength. In a subsequent speaker evaluation study, 148 participants rated the 16 clips that emanated from Study 1 as the mildest and broadest accented male and female Randstad and Limburg speech. Crucially, accent strength variation reduced the alleged status asymmetry between the high-prestige Randstad and the low-prestige Limburg accent, since mild versions of the Limburg accent were significantly upgraded on superiority and dynamism. And broadly accented Randstad females were downgraded on superiority but not on dynamism. All in all, our findings necessitate a thorough revision of current thinking about accent-triggered impression formation in Dutch. Keywords language attitudes, speaker evaluation experiment, regional accent variation, accent strength variation, prestige, gender, Labov’s Conformity Paradox
1Radboud
University Nijmegen, Nijmegen, The Netherlands
Corresponding Author: Stefan Grondelaers, Centre for Language Studies, Radboud University Nijmegen, Erasmusplein 1, 6525 HT Nijmegen, The Netherlands. Email:
[email protected]
2
Journal of Language and Social Psychology 00(0)
In the almost 60 years of its existence, the speaker evaluation technique pioneered in Lambert, Hodgson, Gardner, and Fillenbaum (1960) has helped social psychologists and sociolinguists uncover a finite and recurrent set of dimensions which determine language-based impression formation (for an overview, see Giles & Watson, 2013). In its basic setup, the speaker evaluation tool elicits assessments of unlabeled speech samples (representing different languages or language varieties) on a number of rating scales which pertain to the personality of the speaker (is this person intelligent, highly educated, compassionate, cool, . . .?). Factor analysis on such scaled evaluations has consistently revealed two evaluative dimensions, variously named superiority (status, competence, prestige) and warmth (integrity, solidarity). Although the speaker evaluation paradigm has contributed significantly to uncovering the architecture of language attitudes, the technique has recurrently been taken to the task. The selection of rating scales was criticized as early as Lee (1971), who found that the choice of scales “lacked empirical motivation and construct validity” (p. 413, but see Giles & Bourhis, 1973 for a rebuttal). On a related note, it has often been noted that researchers typically copy their scales from a number of basic studies, at the risk of “circularity (. . .) and a deceptive semblance of exhaustiveness” (Garrett, 2005, p. 1256). Bradac (1990) bears testimony to the ambivalence toward the speaker evaluation tool—even among proponents of the technique—in his observation that the insistence on the same procedures in language attitude research is “either a testament to their excellence or a sign of some stagnation in the field” (pp. 387-388). While many social psychologists and sociolinguists are currently turning to other tools to measure language attitudes—such as the Implicit Association Task (see Rosseel, 2017, for an overview and discussion), or the Event-Related Potentialtechnique (Loudermilk, 2015)—we report two studies in defense of the speaker evaluation technique. More particularly, we propose three improvements to the speaker evaluation-based measurement of attitudes toward regional accent variation in Netherlandic Standard Dutch (henceforward NSD). A unanimous finding of all foregoing speaker evaluation work on accent variation in NSD is that the accent of the Randstad—the urbanized area in the west of the Netherlands—is deemed the most prestigious (Grondelaers & van Hout, 2010; Grondelaers, van Hout, & Steegs, 2010; Heijmer & Vonk, 2002; Pinget, Rotteveel, & Van de Velde, 2014). This prestige reflects the national conceptualization of Randstadflavored Dutch as a “neutral,” nonregional accent, which is the uncontested norm for standard speech (see Grondelaers & van Hout, 2011; Smakman, 2006; van Bezooijen & Ytsma, 1999). In Heijmer and Vonk (2002) and Pinget et al. (2014), the supremacy of the Randstad accent was found to coincide with a downgrading of all other regional accents as low status. Grondelaers et al.’s (2010) and Grondelaers and van Hout’s (2010) studies, which relied on a larger set of rating scales to probe evaluations beyond status and warmth, did not reproduce this categorical distinction between one good and many bad accents: The allegedly low-prestige accent of the southern Limburg area, for instance, was deemed the most beautiful of all, and it was not considered inappropriate for formal communication. More generally, the data in Grondelaers
Grondelaers et al.
3
et al. (2010) and Grondelaers and van Hout (2010) reveal a growing tolerance for some regional accent variation in NSD. While the cited studies have advanced our insight into the perceptual dynamics of accent variation in NSD, they suffer from three shortcomings that will be addressed in the present article. To begin with, neither of them implemented an accent strength variable in their stimulus speech: All available accounts build on the assumption that as soon as group membership is detected through a speaker’s accent, the stereotypes associated with that group determine the speaker’s positive or negative evaluation. Yet there is an abundance of evidence that milder accents are evaluated systematically more favorably than stronger accents. As early as 1972, Giles found that broader versions of three regional accents of English were deemed less prestigious and attractive than the lighter versions. This inverse relationship between accent strength and evaluation has since been replicated for African American Vernacular English (Rodriguez, Cargile, & Rich, 2004), Spanish-accented Mexican American English (Ryan & Carranza, 1975), and Vietnamese Australian and Italian Australian English (A. R. Nesdale & Rooney, 1990; D. Nesdale & Rooney, 1996). Lass, Atkins, and Squires (2002) obtained similar results for Hispanic-, Asian-, and Arabic-accented English, Cargile and Giles (1998) for Japanese-accented English, Boyd (2003) for a variety of L2-accents in the Swedish of foreign teachers. In the only study of regional accents in standard Dutch which included a strength variable, Grondelaers, van Hout, and Speelman (2011) found some evidence that milder versions of Limburg-accented speech were deemed no less superior than Randstad speech. A second concern is that neither of the foregoing studies compared the evaluation of regional accents in terms of dynamism. A dynamism dimension was present (in some form, and under various names) in the earliest work on social perception dimensionality (Giles, 1971; Mulac, Hanley, & Prigge, 1974; Osgood, Suci, & Tannenbaum, 1957; Williams, 1970), and the measures used in these studies were later pooled in Zahn and Hopper’s (1985) Speech Evaluation Instrument, in which the items activepassive, talkative-shy, aggressive-unaggressive, enthusiastic-hesitant, strong-weak, confident-unsure, and energetic-lazy correlated into a dynamism dimension. The pivotal relevance of dynamism for the investigation of accent evaluation and standard language dynamics was first revealed in Kristiansen (2009), who found that ratings elicited from informants who were consciously aware of the evaluations they were offering, upgraded the standard Rigsdansk accent of Danish on superiority. Evaluations extracted from participants unaware of the research goal, however, revealed that a modern accent of Danish, dubbed “Low Copenhagen speech,” was downgraded on superiority, but upgraded on the dynamism-related traits self-assured, fascinating, and cool. The most striking omission in all the cited evaluation studies of regional accent variation in NSD is their exclusive restriction to male stimulus speakers, and this in spite of the very different role males and females have been found to play in the adherence to prescribed norms and the spearheading of linguistic innovations. Phrased in terms of Labov’s (2001) Conformity Paradox, “women deviate less than men from linguistic norms when the deviations are overtly proscribed, but more than men when
4
Journal of Language and Social Psychology 00(0)
the deviations are not proscribed” (p. 367). In convergence with the latter, females have been found to spearhead two non-standard innovations in NSD which have been claimed to be boosted by dynamism evaluations: the lowered pronunciation of diphthongs, which was originally believed to index “intellectualism, commercialism and pop culture” (Smakman, 2006, p. 50), and the stigmatized proliferation of the subject use of the object pronoun hun “them” (Grondelaers, van Gent, & van Hout, in press). In the next sections, we include the three missing variables in two new studies. We first review the methodological problems associated with the implementation of the accent strength variable, and the search for appropriate dynamism traits.
Implementing Accent Strength and Dynamism Although all available studies indicate that accent strength is a pivotal evaluation factor, the implementation of this variable has long been problematic. Ryan (1973) shared Giles’s (1972) concern about the absence of a truly objective measure of accent strength and pioneered a method that compared subjective ratings of accentedness by naïve listener-judges and objective accent strength analysis by trained phonologists and found a significant correlation between the two (Brennan, Ryan, & Dawson, 1975; see also Brennan & Brennan, 1981). Grondelaers, van Hout, and van der Harst (2015) compared subjective ratings of regional accent strength in NSD with objective strength measurements computed on the basis of acoustic phonetic analysis. Crucially, subjective and objective estimations significantly correlated for identifiable accents, and respondents strongly converged in their strength estimations. Subjective ratings were to some extent codetermined by qualitative considerations. In keeping with the stereotype that the Randstad accent is the neutral prestige accent, the mean strength of the Randstad accent was deemed lower than that of the low-prestige North (Groningen) and South (Limburg) accents, and its strength range was deemed smaller. Conversely, milder variants of the North and South accents were somewhat more difficult to identify geographically on account of the stereotyped assumption that low-prestige accents are typically broad (Grondelaers et al., 2015, p. 5). In spite of these (remediable) concerns, it is obvious that subjective strength estimations represent a reliable implementation of the accent strength variable. A methodological problem which has complicated the extraction of dynamism evaluations in Dutch is the conceptual overlap between dynamism and the evaluative dimension which is alternatively labelled “solidarity” or “personal integrity” in the sociolinguistic literature, but “warmth” in social psychology (see, especially Cuddy, Fiske, & Glick, 2008). In Grondelaers and Speelman’s (2013) speaker evaluation study of Tussentaal, a colloquial variety of Belgian Dutch, dynamism was elicited with two Dutch adjectives adapted from Kristiansen’s studies (in English: Self-assured and cool), as well as the adjective trendy. Factor analysis returned three components, on the first of which the dynamism items trendy and self-assured correlated with the warmth traits entertaining and popular. This factor was labelled “dynamism” on account of the trendy, and especially the self-assured trait, which are not typical warmth attributes. While one could avoid the conceptual overlap between dynamism
Grondelaers et al.
5
and warmth by implementing dynamism in terms of Zahn and Hopper’s (1985) muchreplicated Speech Evaluation Instrument, some of their dynamism measures—especially aggressive and strong—do not match well with the type of “media cool” which correlates with non-standard varieties in Kristiansen (2009) and Grondelaers and Speelman (2013), and which is “resourceful” rather than strong, and “trendy,” “assertive,” and “mildly challenging” rather than downright aggressive. In Study 2, we will extract dynamism evaluations with measures validated in a preexperiment featuring visual correlates of the envisaged type of dynamism. Two new studies will be presented in this article. Study 1 was designed to investigate whether respondents can distinguish a broad version of the Randstad accent, and mild versions of the North and South accents which can still be correctly identified. Study 2 is a speaker evaluation design in which we included regional accent (high vs. low prestige), accent strength (mild vs. broad), and gender (male vs. female) as speaker variables, and dynamism as an extra evaluation variable. Three research questions are put forward for testing: Research Question 1: Does accent strength variation systematically affect impression formation to the extent that the milder a regional accent gets, the more superior its speaker is deemed? Research Question 2: Can we “cleanly” extract dynamism perceptions (viz separately from warmth)? And do dynamism perceptions stratify the evaluation of mild and broad variants of high- and low-prestige accents? Research Question 3: How does speaker gender interact with superiority and dynamism? Do our data confirm the Conformity Paradox to the extent that females but not males are penalized for violating prescriptive norms by being downgraded in terms of the superiority typically associated with standard behavior?
Study 1 Method Speech Stimuli. Stimuli for Studies 1 and 2 were extracted from the Sprekend Nederland corpus (van Leeuwen et al., 2016), a speech database compiled via media-supported crowd-sourcing. A purpose-designed smartphone app enabled users not only to record their own speech but also to locate the speech of others in regional terms (“where does this person come from”), and to rate its degree of accentedness. We selected speakers who had produced speech in response to stimulus set a (van Leeuwen et al., 2016, see the appendix), a set of 10 short sentences constructed in function of five phonetic features known for their variable production across the Dutch territory. We extracted all realizations of these sentences produced by highly educated male and female speakers between 20 and 40 years of age, originating from the Randstad, South (Limburg), and North (Groningen) areas. In contrast to previous analyses which followed van Hout, De Schutter, De Crom, Huinck, Kloots, and Van de Velde (1999) in their equation of the Randstad zone with the provinces of North
6
Journal of Language and Social Psychology 00(0)
Holland, South Holland, and Utrecht, the North zone with the provinces of Groningen, Drenthe, and Friesland, and the South zone with the provinces of Limburg, NorthBrabant, and Zeeland, the present investigation delineated experimental speech zones on a town-by-town basis. We did this to enlarge the North zone with two regions in which accents are commonly regarded as “Northern” by laymen—the Achterhoek (literally “the back corner”) in the province of Gelderland, and the province of Overijssel—, and to eliminate areas in the Randstad zone which are not deemed prestigious in popular conceptions, namely, the rural West-Frisian communities, and the cities Amsterdam, Den Haag, and Rotterdam, in which broader accents tend to be associated with working-class stereotypes (Grondelaers et al., 2015). In the next step, we eliminated speakers whose accent was not minimally identifiable in the Sprekend Nederland database: Samples produced by speakers who were not correctly identified as Randstad, North, or South by 50% of at least 10 listeners in the database were removed from the sample. We also discarded stimuli of low sound quality, as well as deviant voices (too high, too low, too nasal), poor or mechanical readings, and speakers with an extremely low speech rate. From the resulting set of 336 clips, all the Randstad samples (n = 33) were included in Study 1, as well as a subset of broadly and mildly accented North (26 male, 25 female) and South samples (20 male, 22 female), selected on the basis of available strength ratings in the Sprekend Nederland database. Since the 126 samples eventually included are shorter (between 3.45 and 7.52 seconds) than customary in previous investigations, they were played twice. All stimuli were normalized in terms of volume. Respondents and Task. The 126 samples were randomized and played to 19 secondyear students of the Radboud University Nijmegen, majoring in language studies or linguistics, but without any prior training in accent (strength) recognition. The average age of the respondents was 21 (ranging from 19 to 23), 16 were female; 8 originated from Gelderland, 6 from Limburg, 4 from North-Brabant, 1 from Utrecht. They took the experiment collectively in one session, which lasted approximately 40 minutes. Participants were asked first to determine the regional background of the speakers of the 126 samples, elicited in terms of the names of the three accent zones included in the study: Respondents were given a three-way choice between Rand (R), North (N), and South (S). This procedure deviates somewhat from previous studies (notably Grondelaers et al., 2010, and Grondelaers & van Hout, 2010), in which regional identification was extracted in terms of the hypothesized province of origin of the speakers, a more basic level of socioregional classification for most of the Dutch than the four accent zones (Grondelaers et al., 2015). Since respondents in the present study are linguistics students who have no problem applying the four zones classification, we decided to use the latter to expedite a long task and to avoid fatigue and boredom. Participants were also asked to determine the age of the speakers (to check whether speakers “sounded” their age, see below), their accent strength on a scale of 1 (none) to 7 (strong), and their suitability for a follow-up study on personality evaluation (scale from 1 [not] to 7 [very]).
7
Grondelaers et al. Table 1. Accent Strength Means, Accent Strength Ranges, Proportion of Correct Regional Identifications as a Function of Accent Zone. Means North Female Male Rand Female Male South Female Male
3.50 3.43 3.58 3.50 3.41 3.62 4.08 4.10 4.05
Percent of Correct Identifications
Range 2.61 2.72 2.61 2.56 2.56 2.72 2.94 2.94 3.00
5.78 4.39 5.78 5.89 4.83 5.89 6.17 6.17 6.06
24 19 29 80 83 76 82 84 80
Results Table 1 lists the mean proportion of correct regional identifications, as well as accent strength means and ranges per zone. An analysis of covariance on the logit values of the number of correct identifications (with Region, Gender, and Accent strength as explanatory variables) revealed a significant effect of Region: F(2, 114) = 15.859, p = .000, partial η2 = .218. Post hoc analysis (Tukey’s HSD, α = .05) showed significant differences in terms of regional identifiability between the North area on the one hand and the Rand and South areas on the other; the Rand and South did not differ significantly in terms of regional identifiability. There also was a main effect of Accent Strength, F(1, 114) = 36.094, p = .000, partial η2 = .240, as well as an interaction between Region and Accent Strength, F(2, 114) = 5.046, p = .008, partial η2 = .081: Broader accents were easier to identify across the board, but in the Randstad, accent strength did not affect identifiability. There was no effect of Speaker Gender. As in Grondelaers et al. (2015), raters strongly agreed on the strength of the different accents: Reliability among the 19 raters was extremely high (Cronbach’s α = .922). An ANOVA on the accent strength ratings (with Region and Gender as explanatory variables) demonstrated a significant effect of Region, F(1, 120) = 7.122, p = .001, partial η2 = .106. Post hoc analysis (Tukey’s HSD, α = .05) showed significant differences in terms of strength between the South accent (mean accent strength is 4.08) and the Rand and North accents, which did not differ significantly (mean accent strength both 3.50). Again, there was no effect of speaker Gender.
Discussion There are two possible explanations for the much lower identifiability of the North accent in this study (24%) than in Grondelaers et al. (2010), in which Northern speakers were recognized in 77.9% of all cases. To begin with, read-aloud Dutch has been
8
Journal of Language and Social Psychology 00(0)
found to be more difficult to localize than spontaneous Dutch speech (Pinget et al., 2014). A second factor may be the (as yet uncorroborated) suspicion that speakers who contribute voluntarily to the Sprekend Nederland corpus have some confidence in the standard status of their speech, especially when speaking with a low-prestige accent like the Northern. It seems plausible that such speakers reduce their accent as much as possible, as a result of which their speech becomes less recognizable. The fact that the Northern accent was misidentified in 70% of all cases as a Randstad accent in this study (whereas it was classified as a Limburg accent in only 6% of the cases), lends some empirical support to the latter suggestion. In view of the “prestigious accents are mild, non-prestigious accents are broad” stereotype attested in Grondelaers et al. (2015), it is interesting to notice that the perceived mean strength of the high-prestige Randstad-accent in the present data is the same as that of the low-prestige North accent (3.50), and that the Randstad accent is deemed significantly, but not dramatically milder than the South accent (4.08). Crucially, strength ranges in the present study are comparable across the three accent zones, and especially the broader accents—5.78 (N), 6.17 (S), and even 5.89 (R)—are well up the scale. Our data confirm, in other words, that there are broad versions of the Randstad accent which do not index socioeconomically marginal urban speakers. The availability of these speech materials makes it safer to implement a strength variable in the speaker evaluation study, to which we now turn.
Study 2 Method Speech Stimuli. From the clips entered in Study 1, we selected two of the mildest accented, and two of the broadest accented produced by four categories of speakers, namely, male Randstad, female Randstad, male Southern, and female Southern speakers (we exclude the North samples on account of their low identifiability). The 16 selected clips were produced by 15 different speakers, except for the broadly accented male Randstad guise, in which the two clips were produced by the same speaker (Speaker ID 3818); the experimental software was designed to block consecutive presentation of these two clips. Selected clips were regionally identifiable in 83% to 94% of all cases. In order to match stimuli as much as possible on variables which are not relevant to the design, we selected clips produced by adult speakers who sounded their age. Measures. Speech clips were rated on nine traits included in function of the evaluative dimensions superiority, dynamism, and warmth. In light of the conceptual overlap between warmth and dynamism, we independently validated traits in a prior free response task: 251 respondents returned the first three adjectives which came to mind in response to a high-status, a high-dynamism, and a high-warmth representative of four categories of pictures, namely restaurants, workplaces, live music, and couches. High-dynamism pictures were selected in function of a cool and trendy interpretation
Grondelaers et al.
9
of dynamism (rather than the aggressively assertive one in Zahn & Hopper, 1985), and high-dynamism and high-solidarity pictures were, respectively, chosen to maximally differentiate between these evaluative dimensions. In the restaurant category, for instance, the high-status representative featured the Ritz hotel dining room, the highdynamism representative a trendy but not overly expensive sushi restaurant, and the high-warmth representative a cozy Dutch pancake place. The workplace category was represented by an oak-paneled lawyer’s office (high status), the colorful office of an Internet company in a recycled factory hall (high dynamism), and a picture of a male nurse assisting a senior citizen (high warmth). Adjectives eventually selected as traits for the present study represented the most frequent responses in one category (superiority, dynamism, or warmth) while being absent in the two others, and they were all items which are applicable to persons/speakers. For superiority, we included Dutch equivalents of the traits chic, educated, and serious; for warmth we included Dutch equivalents of nice, warm personality, and helpful; dynamism was extracted with the traits modern, hip, and trendy (which are cognates in English and Dutch). In addition to these nine “canonical” scales, we included the traits physically attractive and could be a good newsreader. All traits were presented as Likert-type statements (“According to you this person is x/could be x”) complemented with 7-point scales with a left-pole “disagree” and a right-pole “agree.” Following the 11 traits, respondents were asked to determine in which region the speaker who produced the clip they had just listened to had grown up. In contrast to Study 1, this information was elicited on a dropdown menu with the names of the 12 Dutch provinces and the Dutch equivalents of “Flanders,” “Suriname,” and the “Dutch Caribbean.” We did this for two reasons, the first of which is to accommodate the fact that the respondent sample in Study 2 was more varied, and linguistically less trained than in Study 1, which consisted of linguistics students familiar with the four-way accent zone classification. We also increased the number of possible responses in order not to preempt identification too much in a design which features only two accents (whereas Study 1 featured three): With 15 response options, regional classification cannot be achieved “by exclusion,” and necessitates absolute instead of relative identification. Listener-Judges. A total of 141 native Dutch university or university college students were sampled in the two accent zones from which the stimulus speech had been selected. There were 54 participants from the Randstad (provinces of North-Holland, South-Holland, and Utrecht), and 87 from the South (province of Limburg); 67 were male, 74 were female, and their average age was 21.6 years, ranging from 18 to 30 years. Procedure and Task. The study was digitally administered in order to be able to randomize sound clips. Student assistants who functioned as experimenters recruited listener-judges with the correct demographics (native Dutch, between 18 and 30 years) on university (college) campuses in the Randstad and South areas. Respondents, who participated on a voluntary basis, subsequently accessed the task on their personal devices, or on campus computers, and completed it in the presence of the experimenter.
10
Journal of Language and Social Psychology 00(0)
Table 2. Proportions of Correct Regional Identifications as a Function of Speaker Region, Accent Strength, and Speaker Gender.
Rand Strong Weak South Strong Weak
Female (%)
Male (%)
72.70 76.60 68.80 71.10 92.90 49.30
68.80 67.70 69.90 68.40 86.90 50.00
After candidate respondents had been recruited, they first answered four demographic questions (pertaining to gender, mother tongue, education, and the region in which they had grown up) to determine whether they met the criteria for participation. Candidate respondents who failed on any of these criteria were automatically excluded by the software. Legitimate respondents received the following instruction (translated from Dutch): We want to find out whether listeners can get a good idea, on the basis of no more than voice characteristics, of the personality of a person they do not know and do not see, but can only hear. We will therefore let you hear 16 younger and older students who have produced voice audition phrases for a national broadcaster. The content of these sentences is not relevant. We will ask a few questions about each of the students. You will hear each fragment twice.
After they had read the experimental task, the participants’ written consent was obtained. They then proceeded with an example clip (included in Study 1, but not in Study 2, produced by a moderately accented, male North Speaker who could be easily identified as such) to get acquainted with the setup. They listened to the clip, and were given the chance to ask questions. When everything was clear, they proceeded with the actual experiment, in which all respondents evaluated all 16 stimulus clips in a repeated measures design. After that, respondents answered a debriefing question (“what do you think this investigation was about?”) on an open response item. While about half of the respondents had guessed that “different regional accents” were somehow involved in the study, nobody detected our accent strength manipulation. One respondent was excluded on account of the duration of his participation (46 minutes on an average duration of 18 minutes), six others were eliminated because their comments suggested acquaintance with the work of the authors, or with predecessors of the present study.
Results Table 2 lists proportions of correct regional identifications. For the purposes of this experiment, “correct” entails that a speaker of a Randstad-clip was identified as having
11
Grondelaers et al.
Table 3. Factor Loadings of 10 Scales on 3 Principal Components After Varimax Rotation.
Modern Hip Trendy Chic Highly educated Serious Nice Warm personality Helpful Attractive
Dynamism
Warmth
Superiority
.827 .888 .893 .411 .448 −.013 .129 .117 .048 .705
.055 .089 .051 −.134 .089 .096 .877 .876 .862 .287
.273 .075 .125 .685 .706 .879 .001 −.028 .101 .236
Note. Loadings >.6 are printed in boldface.
grown up in North Holland, South Holland, or Utrecht, and that a speaker of a South clip was identified has grown up in Limburg or Brabant. On average, 70.2% of the clips were correctly identified in Study 2, but there are significant identifiability differences between the cells in Table 2, χ2(3) = 11.6, p < .005, C = .15. Specifically, mild Southern accents were less easily identified (Z = −2.46, p < .05), while broad Southern accents were more easily identified (Z = 2.34, p < .05). A closer look at the outcomes reveals that incorrectly classified mildly accented Southern speech was located for the most part in the adjoining Flanders (4.9%) and Gelderland areas (34.6%), which are logical “mismatches”: The Flemish province of Limburg used to be a political unity with Dutch Limburg up to 1839 (and features a highly similar accent), and it is virtually impossible for nonexperts to distinguish between the northern Limburg and southern Gelderland accents which both belong to the Klevelandish dialect area. While we do not globally reject the weakly accented South samples from the forthcoming analyses, we restrict all the subsequent statistics to samples which have been correctly identified. Next, we computed two principal component analyses (PCAs; SPSS, factor analysis procedure) on the data. Our initial analysis with factor selection criterion eigenvalue > 1 and varimax rotation returned a three-component solution which we rejected on account of the fact that the trait could be a newsreader loaded on all three components. The PCA which was recomputed without this trait (listed in Table 3) explained 74.8% of the variance in the ratings. Separate PCAs on splits of the total sample (as determined by [in]correct regional identification, speaker gender, respondent gender, and the presence or absence of the word “accent” in the debriefing question) yielded structurally identical three-component solutions. In view of the items which loaded on them, the three components could straightforwardly be labelled as dynamism, warmth, and superiority. For each of the 16 samples a score was computed per dimension. We used the average of the scales that received the highest loading on a component (the boldfaced scales in Table 3); this procedure
12
Journal of Language and Social Psychology 00(0)
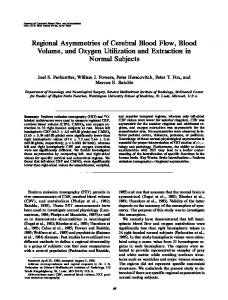
Figure 1. Standardized superiority scores as a function of speaker region, gender, and accent strength.
has the advantage that the dimension scores directly reflect the scale ratings, and that we do not claim the absence of any correlation between the three dimensions. Figures 1 to 3 illustrate the aggregate scores of the correctly identified samples, transformed as z scores, on superiority, dynamism, and warmth. In view of the fact that data analysis is restricted to evaluations of speech which was correctly identified in regional terms, data were analyzed with a linear mixed effects regression analysis (using the R packages lmer and lmerTest), which is well suited to handling missing values locally, as a consequence of which respondents are not deleted “list-wise” when any of their data points are missing. As a result, our respondent sample still totals 141 respondents, but the number of valid observations per speech clip varies (between 57 and 133). All factors were encoded using dummy coding. For all models discussed below, the random effects structure (with listeners as random effect) that was selected included both a random intercept for listeners and random slopes for speaker accent strength, region, and gender in combination with listeners. Fixed effects that were taken into consideration were Speaker Region, Speaker Gender, Speaker Accent Strength, Listener Region, Listener Education Level, and Listener Gender, and their two- and three-way interactions. Significance of fixed effects was established by comparing nested models with an identical random effects structure (with estimates in these models chosen to optimize the log likelihood criterion). We selected the best model on the basis of the AICs. A remarkable outcome was that we could remove all fixed listener
Grondelaers et al.
13
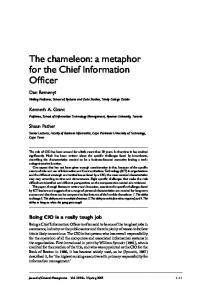
Figure 2. Standardized dynamism scores as a function of speaker region, gender, and accent strength.
Figure 3. Standardized warmth scores as a function of speaker region, gender, and accent strength.
14
Journal of Language and Social Psychology 00(0)
effects (Listener Region, Listener Education, and Listener Gender) from the model on account of nonsignificance. The average superiority scores as a function of Speaker Region, Speaker Gender, and Speaker Accent Strength can be found in Figure 1. The best model contained all two-way interaction effects, but not the three-way interaction. There was a significant main effect of Speaker Region, b = −.617, t(445.4) = −9.193, p = .000, with Randstad-flavored speech being rated as superior to South-flavored speech, and a significant main effect of Speaker Gender, b = .207, t(701.2) = 3.496, p = .001, reflecting generally higher superiority ratings for female than for male speech. There was a main effect of Accent Strength, b = −.211, t(742.3) = −3.624, p = .000— broader accents are deemed less superior in general—but also two significant interactions involving Accent Strength: The interactions between Speaker Region and Accent Strength, b = .418, t(1689.0) = −6.529, p = .000, and Speaker Gender and Accent Strength, b = −.209, t(1689.0) = −3.257, p = .000, reflect that the impact of accent strength is limited for the most part to Southern speech and to female speech. The interaction between Speaker Gender and Speaker Region, b = .370, t(1689.0) = 5.770. p = .000, finally, reveals that the inferiority of Limburg speech is limited for the most part to male speakers. In view of the research questions, a number of contrasts were calculated using the R package lsmeans. Although mildly accented female South speech was the only Southern speech to be upgraded on superiority, it was still deemed significantly less superior than mildly accented female Randstad speech; mildly accented female South speech was not, however, deemed less superior than broadly accented female Randstad speech. Broadly accented female Randstad speech was evaluated as significantly less superior than mildly accented female Randstad speech, but there is no significant difference between broadly and mildly accented male Randstad speech. On dynamism too, all main effects and two-way interactions (but not the three-way interaction) were significant. Randstad speech, b = −.456, t(410.6) = −5.437, p = .000; female speech, b = .284, t(608.9) = 4.276, p = .000; and mildly accented speech, b = −.289, t(703.7) = −4.515, p = .000, were found to be more dynamic across the board. The interactions between Speaker Gender and Accent Strength, b = .410, t(1233.8) = 5.764, p = .000, and between Speaker Region and Accent Strength, b = −.444, t(1244.6) = −6.087, p = .000, demonstrate that it is especially the broadly accented males and the broadly accented Southern speakers who are deemed less dynamic, while the Speaker Region × Speaker Gender interaction, b = −.319, t(1221.0) = −4.452, p = .000, indicates that it is the Randstad females in particular who are deemed the most dynamic. Although broadly accented female Randstad speech is the most dynamic in Figure 2, it is not, however, significantly more dynamic than mildly accented female Randstad speech. The Randstad females, however, represent the only group in this experiment which is not deemed less dynamic by having a broader accent (Randstad males, South males, and South females are deemed significantly less dynamic with a broader accent). The warmth ratings manifest a significant three-way interaction, b = −.435, t(1688.0) = −4.452. p = .001, as can be inferred from the histogram in Figure 3, in
Grondelaers et al.
15
which broadly accented male Randstad speech is deemed much more negative than all other accents.
Discussion The divergence between the identifiability ratings in Studies 1 and 2 can be accounted for on two grounds. The first is that the absolute identification procedure which emanates from having to choose between 15 response options is more difficult than a three-way choice which allows a “by exclusion” strategy. A second plausible factor could be the fact that the respondents in Study 1 were second-year students of linguistics, while the respondent panel in Study 2 was much more diverse. In spite of the absence of any formal training in accent recognition, it is highly likely that future linguists are more sensitive to accent variation. However that may be, the lower identifiability of the milder South accent did not pose any problems for Study 2: The large proportion of “logical” mismatches in the adjoining areas (Belgian Limburg and Gelderland) reduced concern, and the large participant sample allowed us to limit statistical analysis of the evaluation data to correctly identified samples. The speaker evaluation data have shown that all the factors investigated in this article affect accent-triggered impression formation, and nuance the perceptual picture obtained in previous work. To begin with, our data confirm the oft-noted correlation between milder accents and a more positive evaluation (Research Question 1), although the impact of this correlation is restricted for the most part to the South accent. A possible explanation for this asymmetry could be that accent strength allows speakers to render their membership of a stigmatized group gradable: By reducing their Southern accent in NSD, Limburg speakers can “decrease” their allegiance to a negatively stereotyped group in favor of a (more) national identity. In Grondelaers et al. (2011), the empirically confirmed tolerance for some regional accent variation in NSD was interpreted as a license for a “dual identity” (national plus regional); the impact of accent strength suggests that this dual identity is to some extent a dynamic commodity. The absence of strength impact on the superiority perceptions of the Randstad accent may indicate not only that traditional prestige is an inalienable, stable social meaning of that accent but also that membership in positively stereotyped groups does not have to gradable. More important, accent strength variation has been shown to neutralize to some extent the categorical prestige differences reported in earlier work: The fact that mildly accented female South speech was not deemed inferior to broadly accented female Randstad speech renders earlier conceptualizations of NSD accents as consisting of one prestige accent (the Randstad flavor) and many low-prestige accents (all others) untenable. The PCA in Table 3 confirmed that ratings in Study 2 correlated into a straightforwardly extractable dynamism dimension, which pertains to perceptions of media cool and trendiness (Research Question 2). The evaluation of Southern speech was stratified almost identically by dynamism and superiority. For female Randstad speech, however, the combined superiority and dynamism data represent a fascinating perceptual
16
Journal of Language and Social Psychology 00(0)
implementation of the Conformity Paradox (Research Question 3). As predicted by Labov (2001), Randstad females are allowed less than Randstad males to deviate from prescribed norms: When they sound broader than the Randstad accent is supposed to sound, they are downgraded on the superiority evaluations associated with prescribed standard behavior (Randstad males, crucially, are not punished for “excess” accent). On the dynamism dimension, however, the Randstad females’ broadness transgression is not penalized: The fact that Randstad females are deemed dynamic for sounding somewhat broader converges with earlier evidence that Randstad females spearhead nonstandard phonetic and syntactic innovation in NSD.
General Discussion We hope to have shown, first, that there are good reasons to reconsider dynamism as a pivotal evaluation dimension in speaker evaluation studies of language variation. The existence of dynamism evaluations reveals a language attitude architecture which is richer than the “the now pervasively recognized [. . .] judgement clusters of status versus solidarity traits” (Giles & Coupland, 1991, p. 35), in which “the former values [are] typically associated with standard(ized) varieties, the latter with non-standard varieties” (Giles, Hewstone, Ryan, & Johnson, 1987). Dynamism evaluations are increasingly associated with so-called “neo-standards” (Auer, 2017), prescriptively rejected, but vital modern varieties such as Flemish Tussentaal or Danish Low Copenhagen speech, which have even been claimed to be vital on account of their evaluation as modern, cool, hip, and assertive (Grondelaers & Kristiansen, 2013; Kristiansen, 2009). Sociolinguists who carry out speaker evaluation experiments to investigate standard language dynamics had better include dynamism measures to lay bare the perceptual correlates (if not “boosters”) of these emergent standard varieties. The second main finding in this article—the pivotal relevance of accent strength variation on regional accent evaluation—is equally indicative of changing conceptualizations of what “good” and “bad,” and standard and non-standard accents are. What seems to be happening in NSD is that the originally qualitative distinction between one good accent (the Randstad) and many bad accents is being remapped on a strength dimension: Almost all accents go, as long as they are not too broad. This finding has two important consequences. It is, to begin with, no longer justified to distinguish between intrinsic high and low prestige in the Netherlandic accent repertoire. A second consequence is that the evaluation data in this investigation are much more convergent with current speech production facts. While Grondelaers et al. (2010) and Grondelaers and van Hout (2010) revealed a wider acceptance of regional accent variation in general, the present data offer a perceptual explanation for the fact that mild versions of non-Randstad accents are audibly penetrating iconic standard speech contexts such as news bulletins on the public Dutch broadcaster NOS (short for “Nederlandse Omroep Stichting,” “Dutch Broadcasting Cooperation”). A case in point is Limburg-born news show host Twan Huys, who is immensely popular in spite of a mild but conspicuous Southern flavor which may not have been tolerated 20 years ago.
Grondelaers et al.
17
Observe, finally, that the absence of female speech in Dutch speaker evaluation research is likely to have impoverished the available perceptual models of standard language dynamics in the Netherlands: If females are both gatekeepers of the norm, and heralds of change, they cannot be absent in any design devoted to uncovering the seeds of variation and change. In this specific study, it is unlikely that we would have been able to bring out the dynamism dimension if we had restricted our experimental stimuli to male speech. In view of the fact that females are known to spearhead nonstandard innovations, and given the fact that such innovations are typically deemed inferior but dynamic in the first stage of their emergence (see Grondelaers et al., in press), it is not only essential to extract dynamism perceptions and include female speakers in any speaker evaluation design: There is a general need to extract perceptions and evaluations at the finest possible level of granularity.
Conclusion In this article, we have reported two studies into the perception and evaluation of regional accent variation in NSD. The first study demonstrated that young Dutch respondents converge on the strength of milder and broader versions of three regional accents, the high-prestige Randstad accent, and the allegedly lower prestige North (Groningen) and South (Limburg) accents. As a result, it was possible to experimentally isolate a broader version of the Randstad accent that is not associated with socioeconomically downgraded urban speech, and a milder version of the Limburg accent that is still identifiable as Limburgish. Next, we entered milder and broader versions of the Randstad and Limburg accents in a speaker evaluation experiment which investigated the impact on accent-triggered impression formation of accent type (higher vs. lower prestige), accent strength (broad vs. mild), and speaker gender (male vs. female), and which extended the set of evaluative dimensions beyond superiority and warmth to include dynamism. Whereas previous studies had invariably confirmed the superiority of the Randstad accent but also revealed some tolerance for the Limburg accent, the new data provide much more perceptual detail. To begin with, milder versions of the Limburg accent were sufficiently upgraded on superiority to reconsider the “one accent good, all other accents bad” conception of the Netherlandic repertoire. And although dynamism stratified accent evaluations in much the same way as superiority, it turned out to be a crucial determinant of female Randstad speech: In convergence with Labov’s Conformity Paradox, Randstad females were downgraded on superiority for having a broader accent, but they represented the only group which was deemed dynamic for sounding somewhat broader. We have theorized our findings in terms of a “reset” in current conceptualizations of accent prestige, whereby an originally qualitative divide is being remapped on a gradable dimension: No accent is intrinsically nonprestigious, as long as it is not too broad. On a methodological level, we have pleaded for a finer grained and wider scoped experimental extraction of evaluations and perceptions to get a better grip on standard language variation and change.
18
Journal of Language and Social Psychology 00(0)
Our findings are subject to one important limitation. In Study 2, milder versions of the South accent turned out to be more difficult to recognize for a panel of respondents that was more diverse than the linguistics students in Study 1. In order to include mild accent guises which are sufficiently identifiable to less expert raters, follow-up research should implement the mild–broad contrast in terms of a distinction between broad and broader accents (rather than selecting accents on opposite poles of the strength scale). In view of the fact that statistical analysis could be restricted to evaluations of correctly identified samples, the main claims of the present article are not affected by this drawback.
Appendix Experimental Sentences in Stimulus Set a of van Leeuwen et al. (2016) 1. Na zijn reis maakt hij een kaart van de onverharde wegen en die zet hij direct op een DVD. “After his journey he makes a map of the unpaved roads and he puts it directly on a DVD.”
2. Na de tocht in de regen vaart de kapitein blij weg. “After the trip in the rain the captain sails away gladly.”
3. Die sombere muziek had zij beleefd als schilderen in grijs en zwart. “She had experienced this sombre music as painting in grey and black.”
4. De sprei die jij bracht heeft Suzan altijd al gewild, omdat die zo leuk staat bij het gele laken. “Susan had always wanted the bedspread you brought, because it suits the yellow sheet so nicely.”
5. Door die oordopjes heeft Willem het mooie stereo effect van de radio niet goed gehoord. “Because of these earplugs, Willem didn’t hear the beautiful stereo effect of the radio very well.”
6. Kort na het wielerfestijn verbruikte Dries de rest van de deodorant. “Shortly after the cycling festival Dries consumed the rest of the deodorant.”
Grondelaers et al.
19
7. Jeannette lacht nadat ze door een onbekende persoon is gekust. “Jeannette laughs after having been kissed by an unknown person.”
8. Het echtpaar adopteert voor veel geld een tweejarig weesje. “The couple adopts a two-year-old orphan for a lot of money.”
9. Natuurlijk ga je van hard werken heus niet dood, maar in andere opzichten is de prijs soms hoger dan je dacht. “Of course you are not going to die from hard work, but in other ways the price is sometimes higher than you thought.”
10. Vreugdevol knort het varken in de wei, een karakteristiek geluid. “Happily, the pig is grunting in the meadow, a characteristic sound.”
Acknowledgments The authors would like to thank editor Howard Giles and four anonymous reviewers for their valuable comments and their guidance on the revisions of this article.
Declaration of Conflicting Interests The author(s) declared no potential conflicts of interest with respect to the research, authorship, and/or publication of this article.
Funding The author(s) received no financial support for the research, authorship, and/or publication of this article.
References Auer, P. (2017). The neo-standard of Italy and elsewhere in Europe. In M. Cerruti, C. Crocco & S. Marzo (Eds.), Towards a new standard: Theoretical and empirical studies on the restandardization of Italian (pp. 365-374). Berlin, Germany: Mouton. Boyd, S. (2003). Foreign-born teachers in the multilingual classroom in Sweden: The role of attitudes to foreign accent. International Journal of Bilingual Education and Bilingualism, 6, 283-295. Bradac, J. (1990). Language attitudes and impression formation. In H. Giles & W. P. Robinson (Eds.), Handbook of language and social psychology (pp. 387-412). Chichester, England: Wiley. Brennan, E. M., & Brennan, J. S. (1981). Accent scaling and language attitudes: Reactions to Mexican American English speech. Language and Speech, 24, 207-221. Brennan, E. M., Ryan, E. B., & Dawson, W. E. (1975). Scaling of apparent accentedness by magnitude estimation and sensory modality matching. Journal of Psycholinguistic Research, 4, 27-36.
20
Journal of Language and Social Psychology 00(0)
Cargile, A. C., & Giles, H. (1998). Language attitudes toward varieties of English: An AmericanJapanese context. Journal of Applied Communication Research, 26, 338-356. Cuddy, A. J., Fiske, S. T., & Glick, P. (2008). Warmth and competence as universal dimensions of social perception: The stereotype content model and the BIAS map. Advances in Experimental Social Psychology, 40, 61-149. Garrett, P. (2005). Attitude measurements. In A. Ulrich, N. Dittmar, K. J. Mattheier & P. Trudgill (Eds.), Sociolinguistics: An international handbook of the science of language and society (pp. 1251-1260). Berlin, Germany: Mouton. Giles, H. (1971). Patterns of evaluation in reactions to RP, South Welsh, and Somerset accented speech. British Journal of Social and Clinical Psychology, 10, 280-281. Giles, H. (1972). The effect of stimulus mildness-broadness in the evaluation of accents. Language and Speech, 15, 262-269. Giles, H., & Bourhis, R. Y. (1973). Dialect perception revisited. Quarterly Journal of Speech, 59, 337-342. Giles, H., & Coupland, N. (1991). Language: Contexts and consequences. Milton Keynes, England: Open University Press. Giles, H., Hewstone, M., Ryan, E. B., & Johnson, P. (1987). Research on language attitudes. In U. Ammon, N. Dittmar & K. J. Mattheier (Eds.), Sociolinguistics. An international handbook of the science of language and society (pp. 585-597). Berlin, Germany: Walter de Gruyter. Giles, H., & Watson, B. (2013). The social meanings of language, accent and dialect: International perspectives on speech styles. New York, NY: Peter Lang. Grondelaers, S., & Kristiansen, T. (2013). On the need to access deep evaluations when searching for the motor of standard language change. In T. Kristiansen & S. Grondelaers (Eds.), Language (de)standardization in Late Modern Europe: Experimental studies (pp. 9-52). Oslo, Norway: Novus. Grondelaers, S., & Speelman, D. (2013). Can speaker evaluation return private attitudes towards stigmatized varieties? Evidence from emergent standardization in Belgian Dutch. In T. Kristiansen & S. Grondelaers (Eds.), Language (de)standardization in Late Modern Europe: Experimental studies (pp. 171-191). Oslo, Norway: Novus. Grondelaers, S., van Gent, P., & van Hout, R. (in press). On the inevitability of social meaning and ideology in accounts of syntactic change. Evidence from pronoun competition in Netherlandic Dutch. In T. Karoli Christensen & T. J. Jensen (Eds.), Explanations in sociosyntax. Dialogue across paradigms. Amsterdam, Netherlands: John Benjamins. Grondelaers, S., & van Hout, R. (2010). Is Standard Dutch with a regional accent standard or not? Evidence from native speakers’ attitudes. Language Variation and Change, 22, 221-239. Grondelaers, S., & van Hout, R. (2011). The standard language situation in the Low Countries: Top-down and bottom-up variations on a diaglossic theme. Journal of Germanic Linguistics, 23, 199-243. Grondelaers, S., van Hout, R., & Speelman, D. (2011). A perceptual typology of standard language situations in the Low Countries. In T. Kristiansen & N. Coupland (Eds.), Standard languages and language standards in a changing Europe (pp. 199-222). Oslo, Norway: Novus. Grondelaers, S., van Hout, R., & Steegs, M. (2010). Evaluating regional accent variation in Standard Dutch. Journal of Language and Social Psychology, 29, 101-116.
Grondelaers et al.
21
Grondelaers, S., van Hout, R., & van der Harst, S. (2015). Subjective accent strength perceptions are not only a function of objective accent strength. Evidence from Netherlandic Standard Dutch. Speech Communication, 74, 1-11. Heijmer, T., & Vonk, R. (2002). Effecten van een regionaal accent op de beoordeling van de spreker [Effects of a regional accent on speaker evaluation]. Nederlands Tijdschrift voor de Psychologie, 57, 108-113. Kristiansen, T. (2009). The macro level social meaning of late modern Danish accents. Acta Linguistica Hafniensia, 40, 167-192. Labov, W. (2001). Principles of Linguistic Change: Vol. 2. Social factors. Malden, MA: Blackwell. Lambert, W. E., Hodgson, R. C., Gardner, R. C., & Fillenbaum, S. (1960). Evaluative reactions to spoken languages. Journal of Abnormal and Social Psychology, 66, 44-51. Lass, N., Atkins, T., & Squires, R. (2002). Listeners’ perceptions of and attitudes toward Hispanic-, Asian-, and Arabic-accented speakers. Journal of the Acoustical Society of America, 111, 2364. Lee, R. (1971). Dialect perception: A critical review and re-evaluation. Quarterly Journal of Speech, 57, 410-417. Loudermilk, B. C. (2015). Implicit attitudes and the perception of sociolinguistic variation. In A. Prikhodkine & D. R. Preston (Eds.), Responses to language varieties: Variability, processes and outcomes (pp. 137-156). Amsterdam, Netherlands: John Benjamins. Mulac, A., Hanley, T. D., & Prigge, D. Y. (1974). Effects of phonological speech foreignness upon three dimensions of attitude of selected American listeners. Quarterly Journal of Speech, 60, 411-420. Nesdale, A. R., & Rooney, R. (1990). Effect of children’s ethnic accents on adults’ evaluations and stereotyping. Australian Journal of Psychology, 42, 309-319. Nesdale, D., & Rooney, R. (1996). Evaluation and stereotyping of accented speakers by preadolescent children. Journal of Language and Social Psychology, 15, 133-154. Osgood, C. E., Suci, G. J., & Tannenbaum, P. H. (1957). The measurement of meaning. Urbana: University of Illinois Press. Pinget, A.-F., Rotteveel, M., & Van de Velde, H. (2014). Standaardnederlands met een accent— Herkenning en evaluatie van regionaal gekleurd Standaardnederlands in Nederland [Identification and evaluation of regionally flavored Standard Dutch in the Netherlands]. Nederlandse Taalkunde, 19, 3-45. Rodriguez, J. I., Cargile, A. C., & Rich, M. D. (2004). Reactions to African-American vernacular English: Do more phonological features matter? Western Journal of Black Studies, 28, 407-414. Rosseel, L. (2017). New approaches to measuring the social meaning of language variation: Exploring the Personalized Implicit Association Test and the Relational Responding Task (Unpublished doctoral dissertation). KU Leuven, Belgium. Ryan, E. B. (1973). Subjective reactions toward accented speech. In R. W. Shuy & R. W. Fasold (Eds.), Language attitudes: Current trends and prospects (pp. 60-73). Washington, DC: Georgetown University Press. Ryan, E. B., & Carranza, M. A. (1975). Evaluative reactions of adolescents towards speaker of Standard English and Mexican American accented English. Journal of Personality and Social Psychology, 31, 855-863. Smakman, D. (2006). Standard Dutch in the Netherlands: A sociolinguistic and phonetic description. Utrecht, Netherlands: LOT.
22
Journal of Language and Social Psychology 00(0)
van Bezooijen, R., & Ytsma, J. (1999). Accents of Dutch: Personality impression, divergence, and identifiability. Belgian Journal of Linguistics, 13, 105-129. van Hout, R., De Schutter, G., De Crom, E., Huinck, W., Kloots, H., & Van de Velde, H. (1999). De uitspraak van het Standaard-Nederlands. Variatie en varianten in Vlaanderen en Nederland [Variation and variants in Flanders and the Netherlands]. In E. Huls & B. Weltens (Eds.), Artikelen van de derde sociolinguïstische conferentie [Papers of the third sociolinguistic conference] (pp. 183-196). Delft, Netherlands: Eburon. van Leeuwen, D., Hinskens, F., Martinovic, B., van Hessen, A., Grondelaers, S., & Orr, R. (2016). Sprekend Nederland: A heterogeneous speech data collection. Computational Linguistics in the Netherlands, 6, 21-38. Williams, F. (1970). Psychological correlates of speech characteristics: On sounding “disadvantaged”. Journal of Speech and Hearing Research, 13, 472-488. Zahn, C., & Hopper, R. (1985). Measuring language attitudes: The speech evaluation instrument. Journal of Language and Social Psychology, 4, 113-123.
Author Biographies Stefan Grondelaers is an assistant professor of sociolinguistics at the Centre for Language Studies of the Radboud University Nijmegen. His research focuses on the description and explanation of linguistic variation in the Low Countries, building on experimental and corpus-based techniques. Roeland van Hout is a professor of applied linguistics, sociolinguistics, and dialectology at the Centre for Language Studies of the Radboud University of Nijmegen. His research focuses on linguistic variation and on quantitative research methodology. He is the author of Statistics in Language Research (with Toni Rietveld). Paul van Gent is a masters student of linguistics at the Radboud University Nijmegen, and a freelance software developer and IT consultant. He investigates language attitudes and ideologies in the Low Countries building on experimental techniques. He uses his IT skills to improve the operational efficiency of experiments.