This method uses a self-organizing map (SOM) neural network to measure similarity between the features of digits and the features of the indicators associated ...
International Journal of Computer Applications (0975 – 8887) Volume 98– No.4, July 2014
Recognition of Multi-font English Numerals using SOM Neural Network Hamid Hassanpour
Najmeh Samadiani
Department of Computer Engineering and Information Technology, Shahrood, Iran
Department of Computer Engineering and Information Technology, Shahrood, Iran
ABSTRACT In this paper a new scheme is proposed for off-line recognition of multi-font numeral, using neural networks. Recognition of numerals has been a research area for many years because of its various applications. But there wasn’t much research done for recognition of multi-font numerals. The approaches proposed so far, suffer from larger computation time and training because they must have a set of training samples per each font. They can be extended to recognize many more fonts but the accuracy decreases rapidly. So as to eliminate these drawbacks, in this paper, a method is presented which recognizes 30 different fonts of different sizes varying from size 10 to 28, with an accuracy of 99.55% on a database of 2000 numeral images. The purpose of this study is to provide a new method to recognize digits based on neural network that can identify the same symbols after training without limitation on the type of the font. In the proposed method, a high accuracy rate is achieved in recognizing digits by extracting the appropriate features without the need for complex neural network architecture. This method uses a self-organizing map (SOM) neural network to measure similarity between the features of digits and the features of the indicators associated with the digits from 0 to 9 obtained in the training stage. In this method, one sample is used for each digit to train the network. So, the proposed method can be used to recognize typed letters without limitation on fonts.
General Terms Pattern Recognition, Neural Networks, OCR
Keywords OCR; numeral recognition; self-organizing map (SOM); similarity measure
1. INTRODUCTION Recognition of numerals has been a research area for many years because of its various applications such as recognizing bank notes, car license plate and barcode recognition. Although recognition of printed/handwritten numerals is studied topic and many techniques of recognition of both machine and hand printed character are available in the literature but not much work has been reported on the recognition of multi-font numerals, in recent times [1]. Digits recognition has been a focus of many studies depending on the type of features extracted and the different ways of extracting them among different languages. They are Neural Networks, Hidden Markov Models, Fuzzy Logic designs, Knowledge-Based systems, Syntactical Methods and Support Vector Methods. A system is made to develop an algorithm for recognition of machine printed isolated Kannada vowels and numerals of
different font size and style using modified invariant moments and that are invariant with respect to rotation, scale and translation by [2]. A minimum distance nearest neighbor classifier is adopted for classification. The proposed algorithm is experimented on 1800 images of vowels and 1000 images of numerals. The experimental results confirm the recognition accuracy as 97.7% for vowels and 98.92% for numerals. A combined method is presented to recognize multi-font Persian digits [3] . After computing average vector distance and angle of each zone of image as feature vector, it uses fuzzy sets to face with recognition problem. Then defuzzification is done and the three most probable candidates of numbers are selected. These candidates are post-processed with another fuzzy recognition system which uses the other features of numerals. Experimental results on a dataset consisted of 216 samples in 24 variant fonts show accuracy 97.5%. In [4] a neuro-fuzzy inference engine is proposed to recognize multifont Persian digits. In this system, structural features are employed and Mamdani fuzzy inference engine is used to conclude fuzzy rules. Features of 33 variant types of fonts are trained on a perceptron neural network. The obtained recognition rate is 97% for the Farsi numeral characters except Farsi character numeral 4, resulting in total 95% recognition rate. Lingaraju et al. [5] proposed a method for recognition of numerals using Hermite curves. The Hermite control points and tangent vectors are used as main features. The method requires size normalization and thinning as a preprocessing step. The recognition time reported was 5.21 seconds and is relatively large. Hanmandlu et al. [6] proposed a fuzzy based approach in which binary image of numeral is partitioned into a fixed number of sub images called boxes after pre-processing and normalization. The features consisting of normalized vector distances and angles from each box are obtained and a fuzzy function based on normalized distances is selected and applied in recognition of 30 various font English numerals. This method requires thinning and normalization. Also the method requires larger computation time and the accuracy of 98.12% is achieved. Santosh Arjun et al. [7] proposed a method which recognizes 17 different fonts of different sizes varying from size 8 to 72, with an accuracy of 99.76% on a database of 2890 numeral images. In this method Euler number of a numeral is used to characterize the numbers into different groups. Dhandra et al. [1] presented a thinning free approach for recognition of multi-font English numerals. The outer densities of pixels for each of the direction are computed in four direction viz. bottom, top, left and right. The ratios of these densities are taken with the total area of the cropped numeral image and are stored in a feature vector. A decision tree based minimum distance nearest neighbor classifier is used to classify English numerals by varying the size of numeral image between sizes 8 to 72 for 16 different font styles. The total of 3200 numeral
37
International Journal of Computer Applications (0975 – 8887) Volume 98– No.4, July 2014 images tested and the overall accuracy of classification is found to be 99.78%. A multi-font and multi-size system is proposed by Rani et al [8]. Experiments with Gabor features based on directional frequency and Gradient features based on gradient information of an individual digit to identify as Gurumukhi or English are reported. 1870 trains and tests samples are in 17 various fonts in sizes 10 to 28 and accuracy 95.29% and 98.12% is achieved for Gradient and Gabor features, respectively.
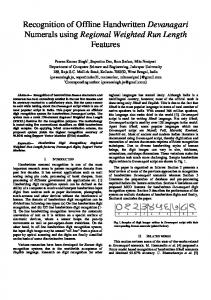
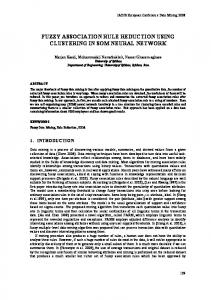
Tahoma” in sizes 10, 11, 12, 14, 16, 18, 20, 22, 24, 26, 28. Therefore, the total number of data base samples is 2000. Figure 1 shows examples of various fonts of each digit in the data base. For preparing the training set, only one sample of each category has been chosen.
Despite extensive studies conducted to recognize characters, existing methods have a major problem, being very sensitive to the fonts in testing phase. This problem particularly causes higher error rate when the existing methods are used to recognize digits in different fonts rather than the training samples. Therefore, the size of the data base of existing methods is too large so that they would be a representative per font and size in the data base during the training stage. Also, the number of available fonts increases over time to satisfy different tastes. Therefore, the existing OCR methods are not able to recognize these new fonts and need to change. But if there was an OCR system persistent to changes in fonts, there would not be any interruption in samples recognition. This paper proposes such a system. In this paper, first, some preprocessing are done to prepare the image for extracting features. Then simple methods are used to select appropriate features from the numeral images. Afterwards, the extracted features will be the inputs to SOM neural network. This network will classify the images and recognize characters in high accuracy. Only one train sample is used and in the proposed method it doesn’t need to have a set of train sample per each font, so the train set is small and it increases speed of recognition. Kohonen’s Self-Organizing Map (SOM) is an unsupervised learning algorithm and a powerful tool used in many areas such as data mining, analysis, classification and visualization [9]. As SOM is used, Euclidean distance compares instances of a class but in this paper, similarity measure is used instead of using Euclidean distance for comparing the similarity between input digit’s feature and various neurons’ weight. One of the contours of the proposed method in this paper is that the network needs small number of samples in each class during a training phase. After the training phase, the system will be able to recognize digits, similar in sizes, fonts and different modes. The following sections are focused in this paper: In Section 2, the data base is introduced. The method and recognizing digits’ steps are described in Section 3. Section 4 includes the implementation results of the proposed method. Finally the conclusions are drawn in Section 5.
2. DATA BASE DETAILS The data base used in this paper is binary images of English numerals with different fonts and sizes. This data base includes 200 samples of each character that are in 30 fonts: “Times, Times new roman, Arial, Calibri, Cambria, ArialRoundedMTBold, Georgia, MicrosoftSansSerif, Comic, CenturySchoolBook, Garamond, Verdana, Coolvetica, CourierPS, Palatino, Bookman, NewCenturySchoolBook, Avant Garde, Courier, Lucida Bright, Lucida Sans, Book Antiqua, Dejavu sans serif, Trebuchet MS, Lucida Console, Estranglo Edessa, Century gothic, Sylfean, Shruthi and
Figure 1: Samples of font styles used under study.
3. METHODOLOGY The proposed method for recognizing or classifying digits has five steps. First, several pre-processing such as rotating and resizing digits are done in order to do normalization. Second, the feature vector is extracted. The images are divided into two parts based on center of the images. Since the images are in binary, counting the number of ones in rows and columns of each binary image in each part of that results in a feature vector. As stated earlier, classifying the data is done based on their similarity to each other. Third, according to the characteristics of the data feature vector, an appropriate similarity measure should be selected. Fourth, SOM network is trained to determine the suitable representative for each of the different data categories. Finally, the network is evaluated based on test data.
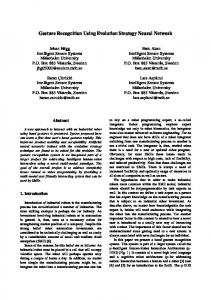
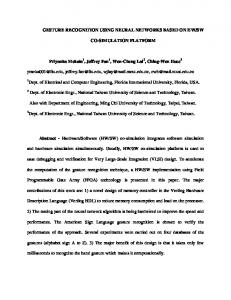
3.1 Preprocessing Before forming the feature vector, some pre-processing should be done on the input image. When digits are being scanned, noise is usually associated with them and a median filter should be used to remove it. Then, the images are rotated 45 degrees in the opposite direction clockwise and the digit is separated from the background for each digit image by extracting the smallest rectangle surrounding each digit. Since the fonts and sizes of different digits are not the same, the size of their surrounding rectangular will not be the same either. Thus, for normalizing images sizes, they are resized to 30x30 pixels similar to [10]. The resizing is done with using the nearest neighborhood interpolation method. This method is simple and without complex mathematical calculations which makes it suitable for discrete data. In addition, this method is faster than other interpolation methods, such as linear [11], Quadratic [12] and Cubic [13] methods [14]. Figure 2 shows an example of the preprocessing processes for 7.
38
International Journal of Computer Applications (0975 – 8887) Volume 98– No.4, July 2014
Figure 2: A scanned example of 7, rotated in 45 degrees in the opposite clockwise and its rectangle surrounding.
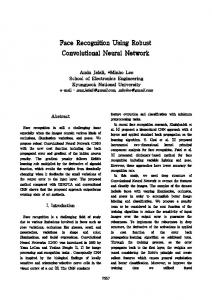
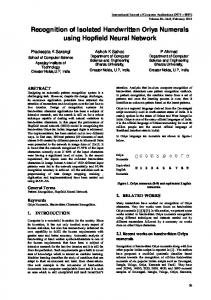
3.2 Feature Extraction Extracting features is the key process and it affects the final recognition performance. Therefore the extracted feature must describe digits of each class and be able to represent a unique characteristic for each set of digits. In other words, different sizes and fonts of each of the 10 digits must have a similar feature vector so that the digits classification is performed accurately. As discussed in Section 2, pixels of a digit are displayed with value of one and background pixels with value of zero. In the proposed method, the image is divided into two parts in horizontal direction based on center of the image. In each part of the image, the total number of 1s in each of the rows and columns is calculated. Since each digit image is stored in 30x30 pixels in the preprocessing phase, every digit is converted to a time series of length 90. Figure 3 shows every time series of sum of 1s in rows and columns in both parts of the image. As highlighted in Figure 3 (f), the number of 1s in the 5th row in the top part of the image is 6. Also, the number of 1s in the 15th column in the top part of the image is 2. The next highlighted numbers in Figure 3(f) show sum of 1s in the 9th row and 8th columns of bottom part of the image, respectively. In Figure 4, time series (feature vector) extracted for four different font samples of digits from zero to nine are displayed. Figure 4 also illustrates that the feature vectors have the same length but they might not have equal amplitude changes. However, the location of local maximum or minimum can be different in the feature vectors for the different fonts of the same digit. Therefore, by using a distance measure such as Euclidean distance, an accurate comparison can’t be made among different digits. While there are similarities between the feature vectors of digits in a class, it is necessary to compare and classify digits by using the similarity measure (See Figure 4).
3.3 Similarity Measure In order to measure similarity between two time series, one similarity measure can be used. There are many similarity measures while each of them is appropriate for certain applications. Further information about similarity measures can be found in [15]. In this study, Jensen similarity measure is used to measure the similarity among feature vectors of data. This measure is a useful tool for assessing the similarity of time series with the same length but with various amplitudes.
10
11 10 9 8
8.5
9
8
8
7.5
7
7
6
6.5
5
6
4
5.5
7 3
6
5
2
4.5
1
4
5 0
0
5
10
15
20
25
3.5
30
4 3
3
0
5
10
(a)
15
0
2
4
6
8
10
12
14
16
(c)
(b)
6 12
5 10
4 8
3
6
4
2
2
1
0
0
5
10
(d) 15
0
20
25
30
0
10
20
30
(e) 40
50
60
70
80
90
(f) Figure 3: A sample of number 7 with the font Times New Roman: a) the time series of total number of ones in consecutive rows in top part of image, b) the time series of total number of ones in consecutive columns in top part of image, c) the time series of total number of ones in consecutive rows in bottom part of image, d) the time series of total number of ones in consecutive columns in bottom part of image, e) resulting from the combined time series a, b, c and d, f) feature vector extracted in length 90. The highlighted numbers show values of sum of specified rows and columns in image of 7. Formula for comparison between two vectors of the same size P and Q based on Jensen similarity measure is expressed by (1). The output of this formula is between 0 and 1. If two sequences P and Q are identical or very similar, the output of the Jensen function will be equal to 0.
39
International Journal of Computer Applications (0975 – 8887) Volume 98– No.4, July 2014 60 45
50 45
40
40
35
50
40 35
30
30 25
30
25 20
20
20 15
15 10
10
5
5
0
10
0
10
20
30
40
50
60
70
80
90
0
0 0
10
20
30
40
(a)
50
50
60
70
80
90
(b)
0
10
20
30
40
50
60
70
80
90
50
60
70
80
90
50
60
70
80
90
(c)
45
50
45
40 45
40
35
40
35
35
30
30
25
30 25 25
20
20 20
15
15
15
10
10
10
5
5
0
0
0
10
20
30
40
50
60
70
80
90
(d)
5
0
10
20
30
40
50
60
70
80
0
90
0
10
20
30
40
(e)
45
(f) 50
50
40
45
45
35
40
35
30
35
30
25
25
20
40
30 25 20
20
15 15
15
10
10
10
5
5 0
0
10
20
30
40
50
60
70
80
90
(g)
50
0
5 0
0
10
20
30
40
50
(h)
60
70
80
90
0
10
20
30
40
(i)
45 40 35 30 25 20 15 10 5 0
0
10
20
30
40
50
60
70
80
90
(j)
Figure 4- The time series of feature vector extracted of digits a) 0, b) 1, c) 2, d) 3, e) 4, f) 5, g) 6, h) 7, i) 8, j) 9. In each of these forms the time series of four different samples of each digit are listed from top to bottom in these fonts “Cambria, Calibri, Times new Roman and Times”. The horizontal axis is the number of features. The ten time series of features extracted from zero to nine in ten different data sets are compared using Jensen similarity measure. Each of these time series are obtained through taking the feature vector average of ten different samples while each sample has a variety of fonts and different states. The results of this evaluation in Table 1 show that Jensen measure considers
40
International Journal of Computer Applications (0975 – 8887) Volume 98– No.4, July 2014 feature vectors extracted from a set of digits as identical (because the function will result in zero) and considers the feature vectors of two non-identical digits as dissimilar (it shows a number above 0.1, hence as threshold point). Table 1- Evaluated similarity between feature vector extracted from different digits using Jensen measure.
Zero One
Zero
One
Two
Three
Four
Five
Six
Seven
Eight
Nine
0
0.287
0.230
0.154
0.208
0.205
0.132
0.152
0.067
0.097
0
0.179
0.276
0.128
0.213
0.314
0.151
0.324
0.322
0
0.146
0.295
0.330
0.390
0.194
0.236
0.261
0
0.315
0.205
0.266
0.146
0.105
0.172
0
0.230
0.144
0.201
0.253
0.293
0
0.180
0.181
0.194
0.214
0
0.267
0.143
0.205
0
0.190
0.161
0
0.133
Two Three Four Five Six Seven Eight Nine
3.4 Structure of Network In this study, the neural network SOM is used for classifying digits. This network has one input layer and one output layer [17]. The number of inputs is 90 which is equal to the length of the feature vector. Since each digit is placed in a distinct class, this network has 10 neurons in output layer. During the training stage, the network weights are initialized with a random number which is smaller than a unit. In this network, unlike conventional SOM networks using the Euclidean distance, Jensen measure is used for determining a winner neuron. Network training is repeated based on SOM networks training principle and the weight of winner neuron is updated in each iteration to determine the best representative of each digit. When the network training is finished, the weight of each of the neurons in output layer is a representative of each of the digits. By applying learning samples in the network, the most similar neuron weight in that sample is selected and the classification is done based on it.
0 parameter shows what proportion of positive classes the learner predicts correctly (3). Precision or positive predictive value is defined as the proportion of the true positives to all the positive results (both true positives and false positives) (4). F-Measure considers both the precision and the recall of the test and is harmonic mean of them (5). Total F-Measure in (6) is sum of the proportion of multiplying F-Measure to true positives of each class in the population. Table 2- Different scenarios for a two-class prediction. Predicted classes
Actual class
Yes
No
Yes
True Positive
False Negative
No
False Positive
True Negative
4. RESULTS To introduce a measure of accuracy and other performance measures, it should be noted that four predictions could be with the assumption of having a set of two classes of yes and no (See Table 2). True Positive (TP) and True Negative (TN) are correct classifications. False Positive (FP) happens when a sample which is truly negative is predicted as positive. Also, False Negative (FN) happens when a positive sample is predicted as negative. Therefore, the accuracy or overall success rate is the proportion of true results (both TP and TN) in the population (2). Also for the evaluation of learner, other parameters are used such as precision, recall, and F-Measure [18]. Recall
41
International Journal of Computer Applications (0975 – 8887) Volume 98– No.4, July 2014 shows need to more accurate features for distinguishing these similar digits. Table 4 shows the accuracy in classing each of the digits. This table illustrates that from a total of 2000 samples in the data base, the proposed method has weakly recognized number 6. This is due to appearance varieties of the digits in different fonts. In order to evaluate the proposed method more accurately, AC and TFM values of classifying data in the experiment are 99.55% and 0.9911, respectively.
One test is performed to evaluate performance of the proposed method. In the experiment, the introduced data base in Section 2 is used. In this experiment, performance of the proposed method in recognizing the digits in different fonts was evaluated. By applying the proposed method, the digits presented in the introduced data base are recognized and classified. Table 3 shows performance of proposed method based on formulas (3, 4, and 5). Values of 1 of PR in Table 3 show the proposed method has been truly classified digits; however the other values of PR illustrate which numerals have been selected as wrong digits. Zero, Eight and one are known instead of 6 and 7, respectively. The similarity between 0, 8, 6 and 7, 1 makes this wrong classifying. It
Table 5 compares the proposed method with the methods used in other researches. As seen in the table, requiring small number of training samples, being persistent to font variant, simple classification method and high accuracy are advantages of the proposed method compared with the other methods.
Table 3- The accuracy of the proposed method on data base. Zero
One
Two
Three
Four
Five
Six
Seven
Eight
Nine
PR
0.97
0.98
1
1
1
1
1
1
0.99
1
R
1
1
1
1
1
1
0.97
0.98
1
1
FM
0.98
0.99
1
1
1
1
0.98
0.99
0.99
1
Table 4 - Accuracy of the proposed method for each digit. Numerals
Accuracy
Zero
100%
One
100%
Two
100%
Three
100%
Four
100%
Five
100%
Six
97%
Seven
98.5%
Eight
100%
Nine
100%
Total accuracy
99.55%
42
International Journal of Computer Applications (0975 – 8887) Volume 98– No.4, July 2014 Table 5- Comparison between the proposed method against the corresponding researches. Number of Test and train samples
Classification method
Number of font styles
accuracy
Hanmandlu et al. [6]
300 tests - 300 trains
Fuzzy combination
30
98.12%
Rani et al [8]
1870 tests-1870 trains
SVM
17
98.12%
Proposed method
2000 tests- 10 trains
SOM neural network
30
99.55%
5. CONCLUSIONS The purpose of this study is to represent a method which is able to identify different digits with different fonts. The proposed method could recognize the digits with 99.55% accuracy by using a simple neural network without using a large training data base. In this method, data are initially rotated and normalized in the preprocessing step. Then, the image is divided into two parts in horizontal direction and the features are extracted by whisking data in the direction of row and column in each part of image. These features are similar for a digit even with different fonts. SOM neural network is used for recognizing and classifying digits in this paper, and a similarity measure is employed to identify the class of data in a neural network. The evaluations in this study show that the proposed method is able to recognize English digits in different fonts with high accuracy after training. Comparing with other methods in the literature shows that requiring small number of training samples, using a simple classification approach, and being persistent to font variant are advantages of the proposed method. Also, the proposed method can be extended and used to recognize typed letters without any limitation on their fonts.
6. REFERENCES [1] Dhandra, B.V., Malemath, V. S., Mallikarjun, H. and Hegadi, R. 2007 Multi-font Numeral Recognition without Thinning based on Directional Density of Pixels, 1st International Conference on Digital Information Management. [2] Mallikarjun, H., Shashikala, P. and Dhandra, B.V. 2010. Multi-font/size Kannada Vowels and Numerals Recognition Based on Modified Invariant Moments, International Journal of Computer Applications, (Special Issue on RTIPPR (2)) 126–130. [3] Ebrahimnezhad, H., Montazer, GH.A. and Jafari, N. 2007 Recognition of Persian Numeral Fonts by Combining the Entropy minimized fuzzifier and fuzzy Grammar, in WSEAS Transactions on Artificial intelligence, knowledge Engineering and data bases. [4] Montazer, G.A., Saremi, H.Q. and Khatibi, V. 2010 A neuro-fuzzy inference engine for Farsi numeral
characters recognition, Expert Applications, 37(9), 6327-6337.
Systems
with
[5] Lingaraju G.M., Sujata, C., Prabhakar, D. L. and Shantarajappa, A. N. 2003 Cognition and Recognition of Numerals using Hermite Curves, in 2nd National Conference on Document Analysis and Recognition (NCDAR), Mandya, India, 139-144. [6] Hanmandlu, M., Hafizuddin, M., Yusif, M. and Madasu, V. K. 2003 fuzzy based approach to recognition of multifont numerals, in 2th National Conference on Document Analysis and Recognition (NCDAR), Mandya, India. [7] Santosh Arjun, N., Navaneetha, G., Preethi, G. V. and Babu, T. K. 2007 An approach to multi-font numeral recognition, in TENCON- IEEE Region 10 Conference. [8] Rani, R., Dhir, R. and Lehal, G.S. 2013 Script Identification of Pre-segmented Multi-font Characters and Digits, 12th International Conference on Document Analysis and Recognition (ICDAR). [9] Tokunaga, K. and Furukawa, T. 2009 Modular network SOM, Neural Networks, 22(1) 82-90. [10] Maitre, G. 1995 Experiments with robust similarity measures for OCR, IDIAP TR, 95-103. [11] Kahya, E. 2005 A new unidimensional search method for optimization: Linear interpolation method, Applied Mathematics and Computation, 171(2) 912-926. [12] Sablonnière, P. 1982 Interpolation by quadratic splines on triangles and squares, Computers in Industry, 3(1-2) 45-52. [13] Duan, Q., Djidjeli, K., Price, W.G. and Twizell, E.H. 2000 Weighted rational cubic spline interpolation and its application, Journal of Computational and Applied Mathematics, 117(2) 121-135. [14] Dunlop, G.R. 1980 A rapid computational method for improvements to nearest neighbor interpolation, Computers& Mathematics with Applications 6(3) 349353. [15] Hassanpour, H., Darvishi, A. and Khalili, A. 2011 A regression-based approach for measuring similarity in discrete signals, International Journal of Electronics, 98.
IJCATM : www.ijcaonline.org 43