Recognizing Group Activities using Wearable Sensors Dawud Gordon1 , Jan-Hendrik Hanne2 , Martin Berchtold2 , Takashi Miyaki1 , and Michael Beigl1 1
2
Karlsruhe Institute of Technology, Kaiserstraße 12 76131 Karlsruhe, Germany
[email protected] Technische Universit¨ at Braunschweig, Pockelsstraße 14, 38106 Braunschweig, Germany j-h.hanne,
[email protected]
Abstract. Pervasive computing envisions implicit interaction between people and their intelligent environments instead of between individuals and their devices, inevitably leading to groups of individuals interacting with the same intelligent environment. These environments must be aware of user contexts and activities, as well as the contexts and activities of groups of users. Here an application for in-network group activity recognition using only mobile devices and their sensors is presented. Different data abstraction levels for recognition were investigated in terms of recognition rates, power consumption and wireless communication volumes for the devices involved. The results indicate that using locally extracted features for global, multi-user activity recognition is advantageous (10% reduction in energy consumption, theoretically no loss in recognition rates). Using locally classified single-user activities incurred a 47% loss in recognition capabilities, making it unattractive. Local clustering of sensor data indicates potential for group activity recognition with room for improvement (40% reduction in energy consumed, though 20% loss of recognition abilities). Keywords: group activity recognition, context recognition, distributed systems, multi-user, wearable
1
Introduction
Context and activity recognition provide intelligent devices in the environment with the ability to act proactively in the interest of users. Many of us now carry around one or more intelligent devices constantly, and the number of intelligent systems in our environment such as entertainment systems, vending machines and informational displays is steadily increasing [2, 14]. Implicit pro-active interaction based on situational awareness is increasingly more important in order to prevent us from entering a state of permanent distraction and informational overload. This state is a result of constantly having to administrate and respond to the myriad of intelligent devices in our immediate environment. One vision
2
within pervasive and ubiquitous computing sees these devices progressing from single-user, private devices to multi-user devices running private applications for those users who are present. A challenge then becomes not only recognizing the context of the single user who is interacting with the device, as is the case with mobile phones [3], but now attempting to recognize the activity of a group of individuals who are in a specific environment or interacting with the system. The group activity is not necessarily the same as the sum of the activities of the individuals in it [9]. The activity or context of a group is a function of the activity or context of all individuals in the group. Wearable technology has been proven to be effective for human activity recognition (HAR) [3, 1, 9] and is ever more prevalent, and is therefore an attractive platform for group activity recognition (GAR) as it is already present. Using a distributed wearable platform for both the sensing and processing aspects of activity recognition is advantageous in that it allows the system to operate independent of existing infrastructure and therefore widens the field of applications. When using wearable technology (badges, mobile phones, coffee cups, etc.) for group activity or context recognition it is inherently a hierarchical problem, where data from wearable sensors on multiple users must be aggregated in order to infer the group context [9]. Preprocessing data locally reduces its volume and therewith the energy required for transmitting that data, but at the same time this process discards information which may be vital for classification [12]. Transmitting unprocessed, raw data guarantees that the maximum amount of information is available for GAR, but is very expensive due to communication. In this work a system for recognizing group activities using only a distributed network of sensor nodes and mobile phones is presented. A mobile phone is used as a central node for GAR, and wireless sensor nodes are attached to coffee mugs (Smart Mugs) to monitor the activities of the individual user. The Smart Mugs can process measured sensor data locally to different abstraction levels before forwarding that data to the mobile phone for GAR. Different levels of data processing result in different levels of abstraction [12], from low-level raw sensor data to high-level single-user activity information processed using singleuser HAR techniques. The later approach introduces the problem of having to doubly-label training data in terms of single-user and group activities in order to train both local single-user classifiers on the Smart Mugs and global GAR classifiers on the mobile phone. Two methods for avoiding the doubly-labeling problem are presented and evaluated here: separate training sessions for local and global activities, and using unsupervised clustering techniques. These different modes of operation are evaluated in terms of distributed energy consumption and GAR rates in a multi-user experiment.
2
Related Work
Activity and context recognition in general are highly researched fields. The majority of all context and activity recognition work is focused on human subjects and concentrates on single user activity and context recognition. Traditionally,
3
this is conducted using body-worn acceleration sensors [1] which forward sampled data to a central server for classification. Other approaches range from embedded recognition approaches [13] to server based approaches which optimize classification results using crowd-sourcing [3]. First attempts at recognizing the activity of a group as a whole were pioneered with the Active Badge [14] and MediaCup [2] projects, which attempted to recognize situations such as meetings and presentations in office spaces. Further work in group activity recognition was conducted using camera-based activity recognition, such as for automatically recognizing group activities in a prison yard [5]. Another approach uses audio classification to recognize group activities, such as concurrent chatting activities [11], or for classifying roles of individuals in conversations and meetings [6]. These methods have proven effective, but rely heavily on infrastructure for recognition (cameras, networks, etc.). Research in GAR using wearable sensors has only recently been introduced to the scientific community. Wirz et al. approach recognition of cluster formations and flow patterns in groups of pedestrians in [15], and outline some of the problems in GAR [16]. Gu et al. [9] combine patterns of individual activities to recognize concurrent multi-user activities using probabilistic methods. Despite these advances in GAR methods, much is still left to be researched, and in light of the growing number of intelligent objects which we carry with us or wear, the potential of this field has not been fully exploited. Sigg et al. [12] researched the optimal context abstraction level for prediction of future contexts. Since GAR using wearable sensors is inherently a hierarchical problem, these same issues are also present here as well, but with focus on GAR instead of context prediction. Here a case study on GAR to evaluate the optimal context abstraction level for GAR using sensors from wearable devices is presented, as was described in a preliminary poster abstract [8]. The results provide insight into the power-accuracy trade-off for GAR, and uncover several research questions for the field of GAR in general.
3
System Design
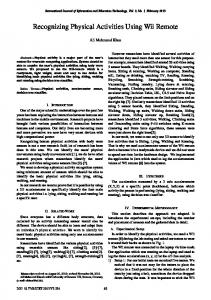
The system used here was made up of a wireless sensor network and a mobile phone. Wireless sensor nodes equipped with 3D acceleration sensors were attached to coffee mugs in a university/office setting. The nodes sampled activity and context data at the mugs, processed this data to the desired local abstraction level, and then forwarded this data to the smart-phone for further processing to classify the group activity as demonstrated in Fig. 1. The classifiers used in this paper are the k-Nearest-Neighbors (kNN) (k=10, Euclidean distance, no feature weighting), Decision Tree (DT) (C4.5), and Naive Bayes (nB) (no kernel estimation, single Gaussian, no covariance) algorithms, selected for their simplicity for embedded purposes. A hard K-Means clustering algorithm was used which outputs a single cluster candidate (top-1) for each vector, and uses subtractive clustering to identify the number of clusters present.
4
Smart Mug ADXL335
Coffee Cup/ jenPart WSN
Mobile Phone
802.15.4
jenPart
Battery
System: •jenPart sensor node •ConTiki OS Tasks: •Sensor sampling •Local feature extraction •Local activity recognition
System: •Neo Freerunner •Debian Linux Tasks: •Global multi-user group activity recognition •Global and local training •Visualization •Administration
Fig. 1. Left: The Smart Mug with an Acceleration Sensor, jenPart Node and Battery Right: Network Topology of the Group Activity Experiment
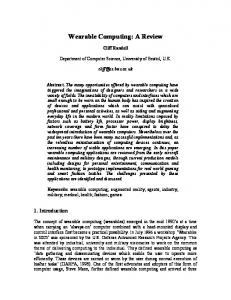
The wireless sensor nodes used were jenParts from the open-source Jennisense Project3 . The nodes are based on the JENNIC JN5139 wireless microprocessor, the ConTiki operating system [7], a battery and an analog 3D acceleration sensor4 . The nodes sample the sensors at a rate of 33 Hz and segment the sample data into windows (1 window = 16 samples ≈ 250ms with 50% overlap). Based on the operational mode, the windows are then processed and forwarded to the Neo: either the raw sensor data is forwarded (Raw Data mode, low-level data [12]), or the sensor signal features average and variance are forwarded (Feature and Training mode), or single-user activity information from a classifier or clusterer is forwarded (Classification mode, high-level data [12]). A Neo Freerunner5 was connected to a jenPart bridge in USB host mode for communication with the Smart Mugs. The Neo serves as a mobile platform for classifying the group activity based on the data aggregated from all nodes in the WSN. This involves a training mode and a classification mode for the global classifier. At training time, a vector consisting of data from the local nodes (either raw, features, or classes) and a global group activity label is input into the global classifier. In classification mode, an unlabeled data vector consisting of the local data from the distributed nodes is input into the classifier, which then outputs the classification, or group activity estimation for that vector. The Neo also serves as a context classifier training platform for the Smart Mugs in the WSN. Following the approach presented by Berchtold et al. [3], after being set in training mode by the Neo, each mug gathers data and forwards it to the Neo along with a local annotation indicated by segmenting activities using the button on the jenParts. Once this process is complete, the Neo trains the 3 4 5
The Jennisense Project: https://github.com/teco-kit/Jennisense/wiki ADXL335 3-Dimensional Acceleration Sensor: http://www.analog.com http://www.openmoko.org/
5
Group Activity Recognition Mode
Smart Mug
Mobile Phone
Raw Data
Sensor Sampling
FeatureBased
Sensor Sampling
Feature Extraction
ActivityBased
Sensor Sampling
Feature Extraction
Feature Extraction
Group AR
Group AR
Local AR / Clustering
Group AR
Fig. 2. State Charts for the Three Different System Modes for GAR
selected classifier, segments the trained classifier into packet-sized chunks, and sends these chunks sequentially to the nodes in a JSON format. The Mugs are equipped with a JSON interpreter which then reconstructs the classifiers locally and places them in memory so that they can be executed as a module.
4
Experiment
This experiment was designed to evaluate the different levels of data abstraction carried out by the Smart Mugs in terms of energy consumption and GAR rates. Processing data to the activity abstraction level [12] poses the problem of having to doubly-label the training data in terms of local, single-user activity labels and global, multi-user group activity labels. This must either be done using video recordings and offline annotation (time consuming) or multiple annotators in real time, both of which are too elaborate to allow easy deployment in new scenarios. To counteract this, two methods of skirting the doubly-labeling issue are employed and evaluated. First, local classifiers and global classifiers are trained in two sessions where each session must only be labeled with local or global activities respectively. Second, local activity classifiers are replaced with a hard, top-1, unsupervised k-means clustering [4], which does not require local activity labels, and can therefore be trained on the same data basis as the group activity classifier. Although the system was implemented on the distributed heterogeneous platform, the classification results presented here were generated offline using the WEKA toolkit [10] for analytical purposes but were cross-checked with online results. 4.1
Activity Recognition Experiment
During the course of this experiment, 3 subjects performed 7 different activities, 3 of which were group activities and 4 of which were individual activities involving
6
the Smart Mugs. In total, over 45 minutes of data were collected, making over 22,700 sample windows, although some data was discarded at random to ensure that experimental data was independently and identically distributed (i.i.d.). The experiments were conducted in a meeting room in a university setting over the course of a single day. In the first phase, local classifiers were trained and evaluated, followed by the global classifiers in the second.
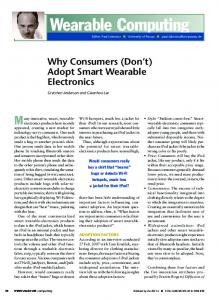
Phase 1: Local Classifiers In the first phase of the evaluation, each user performed a set of activities, each one for a duration from approximately 2 15 minutes with the Smart Mug in training mode, meaning features and labels were extracted locally and uploaded to the Neo. The activities were local to the Smart Mugs, and were not performed as part of group activities, as doubly labeling local and group activities in real time is impractical. The local activities were as follows: the subject has placed the mug on the table (or other surface), the subject is holding the mug in their hand, the subject is drinking from the mug, and the subject is gesticulating. After each activity was performed for the specified period of time, a button press on the node updated the label on the feature vector sent to the Neo and the next activity was performed. The first half of the data generated in this phase was used to train the local classifiers, and the second half was used to evaluate their performance. After all local activities were performed, the local classifiers were trained and communicated to the Smart Mug using JSON packets. The procedure of the process conducted in phase 1 is displayed in the upper portion of the sequence diagram in Fig. 3.
Experimental Phase
Smart Mug1 Sensor Sampling Feature Extraction
Neo Freerunner mug1 Feature {1,…,i} mug2,3 Feature {1,…,j} Classifier1 Part {1,…,j}
JSON Classifier Reconstruction
Local AR
Phase 1: Local Activity Recognition Phase 2: Group Activity Recognition
Classifier2,3 Part {1,…,i} mug1 Activity {1,…,i} mug2,3 Activity {1,…,i}
Local AR / Clustering
Local AR/ Clustering
Local Classifier Training
Training Evaluation Local Classifier Evaluation
mug1 Feature/Activity {1,…,i}
mug2,3 Feature/Activity {1,…,i} mug1 Feature/Activity {1,…,i} mug2,3 Feature/Activity {1,…,i}
Global Classifier Training
Training Evaluation Global Classifier Evaluation
Fig. 3. Sequence Diagram for the Two-Phase Group Activity Recognition Experiment
7
Phase 2: Global Training and Evaluation The evaluation of the global classifier was conducted offline using the data generated in this phase, where again half of the data was used for training and the other for performance evaluation. The subjects conducted the following activities together for 4 - 5 minutes each using Smart Mugs trained in the previous phase: Meeting, Presentation (users 1, 2 and 3) and Coffee break. A meeting consists of all subjects either setting their mugs on the table, holding them in their hand or drinking. In a presentation one subject will be gesticulating or holding their mug, and in a coffee break all are either holding, gesticulating with, or drinking from their mugs. During this period, the nodes transmitted the full locally extracted feature vector, as well as the local classifications of the local activities listed previously. The raw sensor data was ignored for reasons which will be explained later. The process flow for phase two is shown in the lower portion of Fig. 3 where feature vectors and local activity classifications are transmitted simultaneously to train global classifiers for each data type respectively. 4.2
Power Measurements
The power consumption of each device was measured by placing the node in serial with a low error tolerance resistor and measuring the drop in voltage across the resistor. For each of the modes (raw sensor data, extracted feature data and classifier/cluster data) the average rate of consumption and the amount of energy consumed was calculated. The amount of energy consumed R t over the period of time beginning at t0 and ending at t1 is then given by t01 Vsupply × Rt Vmeas dt where Vsupply is the supply voltage, Isupply is Isupply dt = t01 Vsupply × R meas the current drawn by the node, which is given by the voltage drop (Vmeas ) over the measurement resistor with resistance Rmeas . 4.3
Raw Data Issues
Since the features calculated by the mobile phone and the distributed nodes are identical, the recognition rates for both modes would be identical as well. Theoretically, the Neo is capable of calculating far more complex and extensive feature sets than the Smart Mugs, meaning that recognition rates for the raw data phase could be higher than for locally extracted features. That certain features provide better or worse recognition values is however a known fact, and the field of feature selection is a different area of research, making this comparison out-of-scope in the context of this work. For this reason, the raw data phase was only used to evaluate data volumes and energy consumption rates, and not to compare classification values.
5 5.1
Results Classification Results
Phase 1: Local Classification In phase 1 the Smart Mugs were trained using the following four classes: subject has set the mug down, subject is holding the
8
mug, subject is drinking and subject is gesticulating. Tab. 1a displays the results of the evaluation of the local classifiers trained in phase 1 of the experiment. The accuracy, precision, recall and F-measure averaged over the 3 mugs is displayed. The results indicate that all classifiers for local, single-user activities performed at around 95%, where minimal variance across mugs and activities was observed. Table 1. Classification Rates for Local and Global Classifiers a) Local Activities (Averaged Over Nodes) Data DT kNN nB Basis Acc. F-meas. Acc. F-meas. Acc. F-meas. Features 0.958 0.958 0.954 0.955 0.941 0.943 b) Global Activities DT kNN nB Data Basis Acc. F-meas. Acc. F-meas. Acc. F-meas. Features 0.962 0.962 0.894 0.898 0.565 0.593 Clusters 0.762 0.764 0.597 0.605 0.491 0.494 Activities 0.507 0.524 0.424 0.484 0.491 0.505
Phase 2: Global Classification Similar to phase 1, the global GAR classifier used half of the data generated in phase 2 for training and the other half for classifier evaluation. Tab. 1b displays the results of the evaluation of the global GAR classifiers from phase 2. Each row of the table represents a different data abstraction level of the Smart Mugs: either feature transmission, transmission of local activities (the local classifier algorithm is always the same as the global one, e.g. the first column is local single-user DT, with a global GAR DT), or transmission of local clustering results. In total 9 global GAR classifiers were trained and tested, 3 classifiers (DT, kNN, nB) for each type of local data abstraction. Tab. 1b indicates that local classification provided poor results with a accuracies of 51% (DT), 49% (nB) and 42% (kNN). Local clustering provided better GAR results but with greater variance across the different classifiers, with accuracies of 76% (DT), 60% (kNN) and 49% (nB). The best results were achieved using local features and a DT classifier (96%), where the kNN algorithm achieved relatively high recognition rates (89%), while the nB classifier was only able to achieve GAR with an accuracy of 56% (compare with 33% at random). 5.2
Data Transmission and Energy Consumption
In order to analyze the requirements of the three different system modes in terms of resource consumption the nodes were monitored over different modes of operation. The effects of each mode was analyzed in terms of communication time and volume as well as energy consumption. Tab. 2 displays the amount of time required for communication per second (Ttx ) and the amount of data communicated per second for each node. The results indicate a drop in data volume of
9
73.5% between transmitting raw data and features, 88.5% between features and classes/clusters, and a 96.9% drop in the amount of data communicated from raw data mode to local context classification mode. Table 2. Communication Volumes and Power Consumption Results
Mode
Ttx Data Volume (ms) (B/s) Raw Data 28.79 404.25 Features 24.63 107.25 Classes/Clusters 16.95 12.375
Neo Freerunner Avg(P) (W) 1.771 1.723 1.700
Smart Mug Avg(P) ETx (mW) (mJ) 24.574 1.012 24.233 0.909 23.140 0.605
During the course of these experiments, the energy consumption rates of the different devices were also monitored. Tab. 2 displays the results for the energy measurements for both the Smart Mug hardware and the Neo mobile phone as they carried out the necessary operations. The results indicate a decrease in average energy consumption (Avg(P)) at the Smart Mugs of 1.4% from raw data to feature modes, a decrease of 4.5% from feature mode to classification mode, and a total drop of 5.8% from raw data to classification mode. For the Neo, a drop of 2.7% in average energy consumption was registered from raw data to features, a drop of 1.33% from features to classes, and a total drop of 4.0% from raw data to classification mode. Due to the difference in the the ratio of operational to transmission power consumptions between the 2 device types, the change in energy consumption due to transmission could only be directly measured accurately at the Smart Mugs, but not at the Neo. The right-most column in Tab. 2 indicates the amount of energy consumed by a node for the purpose of communicating data wirelessly each second (ET x ). This indicates a 10.17% drop in energy consumed when transmitting features as compared to raw data, and a decrease of 33.44% from features to classes, with a total decrease of 40.22% from raw data to classes.
6
Analysis and Discussion
One of the most important issues is selecting local activities relevant to discrimination between the global group activities. Here the experiment was designed to avoid this problem by engineering group activities which can be directly mapped onto the individual activities in order to evaluate the system, rather than the scenario. For real scenarios, either intuitive or experimental knowledge of the relationship between group and individual activities is required for activity selection, otherwise global recognition rates will deteriorate. In this experiment, global classifiers were trained using the output of the local classifiers in the local classification mode, meaning that local classifier
10
error was present in the training data for global classifiers. Alternatively, doublylabeling activities would have allowed for training local and global classifiers on the ground truth labels simultaneously. The effects on global rates is unknown; using local labels could allow for the global classifier to account for and correct local errors, though it may also worsen results by distorting global classifier mappings. Furthermore, in this experiment a great deal of the GAR error when using locally classified activities was due to the fact that the data generated in Phase 1 of the experiment differed greatly from the data generated in Phase 2. Although subjects were instructed to conduct local activities as they would in a meeting, they were obviously incapable of reproducing their own behavior under the group activity conditions. This becomes apparent when comparing the average maximum feature values for signal average (812 local vs. 1324 global) and variance (6621 local vs. 148271 global) of the two datasets. Eliminating this discrepancy would involve labeling local activities during group activities which would greatly increase labeling effort. Tab. 2 indicates that the energy consumed by the nodes for the purpose of transmission dropped by 33% when the nodes only transmit a locally classified situation instead of locally generated features. When compared with Tab. 1b, it becomes clear that these values come at a high price in terms of the recognition rates for global classification. Both the nB and DT classifiers performed comparably locally, but there is a disparity of up to almost 50% for global group activities based on local features. This indicates that GAR presents problems which are not present for single-user AR, and that not every classifier algorithm used for single-user HAR is appropriate for multi-user GAR. Specifically, the nB classifier uses a single Gaussian to model the distribution of each feature given a group activity. Data analysis indicates that often times group activities create multiple clusters in the multi-dimensional feature (18 dimensions) and activity (3 dimensions) space, for instance group activity ”Presentation” consists of 3 clusters, one for the activity when each user presents. For GAR, this implies that a probabilistic approach should be combined with clustering and covariance modeling in order to model multiple clusters and dependencies, as the naive Bayes assumption can be detrimental. Although the results of GAR using local clustering were significantly lower than using local features ( 76% as opposed to 96%, 20% drop), clustering is quite promising. The approach does not require a separate phase for local training as local labels are not required (unsupervised learning), and reduces the energy consumption due to transmission by 33%. The 20% drop in GAR rates is initially prohibitive for most applications, but the method used (k-means, hard clustering, top-1 class) can be combined with other approaches such as soft clustering and increasing the number of clusters outputted to improve recognition rates [4]. The ratio of how much of the total energy consumption is used for communication can be seen in Tab. 2, and is very much system and implementation dependent, where the volume of data falls by 75%, meaning that a large portion of the energy consumed for communication is in overhead. These values are heavily system and scenario dependent, where factors such as number of sensors and
11
features, as well as window length and sample rate play a large role. Changing these parameters could tip the energy and GAR classification rate trade-off and would require a new evaluation.
7
Conclusion
This paper introduced a system for multi-user group activity recognition using only wearable and mobile devices for both sensing and recognition purposes. Multiple approaches to recognizing these activities were examined, where nodes processed sensor data to different levels of abstraction (raw data, features, local activities or clusters) before combining this information to recognize the group activity on a mobile phone. An experiment was conducted in an office scenario where nodes attached to mugs were used to monitor user’s activities and perform group activity recognition (GAR). Different levels of context preprocessing at the mugs were examined and evaluated in terms of power consumption and activity recognition rates. Specifically, using raw data, signal features, locally classified single-user activities and local clustering were examined as the basis for GAR and evaluated in terms of the cost of transmission incurred as well as GAR rates. The results indicate that the optimal recognition was achieved using locally extracted features, with GAR accuracy of 96% and a 10% drop in the amount of energy consumed for the purpose of wireless communication. Locally classifying activities and using these to classify the global group activity reduced power consumption by a further 33%, but incurred a 47% drop in global multiuser GAR rates due to subjects’ inability to recreate their own behavior under different conditions. Using local clustering showed potential by reducing power consumption by 40%. The recognition drop of 20% is severe, but can be improved upon by using more advanced clustering methods, indicating that this approach represents a topic for further research into reducing power consumption while avoiding the doubly-labeling issue.
Acknowledgments The authors would like to acknowledge funding by the European Commission under the ICT project “CHOSeN” (Project No. 224327, FP7-ICT-2007-2).
References 1. Ling Bao and Stephen S. Intille. Activity recognition from user-annotated acceleration data. In Pervasive, pages 1–17, 2004. 2. Michael Beigl, Hans-W. Gellersen, and Albrecht Schmidt. Mediacups: experience with design and use of computer-augmented everyday artefacts. Comput. Netw., 35:401–409, March 2001.
12 3. Martin Berchtold, Matthias Budde, Dawud Gordon, Hedda Schmidtke, and Michael Beigl. ActiServ: Activity recognition service for mobile phones. In ISWC’10: Proceedings of the Fourteenth International Symposium on Wearable Computers, pages 83–90, Seoul, S. Korea, 2010. IEEE Computer Society. 4. Ulf Blanke and Bernt Schiele. Daily routine recognition through activity spotting. In Proceedings of the 4th International Symposium on Location and Context Awareness, LoCA ’09, pages 192–206, Berlin, Heidelberg, 2009. Springer-Verlag. 5. Ming-Ching Chang, Nils Krahnstoever, Sernam Lim, and Ting Yu. Group level activity recognition in crowded environments across multiple cameras. Advanced Video and Signal Based Surveillance, IEEE Conference on, 0:56–63, 2010. 6. Wen Dong, Bruno Lepri, Alessandro Cappelletti, Alex Sandy Pentland, Fabio Pianesi, and Massimo Zancanaro. Using the influence model to recognize functional roles in meetings. In Proceedings of the 9th international conference on Multimodal interfaces, ICMI ’07, pages 271–278, New York, NY, USA, 2007. ACM. 7. Adam Dunkels, Bj¨ orn Gr¨ onvall, and Thiemo Voigt. Contiki - a lightweight and flexible operating system for tiny networked sensors. In Proceedings of the First IEEE Workshop on Embedded Networked Sensors (Emnets-I), Tampa, Florida, USA, November 2004. 8. Dawud Gordon, Jan-Hendrik Hanne, Martin Berchtold, Takashi Miyaki, and Michael Beigl. An experiment in hierarchical recognition of group activities using wearable sensors. In Poster at The 7th International and Interdisciplinary Conference on Modeling and Using Context (CONTEXT’11), 2011. 9. Tao Gu, Zhanqing Wu, Liang Wang, Xianping Tao, and Jian Lu. Mining emerging patterns for recognizing activities of multiple users in pervasive computing. In Mobile and Ubiquitous Systems: Networking Services, MobiQuitous, 2009. MobiQuitous ’09. 6th Annual International, pages 1 –10, july 2009. 10. Mark Hall, Eibe Frank, Geoffrey Holmes, Bernhard Pfahringer, Peter Reutemann, and Ian H. Witten. The weka data mining software: an update. SIGKDD Explor. Newsl., 11:10–18, November 2009. 11. Jane Yung-Jen Hsu, Chia-Chun Lian, and Wan-Rong Jih. Probabilistic models for concurrent chatting activity recognition. ACM Trans. Intell. Syst. Technol., 2:4:1–4:20, January 2011. 12. Stephan Sigg, Dawud Gordon, Georg von Zengen, Michael Beigl, Sandra Haseloff, and Klaus David. Investigation of context prediction accuracy for different context abstraction levels. IEEE Transactions on Mobile Computing, 2011. 13. Mathias St¨ ager, Paul Lukowicz, and Gerhard Tr¨ oster. Power and accuracy tradeoffs in sound-based context recognition systems. Pervasive and Mobile Computing, 3:300 – 327, 2007. 14. Roy Want, Andy Hopper, Veronica Falc˜ ao, and Jonathan Gibbons. The active badge location system. ACM Trans. Inf. Syst., 10:91–102, January 1992. 15. Martin Wirz, Daniel Roggen, and Gerhard Tr¨ oster. Decentralized detection of group formations from wearable acceleration sensors. In Proceedings of the 2009 International Conference on Computational Science and Engineering - Volume 04, pages 952–959, Washington, DC, USA, 2009. IEEE Computer Society. 16. Martin Wirz, Daniel Roggen, and Gerhard Tr¨ oster. A methodology towards the detection of collective behavior patterns by means of body-worn sensors. In Workshop at the 8th International Conference on Pervasive Computing, 2010.