Dec 16, 2009 - capabilities of the Battelle CO2-GIS geospatial techno-economic modeling ...... Bock B, R Rhudy, H Herzog, M Klett, J Davison, D De La Torre ...
PNNL-19091 Prepared for the U.S. Department of Energy under Contract DE-AC05-76RL01830
Regional Opportunities for Carbon Dioxide Capture and Storage in China A Comprehensive CO2 Storage Cost Curve and Analysis of the Potential for Large Scale Carbon Dioxide Capture and Storage in the People’s Republic of China Robert T Dahowski Xiaochun Li Casie L Davidson Ning Wei James J Dooley December 2009
PNNL-19091
Regional Opportunities for Carbon Dioxide Capture and Storage in China A Comprehensive CO2 Storage Cost Curve and Analysis of the Potential for Large Scale Carbon Dioxide Capture and Storage in the People’s Republic of China Pacific Northwest National Laboratory Richland, Washington, United States
Institute of Rock and Soil Mechanics Wuhan, Hubei, China
Robert T Dahowski Casie L Davidson James J Dooley
Xiaochun Li Ning Wei
December 2009
Prepared for the U.S. Department of Energy under Contract DE-AC05-76RL01830
Pacific Northwest National Laboratory Richland, Washington 99352
Executive Summary To date, much of the discussion about China’s options for addressing climate change have focused almost exclusively on coal – the nation’s large indigenous reserves, and its heavy and increasing use in powering China’s fast-growing economy. This discussion of China’s reliance on coal coupled with the need to reduce global greenhouse gas emissions is too often framed as an all-or-nothing proposition which has created a false dichotomy suggesting that China must choose between either continuing to use domestic coal and bearing the environmental consequences, or forgoing cheap domestic reserves and bearing the economic consequences. This study demonstrates for the first time the significant potential for carbon dioxide capture and storage (CCS) technologies to deploy in China, presenting the possibility of a third option that supports continued economic growth with coal while safely and securely reducing carbon dioxide (CO2) emissions to the atmosphere. As such, CCS may offer a valuable option for China as part of a large and diverse portfolio of advanced clean energy and climate change mitigation technologies. The research reported here is the result of an unprecedented and highly productive five-year collaboration between researchers in the United States and China. Together this international team of researchers has documented in this report that there is significant potential for CCS technologies to deploy in China and to deliver deep, sustained and cost-effective emissions reductions over the course of this century and potentially beyond. This study identified 1,623 large stationary CO2 point sources in China that each emit at least 100,000 metric tons (tonnes) of CO2 per year. Combined annual CO2 emissions from these large stationary power and industrial facilities are estimated at over 3,890 million tonnes (MtCO2), which represents 64 percent of the total annual CO2 emissions from all aspects of the Chinese economy. These 1,623 large stationary CO2 emissions sources include:
629 power plants (94% of them coal-fired units) together emitting more than 2,810 MtCO2 per year, with coal-fired units accounting for over 98% of this total.
994 large non-power industrial CO2 sources that emit approximately 1,080 MtCO2 per year. The majority (56%) of these are cement plants with the remainder being ammonia plants, iron and steel facilities, and petrochemical refineries.
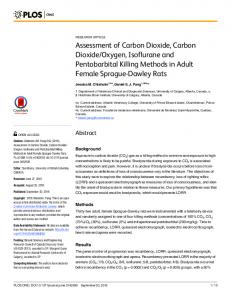
Figure ES.1 Map of Large CO2 Point Sources by Type, Size, and Administrative Region
iii
The 100 largest sources are responsible for nearly one-third of the total annual emissions from these 1,623 facilities and the 500 largest CO2 emitters are responsible for 3,060 MtCO2/yr or 79% of the total emissions from the set.
As can be seen from Figure ES.1, the majority of the large, stationary CO2 point sources are concentrated along the more heavily developed coastal zones of China, with 58% of all of the sources being located within the East and South Central regions.
This report and underlying study establish that China has a large and geographically dispersed theoretical deep geologic CO2 storage capacity in excess of 2,300,000 MtCO2 in onshore basins with an additional 780,000 MtCO2 potentially in relatively near offshore basins as depicted in Figure ES-2. Deep saline-filled sedimentary basins account for over 99% of the total calculated storage capacity. There are:
16 onshore deep, saline-filled sedimentary basins (DSFs) with an estimated CO2 storage capacity of 2,288,000 MtCO2, plus additional capacity in 9 offshore basins estimated at 779,000 MtCO2. Total CO2 storage capacity across all DSFs is estimated at over 3 billion tonnes of CO2.
16 onshore and 3 offshore depleted oil basins with potential for enhanced oil recovery have a total estimated CO2 storage capacity of 4,800 MtCO2 – of which 4,600 MtCO2 is found onshore.
Figure ES.2 Map Showing the Combined Location and 45 major coal basins with Extent of Candidate Geologic CO2 Storage total CO2 storage capacity of Formations Analyzed in This Study approximately 12,000 MtCO2 in deep, unmineable coal seams with potential for CO2-driven enhanced coal bed methane recovery. 13 major onshore and 4 major offshore gas basins assessed in this study, which combine to offer more than 5,100 MtCO2 in total estimated CO2 storage capacity.
A central aspect of the research presented here was to model the economic competition between this large number of stationary CO2 point sources and China’s large theoretical CO2 storage capacity in deep geologic reservoirs. Key conclusions from this source-reservoir matching analysis include:
Most large stationary CO2 point sources in China are in relatively close proximity to at least one candidate deep geologic CO2 storage reservoir:
iv
54% have a candidate storage formation in the immediate vicinity;
83% have at least one storage formation within 80 km (50 miles); and
a full 91% have the potential to reach a candidate storage formation within 160 km (100 miles).
Variations do occur from region to region across China with large numbers of CO2 sources in the industrialized coastal areas having less access to abundant onshore CO2 storage capacity than sources in the interior regions.
The economic implications of pairing China’s fleet of large CO2 point sources with its abundant storage capacity resource are revealed through the cost curve analyses documented in this report. Key findings from this engineering and economic modeling of how CCS technologies might deploy in China indicate that:
Most of the large CO2 emissions sources in China should be able to transport and geologically store their CO2 for decades – and potentially a century or more – at costs between $2 and $8/tCO2. These costs include CO2 transport via pipeline, site characterization, injection, measurement, monitoring, and verification (MMV), plus production and CO2 recycling costs for enhanced oil recovery and enhanced coalbed methane recovery projects. Costs associated with CO2 capture and compression are not included in these estimates.
The CO2 storage resource of China is robust and able to Figure ES.3 Reference Case Cost Curve for CO2 Transport and meet the demand Storage in China from the majority of China’s large CO2 sources at these costs over decades of large-scale deployment, even if the ultimately accessible storage resource proves to be considerably less than the 2,300,000 MtCO2 estimated here.
v
There appears to be a number of potential opportunities for low and even negative cost CO2 transport and storage in candidate value-added CO2 storage formations such as oil fields and coal seams with enhanced recovery potential from CO2 injection. However, these options remain relatively limited and further evaluation is needed to confirm the timing of availability for CO2 storage as well as the expected cost and performance characteristics of these formations.
The vast majority of the 1,623 large CO2 point sources in China are likely to rely heavily if not exclusively on high capacity and widely distributed deep saline sedimentary formations.
There is significant variation in storage demand and resulting costs from region to region in China. In particular, this report documents a number of large CO2 sources with limited access to adequate storage capacity in nearby onshore basins. These are predominantly located in the coastal regions and further study of the potential and costs for storage into nearby offshore basins will be valuable for these areas.
This work represents a first order assessment of the potential for CCS technologies to deploy in China and provides a solid foundation on which to build additional understanding in this new and complex area of research. Many initial questions have been answered by this analysis. In particular, this analysis demonstrates that CCS technologies could play a significant and sustained role in delivering cost effective CO2 emissions reductions for China over the course of this century. This is critical for the continued economic development of China as well its trading partners, and those working to establish a robust, durable and viable framework for reducing global emissions of greenhouse gases. While a portfolio of technological and other approaches will be needed to significantly reduce greenhouse gas emissions in China and throughout the world, the availability of CCS as a meaningful and cost effective CO2 mitigation option for China could reduce costs and allow for continued economic development in this important region.
vi
Acknowledgments This report and its underlying analyses are the result of a strong and unprecedented collaboration between researchers in the U.S. and China and are intended to provide an initial examination of the potential to deploy carbon dioxide capture and storage (CCS) technologies within the People’s Republic of China for the purposes of climate protection. Funding for this work was provided by the U.S. Department of Energy through the U.S./China Energy and Environmental Technology Center and Leonardo Technologies, Inc. Additional funding and support has been provided through the Global Energy Technology Strategy Program led by the Joint Global Change Research Institute, a partnership between the Pacific Northwest National Laboratory, Battelle, and the University of Maryland. This research report is a product of the Regional Opportunities for Carbon Dioxide Capture and Storage in China project, one of a select number of multi-national CCS projects worldwide to be recognized by the Carbon Sequestration Leadership Forum.
vii
Contents Executive Summary .............................................................................................................................. Acknowledgments................................................................................................................................. 1.0 Introduction .................................................................................................................................. 2.0 Large CO2 Point Sources in China ............................................................................................... 2.1 Data Challenges.................................................................................................................... 2.2 Building the CO2 Point Source Database ............................................................................. 2.2.1 Electric Power Sector ................................................................................................ 2.2.2 Other CO2 Emitting Sectors ...................................................................................... 2.2.3 Quality Assurance ..................................................................................................... 2.3 Characteristics of Large CO2 Point Sources in China .......................................................... 3.0 Candidate Geologic CO2 Storage Reservoirs ............................................................................... 3.1 Deep Saline Sedimentary Formations .................................................................................. 3.2 Depleted Gas Basins............................................................................................................. 3.3 Depleted Oil Basins and Enhanced Oil Recovery ................................................................ 3.4 Unmineable Coal Seams and Enhanced Coalbed Methane Recovery ................................. 3.5 Summary of Candidate Storage Reservoirs.......................................................................... 4.0 Cost Curve Methodology.............................................................................................................. 4.1 Modeling Approach.............................................................................................................. 4.2 CO2 Source Assumptions ..................................................................................................... 4.3 CO2 Transport Costs............................................................................................................. 4.4 CO2 Storage Costs ................................................................................................................ 4.4.1 Site Characterization ................................................................................................. 4.4.2 Well-Field Costs ........................................................................................................ 4.4.3 Estimating Injection Rates ........................................................................................ 4.4.4 EOR and ECBM Considerations ............................................................................... 4.4.5 Measurement, Monitoring and Verification .............................................................. 5.0 CO2 Source-Reservoir Matching and Cost Curves for CO2 Transport and Storage .................... 5.1 Proximity Analysis ............................................................................................................... 5.2 Cost Curves for CO2 Transport and Storage in China .......................................................... 5.3 Cost Curve Results – Reference Case .................................................................................. 5.3.1 Sample Source-Sink Pairs within the Reference Case Cost Curve ........................... 5.3.2 Regional Cost Curves – Reference Case ................................................................... 5.3.3 Time Series Cost Curves – Reference Case .............................................................. 5.4 Sensitivity Analyses ............................................................................................................. 5.4.1 Reduced Storage Capacities ...................................................................................... 5.4.2 Injection Rate Assumptions....................................................................................... 6.0 Conclusions .................................................................................................................................. 7.0 References ....................................................................................................................................
ix
iii vii 1.1 2.1 2.1 2.2 2.2 2.2 2.3 2.4 3.1 3.1 3.4 3.8 3.11 3.15 4.1 4.1 4.2 4.3 4.4 4.4 4.5 4.6 4.10 4.12 5.1 5.1 5.3 5.4 5.6 5.8 5.9 5.14 5.14 5.19 6.1 7.1
Figures 2.1 Map of Large CO2 Point Sources by Type, Size, and Administrative Region .............................
2.5
2.2 Contribution of Large Point Sources in Each Sector to Overall Total CO2 Emissions ................
2.6
2.3 CO2 Emissions by Sector and Region ...........................................................................................
2.6
2.4 Size Distribution of 1,623 Large CO2 Point Sources and Cumulative Emissions .......................
2.7
3.1 Map of Major Sedimentary Basins in China As Evaluated In This Study....................................
3.2
3.2 Map Showing Major Onshore and Offshore Gas Basins in China, as Evaluated in This Study...
3.5
3.3 Molar Ratio of CO2 to CH4, by Depth ..........................................................................................
3.7
3.4 Map Showing Major Oil Basins and Sub-Basins Evaluated in This Analysis ............................. 3.10 3.5 Map Showing the Location and Extent of Major China Coal Basins Analyzed in This Study .... 3.12 3.6 Map Showing the Combined Location and Extent of Candidate Geologic CO2 Storage Formations Analyzed in This Study ............................................................................................. 3.16 4.1 EOR Project CO2 Injection Rate Over Time, and Proportion of Injectate as Recycled and New CO2, After Jarrell et al. ......................................................................................................... 4.10 5.1 Map of Large CO2 Point Sources with Candidate Geologic Storage Formations ........................
5.1
5.2 Cost Curve for CO2 Transport and Storage in China ....................................................................
5.5
5.3 Reference Case Cost Curve Colored by Sink Type with Sample Project Callouts.......................
5.7
5.4 Disaggregated Component Costs for the Seven Sample Projects .................................................
5.8
5.5 Individual CO2 Transport and Storage Cost Curves for Six Regions of China, Reference Case - First 20 Year Analysis Period ............................................................................................
5.9
5.6 Reference Case Cost Curves for 100 Years of Full-Scale Deployment........................................ 5.10 5.7 100 Years of CO2 Storage by Reservoir Class – Reference Case ................................................. 5.11 5.8 100 Years of CO2 Storage by Reservoir Class and Region – Reference Case.............................. 5.12 5.9 Mapping Reservoir Filling over 100 Years of Storage – Reference Case .................................... 5.13 5.10 Cost Curves for Various Initial Capacities, First 20-year Analysis Period................................... 5.15 5.11 100 Years of CO2 Storage by Reservoir Class – 50% Capacity Case .......................................... 5.16 5.12 100 Years of CO2 Storage by Reservoir Class – 10% Capacity Case .......................................... 5.17 5.13. Mapping Reservoir Filling over 100 Years of Storage, for Years 20, 60, and 100: 50% Capacity Scenario, 10% Capacity Scenario .................................................................................. 5.18 5.14 Injection Rate Sensitivity Cases, Contrasted With the Reference Case Curve ............................. 5.20 5.15 Injection Rate Sensitivity Cases, Zoomed in View of $0-10/tCO2 Range .................................... 5.20
x
Tables 2.1 Capacity Factor and CO2 Emissions Factor Assumptions for Power Generation.........................
2.2
2.2. Emission Factors by CO2 Source Type .........................................................................................
2.3
2.3 Provinces, Municipalities, and Autonomous Regions and Combined Area, Population, and CO2 Emissions by Administrative Region ....................................................................................
2.5
3.1 Brennan & Burruss CO2 Solubilities per Bulk Pore Volume for Zero and Four Molal NaCl Equivalent Solutions .....................................................................................................................
3.3
3.2 Onshore and Offshore Basins with Assumed Thickness and Porosity Values, and Estimated CO2 Storage Capacities .................................................................................................................
3.4
3.3 Recovery Coefficients Applied to China Gas Basins ...................................................................
3.6
3.4 Onshore and Offshore Gas Basins in China, with Estimated CO2 Storage Capacities, by Major Basin...................................................................................................................................
3.7
3.5 Four EOR Cases with Different Depth/Pressure and API Gravity Conditions .............................
3.9
3.6 Onshore and Offshore Oil Basins in China, with Estimated CO2 Storage Capacity and Potential Additional Oil Production via CO2-EOR....................................................................... 3.11 3.7 Assumed Replacement Ratios and Recovery Rates for the Ten Coal Type Categories Identified for Chinese Coal Basins ............................................................................................... 3.13 3.8 Estimated CBM-Based Storage Capacities for 45 Major Coal-Bearing Basins in China, and Associated CBM Reserves............................................................................................................ 3.14 3.9 Total Capacities and Resulting Number of Formations within the Four Major Storage Formation Classes Analyzed......................................................................................................... 3.15 4.1 Key Geologic Parameters, and Assumed Injection Rate Classes and Rates for the Major China DSFs Evaluated in this Study .............................................................................................
4.8
5.1 Proximity Analysis Results for China...........................................................................................
5.2
5.2 Proximity Analysis Results for Six Regions of China ..................................................................
5.2
xi
1.0 Introduction The People’s Republic of China is the most populous country in the world and has been experiencing tremendous economic and industrial growth (Marland et al. 2008). China's population has doubled over the past four decades and now exceeds 1.3 billion people; economic growth has averaged 9.8% annually since 1980 (IEA 2007). The country has abundant domestic coal reserves (the third largest in the world) that power the economy, supplying an estimated 69 percent of China’s primary energy consumption (EIA 2006). China is the largest coal producer in the world, and the bulk of anthropogenic carbon dioxide emissions result from coal combustion.1 Electricity generation in 2005 was greater than 2.4 trillion kilowatt-hours, making China the second largest power producer behind only the United States (EIA 2007), and recent growth rates have been unprecedented, adding 105 gigawatts of capacity in 2006 alone (IEA 2007). China is also the global leader in the production (and consumption) of such carbon-intensive commodities as steel, ammonia, and cement. It is estimated that China’s fossil-fuel carbon dioxide (CO2) emissions increased some 66% during the relatively short period between 2000 and 2005 (Marland et al. 2008), and several recent studies have concluded that China overtook the United States as the largest global emitter of CO2 in 2006 (NEAA 2008; Gregg et al. 2008). While historic and per-capita CO2 emissions remain low compared to more developed countries, the rapid development in China along with the heavy reliance on domestic coal resources means that, left unchecked, overall CO2 emissions will continue to rise significantly in the coming decades. The International Energy Agency’s Reference Scenario projects that China’s energyrelated CO2 emissions will be 35% higher than the United States’ by 2015 and 66% higher by 2030 (IEA 2007). For the world to take serious action against increasing concentrations of greenhouse gases in the atmosphere and their associated climate impacts, we must collectively examine the potential for reducing CO2 and other greenhouse gas emissions in all major regions of the world. While a number of complementary approaches will be necessary to slow the increase in atmospheric greenhouse gas concentrations, analyses suggest that carbon dioxide capture and storage (CCS) technologies could provide significant economic benefits when included in the overall portfolio of climate change mitigation options (Metz et al. 2005). Over the past several years, research into the potential, costs, and feasibility of CO2 capture and geologic storage has increased significantly throughout the world. Initial studies on the large stationary CO2 point sources, geologic CO2 storage resources, and deployment costs have been performed for regions including the Unites States and Canada (Dahowski et al. 2005), Europe (Wildenborg et al. 2005), Australia (Bradshaw et al. 2004), India (Holloway et al. 2008) and elsewhere. These studies have contributed to the understanding of the potential for CCS technologies to deploy widely in these regions and their ability to help mitigate global climate impacts. They have also contributed to the development of significant research programs designed to enhance the technical community’s understanding of the costs and risks associated with CCS and prepare the suite of CCS technologies for a broader, commercial-scale deployment.
1
CO2 emissions from coal use accounted for 98.7% of China’s total CO2 emissions in 1950. However as the transportation sector has grown in China the overall share of CO2 emissions from coal use has declined to approximately and 73.7% in 2005 although net emissions from coal use has increased steadily over this period (Marland et al. 2008).
1.1
However, until now there have been no comparable, comprehensive studies of the CO2 sources and candidate geologic storage reservoirs in China. This project was designed to be the first of its kind study to catalog and examine characteristics of large anthropogenic CO2 sources, candidate geologic storage reservoirs, and to analyze opportunities for CCS deployment in this region. This first-order assessment is intended to illustrate the potential for CCS technologies to be deployed in China, linking the nation’s large and growing industrial CO2 source fleet with available geologic CO2 storage reservoirs capable of storing CO2 safely over significant time scales, and to present an initial estimate of costs for CO2 transport and storage. The analysis is intended to represent a first step towards a more comprehensive understanding of China’s potential opportunities to utilize CCS as a means of cost-effectively controlling CO2 emissions. This report presents the resulting compilation of large stationary CO2 point sources and the estimation of their emissions, along with the identification and evaluation of theoretical basin-scale geologic storage potential. This is followed by a description of data and methodology for estimating costs of various CCS system components. Finally, cost curves for CO2 transport and storage for China and regions thereof are presented, along with a select number of sensitivity analyses to provide further insight into the robustness of the CO2 storage resource and the sensitivity of the resulting cost estimates to a variation in key parameters. While this analysis fills a void in the current literature by taking a first order look at the potential for geologic CO2 storage in China, the very emerging nature of the knowledge and focus on CCS in China, coupled with data availability issues that are common throughout much of the world, have necessitated the use of simplifying assumptions. These are based in part upon extrapolation of knowledge and experience gained in the U.S. and other parts of the world to fill in gaps where China-specific data are limited. Additional research is needed, and many areas for follow-on evaluation are proposed based on this initial study. However, this analysis has helped to demonstrate the ability of CCS to deploy broadly within China and provide significant value as a climate change mitigation strategy. CCS technologies are essential to the development of near-zero emission coal technology, and may help China preserve the economic and societal benefits of continuing to utilize its vast domestic coal resource, even in a carbonconstrained world. This study will hopefully spur additional research, critical thinking, policy action, and proactive steps towards reducing greenhouse gas emissions to mitigate the impacts of global climate change.
1.2
2.0 Large CO2 Point Sources in China There are many different types of anthropogenic CO2 emissions sources in China, many of which are growing as industrialization and urbanization progress and overall living standards increase. Growth in the production of a number of key carbon-intensive commodities is required to meet these demands including increased cement, iron and steel production, in addition to growing needs for electric power and transport fuels. The focus within this project is on the large, stationary source CO2 emitters, such as power plants, cement kilns, steel mills, and petroleum and chemical refineries. The goal has been to compile an initial dataset that represents the vast majority of large point sources that emit at least 100,000 tonnes of CO2 per year. Sources smaller than these are considered unlikely to be economic to employ CO2 capture technologies, particularly in the nearer term.1 As a result, the analysis does not consider all anthropogenic CO2 emissions, and specifically not those from small industrial CO2 point sources (those emitting less than 100,000 tCO2/y), transportation, direct energy use in commercial and residential building sectors, land use, agriculture, and similar activities. Nevertheless, the catalogued emissions from these large stationary CO2 point sources together represent 64 percent of the total CO2 emissions for China in 2005 as reported by Boden et al. (2009). The methods and results presented here on documenting the large stationary CO2 point sources in China expand on the work initially published by Dahowski et al. (2009) and Li et al. (2009).
2.1 Data Challenges Given that China is growing at such a phenomenal rate and that data issues make it difficult to obtain fully complete and accurate data on industrial sectors, it was not possible within the time and budget constraints of this project to perform a fully detailed and current accounting of all large CO2 point sources. Examples of some of the policies driving rapid changes for industrial plants in China became more widely recognized as China prepared to host the 2008 Summer Olympic Games.2 Therefore, the focus was to compile the most detailed and accurate accounting of the key industries possible subject to data constraints. Further, it was not possible to examine some key new industries that are beginning to develop in China, such as coal-to-liquids production. A critical continuing research need is therefore to update the CO2 source data with more recent data as they become available. Nevertheless, the current compilation of CO2 point sources resulting from this study provides a solid foundation for the development of cost curves for CO2 transport and storage in China.
1
This 100,000 tonne/yr threshold has been applied in similar studies for other regions of the world, including North America (see Dahowski et al. 2005), Europe (see Wildenborg et al. 2005), and others. 2 Additionally, there has been a push by the Central Government over the last several years to shut down thousands of the smaller, less efficient power and other industrial plants and replace them with a smaller number of larger and more efficient plants. There have also been reports that up to 20% of the power plants in China are illegal, built to meet local demands but not authorized or recognized and reported by the Central Government (Oster 2006). Such actions all combine to make it difficult to compile a thorough and updated accounting of large CO2 point sources in China.
2.1
2.2 Building the CO2 Point Source Database The following sections describe the process applied for compiling the data on the large CO2 point sources in China, and estimating their emissions.
2.2.1
Electric Power Sector
Given the tremendous growth rate of China’s electric power sector, and the scale of emissions from power generation fueled predominantly by coal, an extra effort was made to ensure that the sources from this sector were as current as reasonably possible. To accomplish this, the World Electric Power Plants (WEPP) Asia Database was used with data current to 2007 (WEPP 2007). For China, WEPP contains data on 6,060 electric power generating units of all fuel types (including coal, gas, oil, renewables, nuclear and other non-fossil fuels) ranging in size from 0.007 to 7400 MW, in a variety of stages including planning, construction, operation, and retirement. The method applied to develop plant level data on large CO2-emitting power plants was as follows. Because for this study we are interested only in those plants that emit significant CO2, any non-fossilfueled generating units (e.g., hydro, nuclear, solar, wind) as well as those very small fossil units with capacities less than 10 MW, were filtered out of the set. Additionally, due to the greater uncertainty associated with planned plants, only the units whose status was listed as “operating” were selected. As a result, this provided a database of 2,035 fossil-fueled units that were operating as of 2007. CO2 emissions for each of these units were estimated based on reported fuel and technology type, capacity, and assumptions for capacity factor and CO2 emissions factors shown in Table 2.1. Table 2.1. Capacity Factor and CO2 Emissions Factor Assumptions for Power Generation Capacity Factor
Emissions Factor, g CO2/kWh
Coal, sub-critical
0.85
1000
Coal, supercritical
0.85
920
Gas
0.4
400
Oil, steam
0.7
500
Oil, comb. turbine or internal combustion
0.4
500
Fuel Class & Technology
Units were then removed that didn’t meet the 100,000 tCO2/yr threshold, resulting in 1,984 units with combined estimated annual CO2 emissions of 2,811 MtCO2. Coal-fired units represent the overwhelming majority of these, accounting for 94% of the number and a full 98.5% of the total estimated emissions. Finally, these generating unit data were aggregated to the plant level for 629 different plants.
2.2.2
Other CO2 Emitting Sectors
The other industrial sectors examined within the scope of this study include: cement, iron & steel, petroleum refineries, ammonia, ethylene, ethylene oxide, and hydrogen. Initial data for these sectors originated from the worldwide inventory of large CO2 sources as compiled and frequently updated by the 2.2
IEA Greenhouse Gas R&D Programme (IEA GHG 2002a, 2006) plus recent efforts by Liu et al. (2006a). These data for China provided a starting point from which to move forward and gather additional data. The process for all of these sectors involved locating available information from a variety of sources, including industry, company, and enterprise databases and websites, and product databases. Enterprise locations (city and province) were identified from these databases and web searches, and corresponding latitude and longitude coordinates were assigned based on city center of each location. Emissions were estimated based on available plant capacities and productivities, as noted below:
ECO2 EF P1 A T where ECO2 are the estimated annual CO2 emissions, EF is the appropriate CO2 emissions factor, P1 is the productive capacity, A the productive rate, and T the full time load in hours. For instances where only production values were available, this calculation method reduces to:
ECO2 EF P 2 where P2 represents annual production for the specified source. The emissions factors applied to each of these sectors are shown in Table 2.2. Though the data sources vary, the CO2 source estimates for the nonpower sectors are estimated to be current to at least 2004, some more recent. Results for these non-power sectors indicate that there are 994 large (100+ ktCO2/yr) plants, emitting a combined 1,081 MtCO2/yr. The majority (56%) are cement plants, followed by ammonia plants, iron and steel mills, and refineries. Table 2.2. Emission Factors (Ton CO2 per Ton of Output) by CO2 Source Type Sector Cement
0.882(a)
0.867(b)
1.111(c)
Steel & Iron
1.270
Refineries
0.219
Ethylene
2.541
Ammonia
3.800
Ethylene Oxide
0.458
Hydrogen
6.150
a b c d
2.2.3
CO2 Emissions Factors 1.102(d)
Dry method1 Dry method2 Wet method1 Wet method2
Quality Assurance
Quality assurance was performed on the resulting data and emissions estimates for the power sector by comparing the results to the estimates developed and published by Carbon Monitoring for Action (CARMA 2007). Resulting emissions estimates were considered to be well within reasonable error
2.3
bounds considering the differing methodologies and approaches employed. However, it was quickly determined that the accompanying coordinate data for many of the Chinese power plants contained significant inaccuracies (e.g., geographic coordinate data that placed a given facility in the wrong province), requiring significant reconciliation. This arduous task was accomplished by checking each of these points and their stated city and province with a global coordinate database as well as with significant searching and visual inspection with Google Earth. Similar quality assurance was performed on the other point source data though with significantly fewer issues. As a result of the time invested in improving these data, the resulting CO2 sources dataset is largely representative of China’s large industrial CO2 point sources and provides a strong basis for this analysis.
2.3 Characteristics of Large CO2 Point Sources in China Figure 2.1 is a map showing the locations of the resulting 1,623 CO2 point sources that each emit at least 100,000 tonnes of CO2 per year. The combined annual CO2 emissions from these sources are estimated at over 3,890 MtCO2. The majority of the sources are concentrated along the coastal zones, with 58% of the sources being located within the East and South Central regions. Within China, 35% of all the CO2 emitted by these large point sources is produced in the East region; 21% each in the North and South Central regions; 8% each in the Northeast and Southwest regions; and 6% in the Northwest region. Table 2.3 identifies the individual provinces, municipalities, and autonomous regions comprising each of these six administrative regions, along with total area and population estimates (NBS 2008) and resulting number of large CO2 point sources and their total annual emissions. A closer examination of these figures provides a more complete picture of the regional distribution of population density and industrial activity and related CO2 emissions. In addition to having the largest number of large CO2 point sources and highest resulting emissions, the East region also leads in emissions density from these large sources as well as total population and population density. The East is second in per capita emissions from the identified large CO2 point sources, trailing only the North, which is second in total annual emissions. The South Central is also a highly industrialized region and has the second highest population of the six regions; it also has the second highest CO2 emissions density. The Northeast and Southwest regions have very similar CO2 source and emissions numbers, yet the Southwest is three times larger and most industrial activity occurs in the easternmost part of the region, with the sparsely populated Tibetan Plateau comprising much of the remainder. The largest of China’s administrative regions, spanning over 3 million square kilometers, is the Northwest region which has the lowest number of CO2 sources as well as annual emissions, emissions density, and population.
2.4
Figure 2.1. Map of Large CO2 Point Sources by Type, Size, and Administrative Region Table 2.3. Provinces, Municipalities, and Autonomous Regions and Combined Area, Population, and CO2 Emissions by Administrative Region Administrative Region
Provinces, Municipalities, Autonomous Regions
East
Anhui, Fujian, Jiangsu, Jiangxi, Shandong, Shanghai, Zhejiang
Population (million, 2007)
CO2 Sources
MtCO2/y
792,741
379.8
588
1,361.5
Beijing, Hebei, Inner Mongolia, Shanxi, Tianjin
1,555,105
154.9
254
819.9
Northeast
Heilongjiang, Jilin, Liaoning
787,300
108.5
159
326.9
Northwest
Gansu, Ningxia, Qinghai, Shaanxi, Xinjiang
3,107,900
96.2
129
250.7
South Central
Guangdong, Guangxi, Hainan, Henan, Hong Kong, Hubei, Hunan, Macau
1,014,033
372.3
349
805.9
Southwest
Chongqing, Guizhou, Sichuan, Tibet, Yunnan
2,365,700
195.0
144
327.1
North
Area, km2
2.5
Power generation accounts for 73% of the total annual CO2 emissions from all of these cataloged sources, and as noted earlier the vast majority of the power sector emissions are from coal-fired units. Cement plants contribute 14% of the total annual CO2 emissions, as shown in Figure 2.2, followed by Iron & Steel, Ammonia, Refineries, Ethylene, Ethylene Oxide, and Hydrogen. Figure 2.3 provides a summary of CO2 emissions from these sources by both region and sector, highlighting the variation in sectoral contribution to emissions throughout the different parts of China.
Refinery 2%
Ammonia 3% Ethylene 1% Cement 14%
Ethylene Oxide 35)
100
0
Shallow (< 2000m)
Low (≤ 35)
66
33
Deep (≥ 2000m)
High (> 35)
33
66
Deep (≥ 2000m)
Low (≤ 35)
0
100
Capacity estimates were calculated at the basin level utilizing field level data where available. As with the gas basins, data on oil field locations were used to aggregate producing fields to sub-basin levels where possible, in order to provide higher resolution results in following source-reservoir matching and cost analyses. Where sub-basin groupings were developed, the basin total capacities were apportioned to the resulting sub-basins according to field-level resource size classifications as designated by the Chinese Department of Cadastral Management of the Ministry of Land and Resources (2000). Figure 3.4 shows the location of the oil basins and sub-basins examined here as having potential for storing CO2.
3.9
Figure 3.4. Map Showing Major Oil Basins and Sub-Basins Evaluated in This Analysis To facilitate source-reservoir pairing and the associated costing methodology, basins or sub-basins with calculated capacities less than 2 MtCO2 were eliminated from the dataset. This threshold value for reservoir capacities is driven by the combination of the 20-year commitment requirement and the minimum annual emissions cutoff for sources of 100 ktCO2/yr.1 Thus, 2 MtCO2 is the minimum capacity required for a formation that could be used to store the emissions from the smallest CO2 source included in this analysis for the 20-year time commitment required by the base assumptions employed in this analysis. In all, there were 3 onshore oil basins that were evaluated but excluded from the analysis because they did not meet this minimum capacity threshold. Final capacity estimates and potential additional oil production for each EOR basin are presented in Table 3.6. In total, the final 16 onshore and 3 offshore basins evaluated here with individual capacities greater than 2 MtCO2 have a total estimated CO2 storage capacity of 4,800 MtCO2 – of which 4,600 MtCO2 is found onshore. If CO2-EOR proves as successful in these Chinese oil basins as modeled, the injection of CO2 could result in as much as 6,700 million barrels of incremental oil recovery onshore, and 280 MBO offshore.
1
The 20-year commitment and annual emissions threshold are discussed in greater detail in Section 4.1, where the methodology and key assumptions for the geospatial and economic modeling are presented.
3.10
Table 3.6. Onshore and Offshore Oil Basins in China, with Estimated CO2 Storage Capacity and Potential Additional Oil Production via CO2-EOR Estimated Estimated Additional Oil Capacity (MtCO2) Recovery (MBO) Songliao Basin 2,510 1,570 Bohai Bay Basin 1,860 1,490 Liaohe Depression 540 440 Ordos Basin 700 360 Junggar Basin 340 200 Turpan-Hami Basin 160 120 Subei Basin 130 100 Qaidam Basin 130 81 Tarim Basin 89 69 Nanxiang Basin 120 65 Erlian Basin 51 31 Jianghan Basin 30 24 Sichuan Basin 32 20 Jiuxi-Jiudong-Huahai Basin 25 15 Yilanyitong Basin 17 14 Yanqi Basin 8 7 Total Onshore Capacity 6,740 4,610 Bohai Bay Basin 160 130 Pearl River Mouth Basin 89 41 Beibu Gulf Basin 34 18 Total Offshore Capacity 280 190 7,020 4,800 TOTAL CHINA CAPACITY - OIL BASINS Offshore
Onshore
Major Oil Basins
3.4 Unmineable Coal Seams and Enhanced Coalbed Methane Recovery The storage mechanisms utilized for this class of geologic formations are fundamentally different from those employed in deep saline, gas- and oil-bearing formations. Rather than hydrodynamic and dissolution trapping processes, coals store CO2 by chemically incorporating it via adsorption onto the cleat structures of the coal. Often, these structures already contain methane, but because CO2 results in a more stable chemical bond, injecting CO2 into the coals allows the methane to be released from the coal itself which can then be produced to the surface for recovery, cleanup, and sale. During the process, CO2 is preferentially adsorbed onto the coal surfaces, resulting in isolation of the CO2 from the atmosphere. This process, known as CO2-driven enhanced coalbed methane recovery (CO2-ECBM), while not yet a commercial technology, is being investigated to address technical issues and move the process closer to commercial deployment (Metz et al. 2005). The authors have chosen to include capacity estimates for ECBM and to include it in the cost curve analysis to provide a basis for understanding the potential role that ECBM-based storage may play in China should the technology become mature and economic enough for wide-scale use.
3.11
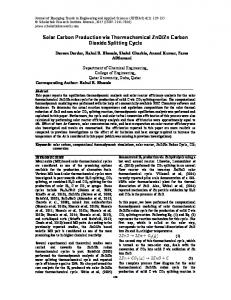
Spatial data on China’s major coal-bearing regions were obtained from the United States Geological Survey (2000) and supplemented by additional and higher-resolution data where available. Figure 3.5 shows the coal basins in China that were analyzed in this study.
Figure 3.5. Map Showing the Location and Extent of Major China Coal Basins Analyzed in This Study Key characteristics of the coal resource within each basin were compiled to estimate CO2 storage capacity and potential for recovery of additional coalbed methane via CO2-ECBM based on the method outlined below. Coalbed methane reserves were estimated as a fraction of total coal reserves in each basin known to have coalbed methane potential (based on Liu et al. 2005). Because few data exist on the areal extent of CBM fields in China, and a definitive understanding of what will constitute unmineable coal has not been determined, the following relationship has been applied in order to estimate CO2 storage capacity for this potential storage option without complete information (from Hendriks et al. 2004): n
10
SCO2 a CO 2 (Gi .C ij / C i RFij ERij ) i 1 j 1
3.12
where: a is the fraction of a coal basin that contains recoverable coalbed methane. This value was assumed to be 10% Gi is the coalbed methane resource in reservoir i Cij is the coalbed methane resource in coal type j within reservoir i Ci is the total coalbed methane resource of reservoir i RFij is the assumed coalbed methane recovery rate of coal type j within reservoir i ER is the volumetric replacement ratio of CO2 to CH4 of coal type j within reservoir i
CO2 is the density of CO2 This method assumes that the entirety of the recoverable coalbed methane resource (located within 10% of each coal basin) is suitable for CO2 storage via displacement of methane. Replacement ratio and recovery rate were estimated for each coal type found in China, as shown in Table 3.7 below. Table 3.7. Assumed Replacement Ratios and Recovery Rates for the Ten Coal Type Categories Identified for Chinese Coal Basins (From Liu et al. 2005, based on Reeves 2002, Bustin 2002) Coal Class Lignite Non-caking coal Weakly caking coal Long flame coal Gas coal Fat coal Coking coal Lean coal Meager coal Anthracite
Replacement Ratio (CO2:CH4) 10 10 10 6 3 1.5 1 1 1 1
Recovery Rate 1.00 0.67 1.00 1.00 0.61 0.55 0.50 0.50 0.50 0.50
Total capacity in deep, unmineable coal seams via ECBM in China is estimated at approximately 12,000 MtCO2 within 45 major coal basins. These basins could potentially yield as much as 16 Tm3 (565 Tcf) in recovered coalbed methane resource if and when ECBM proves to be a viable commercial scale process and the assumptions made here bear out in practice. Table 3.8 lists the 45 coal basins analyzed, along with the estimated CO2 storage capacity and total potential coalbed methane reserves of each basin. Note that again, a minimum threshold capacity of 2 MtCO2 was required in order for basins to be included for further analysis.
3.13
Table 3.8. Estimated CBM-Based Storage Capacities for 45 Major Coal-Bearing Basins in China, and Associated CBM Reserves Total CBM Potential (Million m3)
Coal Bearing Region Ordos Basin & Hedong-Weibei Turpan-Hami Basin Santang Lake Eastern Junggar Qinshui Basin Ili Basin Northern Junggar Southern Junggar Sanjiang & Muling River Datong-Ningwu Huainan Yanqi Basin Liupanshui Eastern Tarim Southern Sichuan-Northern Guizhou Xuzhou-Huaibei Zhangjiakou Northern Yellow River Western Henan Tangshan Eastern Piedmont of Taihang Mountains Xuanhua-Yuxian Helan Mountains Northern Tarim Nothern Qaidam Daqin-Wula Mountains Qilian Beijing Jingyuan-Jingtai Dunhua-Fushun Eastern Sichuan North Qilian Corridor Kumming-Kaiyuan Beipiao Tiefa-Fuxin Yilan-Yitong Baise Yanbian Pingxiang-Leping Lianyuan-Shaoyang Nanning Chenzhou-Zixing Panzhihua (Dukou)-Chuxiong Yongan-Xingning Suzhou Zhejiang Anhui Province region TOTAL CHINA CAPACITY - COAL BASINS
3.14
4,820,400 1,868,200 838,200 551,300 3,100,100 496,700 518,200 436,600 218,700 282,000 271,000 201,000 521,500 169,800 398,400 173,600 64,600 145,700 190,200 124,100 189,100 31,300 146,900 62,600 22,200 14,400 37,400 42,700 36,400 5,900 51,200 10,100 5,500 7,600 6,600 3,200 3,300 2,800 19,700 16,800 2,100 14,400 6,700 12,200 5,200 16,146,600
Estimated Capacity (MtCO2) 4,450 2,200 990 650 610 560 530 340 240 160 120 120 110 100 79 78 72 68 56 55 51 44 38 36 30 27 25 25 14 11 11 11 10 8 7 6 5 5 4 4 3 3 2 2 2 11,970
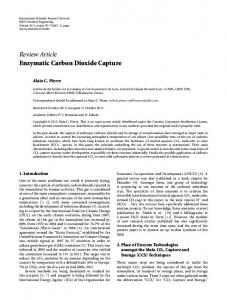
3.5 Summary of Candidate Storage Reservoirs Table 3.9 shows the total estimated storage capacities in each formation type (for both onshore and offshore basins), as well as the total capacity over all formation types in China. Overall, there is estimated to be the potential for over 2,300,000 MtCO2 of storage capacity in onshore basins in China, and some 780,000 MtCO2 in relatively near offshore basins. Deep saline-filled sedimentary basins account for over 99% of the total calculated storage capacity, echoing findings in other parts of the world regarding the central importance of this class of reservoirs for large-scale CCS deployment. This represents a significant resource, at a similar scale as found in other major industrialized areas such as North America (Dahowski et al. 2005) the European Union (Wildenborg et al. 2005), Australia (Bradshaw et al. 2004) and elsewhere, and is likely to serve China well should broad, large-scale deployment of CCS be desired as a method of addressing greenhouse gas emissions within China. While small relative to the extremely large theoretical CO2 storage resource found in deep salinebearing sedimentary formations, China also appears to possess a significant storage resource in valueadded storage formations—those formations that might provide offsetting revenue via the co-production of hydrocarbon commodities. Though small and likely of limited duration relative to DSF-based storage, China’s value-added capacity represents a potential suite of opportunities for early demonstration of CCS that may also yield economic benefits as incentives to Chinese and international partners hoping to develop pilot projects. Figure 3.6 is a map showing all of the candidate CO2 storage reservoirs in China identified and analyzed in this report. Table 3.9. Total Capacities and Resulting Number of Formations within the Four Major Storage Formation Classes Analyzed
Formation Type Deep Saline Sedimentary Basins Onshore Offshore Depleted Gas Basins Onshore Gas Fields Offshore Gas Fields Depleted Oil and EOR Basins Onshore Oil Basins Offshore Oil Basins Coal Basins TOTAL CHINA CAPACITY
Number of Candidate Storage Formations 25 16 9 17 13 4 19 16 3 45 106
3.15
Estimated CO2 Storage Capacity (MtCO2 ) 3,066,900 2,288,200 778,700 5,180 4,280 900 4,800 4,610 190 11,970 3,088,850
Figure 3.6. Map Showing the Combined Location and Extent of Candidate Geologic CO2 Storage Formations Analyzed in This Study
3.16
4.0 Cost Curve Methodology This chapter presents the core methodology and assumptions applied to the development of the cost curves for CO2 transport and storage for China. Most of the methodology is based on the existing capabilities of the Battelle CO2-GIS geospatial techno-economic modeling tool and follows the procedures applied and outlined by Dahowski et al. (2005). A review of the methodology follows, with special emphasis on updates to data and assumptions that have been made to reflect both more recent cost estimates as well as factors that are specific to the expected costs of deploying CCS in China. It is important to note that development of this methodology and the resulting cost analyses often required the application of assumptions for key parameters impacting final costs of CO2 transport and storage in China. As a guiding principal, the authors approached these assumptions as realistically as possible, yet tending to err on the side of overestimating, rather than underestimating, resulting costs. The estimates presented here are thus considered “conservative” as discussed in the following sections.
4.1 Modeling Approach The primary focus of this study – the development of cost curves for commercial-scale CCS in China – is accomplished via the application of the Battelle CO2-GIS economic modeling tool. The basic approach centers on the pairing of the set of CO2 sources and candidate storage reservoirs within a system, subject to a set of constraints: Source-Reservoir Pairing – First, utilizing geospatial and technoeconomic capabilities within the CO2-GIS model, the entire set of possible source-sink combinations is determined within a specified maximum search radius. Levelized costs for CO2 transport and storage (including site characterization, measurement, monitoring and verification and other aspects of a complete storage system as detailed below) are calculated for each pair, based on the distance between, and characteristics of, the source and selected reservoir. Competition and Societal Cost Minimization – Because there may be many sources seeking to store their CO2 into a select candidate storage reservoir, a least-cost optimization process is run to determine which source(s) may be allowed access. The cost optimization seeks to minimize overall societal costs by seeking the CO2 storage projects with the lowest overall per-ton costs. The selection process is further constrained by the estimated CO2 storage capacity of each reservoir, limiting the volume of CO2 – and hence the number of CO2 sources – that can be accepted. As a result, each source is paired with its lowest-cost acceptable storage reservoir, which may be, but is often not, the source’s first choice. In some cases, a source will not be able to locate a storage reservoir capable of accepting its CO2 within the search radius, and the source in this case – along with its CO2 – will be considered to be stranded. Reservoir Filling Constraints – Each reservoir is allowed to be matched with the set of lowest-cost sources that have selected it up until the point at which the reservoir capacity has been fully allocated. In order to ensure that project investment time horizons are realistic, and to prevent a given reservoir’s capacity from being completely exhausted within only a few years (and requiring sources to build new
4.1
transport and injection infrastructure after such a short time period), an additional constraint is imposed within the optimization such that a reservoir must have enough available capacity to store a paired source’s CO2 for a minimum of 20 years.1 Base Project Economic Assumptions – For the purposes of this analysis, project lifetimes were assumed to be 20 years. All costs are expressed in 2005 US dollars. An annual discount rate of ten percent was assumed, resulting in an annual capital charge rate of 11 percent. Where costs in other base years were used, these costs were inflated or deflated to 2005 dollars using the U.S. consumer price index adjustment (USBLS 2009). Further, in an attempt to modify these costs (most of which are based on U.S. assumptions) to values likely to be borne by projects deployed in China, a relative scaling factor was applied. Scaling factors of 90% for capital costs and 80% for the more labor-intensive O&M costs were assumed, based on factors assigned within the IEA Energy Technology Perspectives model (Gielen 2003). Gielen presents cost multipliers for 15 regions of the world, including China, relative to the United States. These multipliers – 90% of U.S. costs for investment and 80% for both fixed and variable O&M – are reported to be forward looking and valid out to 2050, and higher than historical values. These scaling factors are applied on top of each of the respective resulting capital and O&M costs, which are documented in the following sections.
4.2 CO2 Source Assumptions There are a number of important assumptions regarding the development and application of the CO2 point source data that have a significant impact on the calculation and interpretation of the CO2 transport and storage cost curves for China. These include the following: Capture Cost – The cost of capturing CO2 from the flue gas or process stream of each identified source is outside the scope of this particular study. Capture costs are therefore not included in the overall costs estimated for each source-reservoir pair. Future analyses will be able to integrate costs of CO2 capture into the overall CCS project cost estimates to provide a more complete assessment of likely endto-end CCS system costs. Compression and Dehydration Costs – The costs associated with dehydrating and compressing captured CO2 to prepare it for pipeline transport are likewise outside the scope of this current study. These costs are therefore purposefully neglected in this analysis and each CO2 point source is assumed to deliver a uniform, compressed, pipeline-ready supercritical CO2 stream to a pipeline at the plant gate. This is an important modeling assumption as it indicates that the operators of potential CO2 storage reservoirs will be indifferent as to the type of source (and specific source) supplying the CO2 for storage. Minimum Emissions Cutoff – The present study, like others before it (see Dahowski et al. 2005, Wildenborg et al. 2005, IEA GHG 2002b), does not consider CO2 point sources that emit less than 1
In the North American Cost Curve Study (Dahowski et al. 2005) a 10-year filling constraint was imposed in the Reference Case and a 20-year case was examined in a sensitivity analysis. As a result of that and subsequent analyses, a 20-year constraint was selected for this study to better represent the longer-range investment and infrastructure requirements likely to be associated with CCS projects.
4.2
100,000 tonnes of CO2 per year. This assumption is rooted in the common belief that given the capitalintensive nature of CCS and economies of scale working against them, very small CO2 point sources will be far less likely to invest in CO2 capture and storage systems compared to much larger sources. Retired or Planned Sources – This analysis ignores CO2 point sources that have been identified as either no longer or not yet operational. With industries growing as fast as they are in China, it is challenging to maintain an up-to-date catalog of plants and accurately track the status of planned or retired facilities. This challenge is compounded by data availability issues; yet, the intent has been to focus on sources that were operating at the time of data collection. Due to the geography-dependent nature of the source-sink pairing methodology, the current study is unable to examine projected growth rates for specific industries and estimate the impacts on the demand for and costs of CCS. The methodology may be modified to include such estimates in the future. Capture Efficiency – A constant capture efficiency of 90% has been applied equally to all CO2 sources. This assumption is consistent with Metz et al. (2005) and based on the idea that while it might be technically possible to capture nearly all of the CO2 in a given process stream that in reality it will typically be economic to capture 90% of the CO2 with 10% vented to the atmosphere (for those streams that are amenable to CO2 capture). As a result, the mass flow rate of CO2 that is transported and injected into a storage reservoir represents 90% of the total annual emissions for each source.
4.3 CO2 Transport Costs Though offshore CO2 storage opportunities may be important for the highly industrialized coastal regions of China that may be otherwise limited in nearby onshore storage options, the focus of the present analysis is on CO2 storage in onshore basins. Broadening the evaluation to consider the potential and costs for storage in offshore formations will provide a useful follow-on analysis; yet, this initial assessment of onshore CCS opportunities will nevertheless provide significant value in identifying CO2 sources that have higher-than-average storage costs, or that are stranded by their lack of proximal onshore storage reservoirs. The capacities presented in Chapter 3 include preliminary estimates for offshore basins to support future sensitivity analyses that allow these basins to compete against onshore storage options in order to examine the tradeoffs between higher per-distance transport and additional costs associated with offshore storage, and the lack of lower-cost opportunities onshore. Therefore, land-based pipelines are assumed to provide all CO2 transport needs in this analysis. They are the preferred method for transporting the quantities of CO2 being examined here, from CO2 point sources to onshore candidate CO2 storage formations. A further modeling assumption is that each source will have its own dedicated pipeline to transport its CO2 to selected storage reservoir. In reality, some coordination would likely be sought where appropriate and where timing and proximity might incentivize joint investment. However, Wildenborg et al. (2005) demonstrated in an analysis centered on the European Union that there was no significant cost savings resulting from highly networked pipelines, and the authors feel that dedicated source-reservoir pipelines provide a reasonable and conservative basis for examining transport costs in this type of analysis. The cost estimates and modeling assumptions for onshore CO2 pipelines used in this study are as follows:
4.3
Pipeline Costs – Capital costs associated with pipeline infrastructure development were calculated using the following relationship derived using multivariate regression analysis of 10 years of recent U.S. onshore natural gas pipeline costs reported to the Federal Energy Regulatory Commission (Smith 2006).2 All costs were adjusted to 2005 dollars, with high and low cost outliers for each size category excluded. Finally, empirical data on CO2 pipeline flow rate and diameter from operating CO2 pipelines in the U.S. was applied to develop the following pipeline cost algorithm: Pipeline cost ($) = d · 398,519 · Q (0.4055) + 466,464 Where d is the pipeline length (in miles) and Q is the average annual CO2 mass throughput (in MtCO2/y). For the purposes of this study, annual O&M costs are assumed to be 2.5% of capital, as suggested by McCollum and Ogden (2006) based on their review of a number of CO2 transport studies, and similar to what has been applied in previous work (Dahowski et al. 2005). Pipeline Assumptions – The base transport distance required for each source-reservoir pair is determined by the CO2-GIS as the distance between them. To that straight-line distance, a 17% routing factor is added plus an additional 25 miles to allow for additional pipeline needed to access a suitable injection site within a given storage formation.3 Thus, a CO2 source and storage reservoir that are colocated (distance from source to sink is zero miles) would still incur minimum transport costs associated with a 25-mile long pipeline. At this time no additional factors have been included to account for varying terrain or other cost impacts at this scale.
4.4 CO2 Storage Costs This section summarizes the costs modeled for the various aspects of CO2 storage, including site characterization, infrastructure development, O&M, site monitoring, and costs and revenues associated with value-added CO2 storage (via enhanced oil and coalbed methane recovery).
4.4.1
Site Characterization
Based on recent published estimates, the average cost to drill and log site characterization wells will be roughly $3,000,000 (per well, each covering a 25-square-mile increment of project area); the cost of acquiring seismic data will be approximately $100,000 per square mile; and the costs associated with data analysis from each of these efforts will account for an additional 30 percent of data acquisition costs (McCoy and Rubin 2009). Early versions of this work assumed a constant area of review of five square miles, requiring $500,000 of seismic data acquisition, coupled with the $3,000,000 characterization well and $1,050,000 in associated data analysis costs, yielding a flat per-project cost characterization cost of $4,550,000 (Dahowski et al. 2009). However, because the area requiring characterization will vary 2
Very few data on pipeline costs in China are available and therefore for the present study the application of U.S.based costs have been adopted and assumed to represent a reasonable estimate at this time of expected costs for pipelines in China. 3 Note that this is greater than the 10-mile transport adder that has been applied previously for analyses in the U.S. (Dahowski et al. 2005). A longer 25-mile minimum pipeline distance was selected for this study due to the comparatively lower spatial accuracy for the CO2 point source data and lower resolution of the candidate storage basin outlines that are available for China.
4.4
significantly from one project to the next depending not only on the ultimate stored volume of CO2 but also on the individual characteristics of the formation into which its CO2 is being injected (driven primarily by thickness, porosity and solubility), the approach was updated to better account for the realworld variations in area of review that would be expected from one project to the next. While it is currently impractical to calculate the area of review for every source-sink pair evaluated within this analysis, areas were estimated as a function of the total lifetime injection volume for a given source, and the average storage density of the matched sink. For DSFs, storage density was simply calculated by dividing the total capacity by the basin’s area to arrive at an average capacity per unit surface area. Because data on field areas were not available for gas fields, the storage density value applied for a given DSF was also applied to gas fields within the same basin. For coals, based on the assumption (see Section 3.4) that ten percent of each coal basin’s area is suitable for coalbed methane recovery, the area of each basin was reduced by 90 percent when calculating storage density. For oil fields, average field areas were calculated for each oil-bearing basin based on field area data and these areas were used in calculating storage density for oil-based capacity. Per-project characterization costs calculated using this updated method range from $4 million to over $700 million for the Reference Case (as described in Chapter 5), with per-ton costs ranging from $0.35/tCO2 to over $140/tCO2, averaging about $2/tCO2. The large variation in resulting costs is driven primarily by the range in project size and the range in geologic settings and related parameters that both impact the likely areal extent of the CO2 plume. All else being equal, larger projects with higher CO2 flow rates generally result in higher total project costs yet lower costs on a per ton basis, while thicker and more permeable storage zones will result in lower project and per-ton characterization requirements. These costs, while higher than those assumed by previous studies (e.g., Dahowski et al. 2005), are utilized in this analysis to better account for the recent and steeply upward trend in wellfield services costs including drilling, logging and seismic services.
4.4.2
Well-Field Costs
The costs assumed for drilling, completing, operating and maintaining CO2 injection wells and oil and gas production wells (for EOR and ECBM) are described below. Note that, in all cases, vertical injection wells are assumed. Though directional wells have been used with great success by many hydrocarbon production projects as well as some early CCS projects (Knott 2008), the performance and cost effectiveness of directional wells is highly project specific and difficult to generalize at this time for an assessment at this scale. It is worth noting however, that by assuming only vertical wells this analysis might be overestimating a portion of the resulting costs in the long term if directional drilling becomes common for CCS. Well Capital Costs – Per-well capital costs for injection and production wells are based on regression analysis of onshore oil and gas well drilling cost data reported by the 2003 Joint Association Survey on Drilling Costs and presented in Augustine et al. 2006.4 In order to account for recent increases in drilling costs beyond standard inflation, costs were escalated based on an index derived from a summary of historical drilling cost trends as reported by the EIA Annual Energy Review (2008a).
4
See Section 4.4.5 for a discussion of modeled costs for monitoring wells.
4.5
Thus, well costs (for both production and injection wells) are estimated using the following expression: Well cost ($/well) = 1,000,000 · 0.1271e0.0008z + 530.7z where z is the depth of the well, in meters. Other Injection Field Infrastructure – Per-well field costs for flowlines and connections are estimated using the relationship presented by Bock et al. (2003), given here in 1999 dollars and converted to 2005 dollars prior to use: Per-well flowline & connection cost = 43,600 · (7,389 / (280n))0.5 where n is the number of wells in the field. Annual Wellfield O&M Cost – Using annual costs presented in the same paper by Bock et al., for normal daily expenses, consumables, surface maintenance and subsurface maintenance (repair and servicing), the following relationship is used to estimate operating and maintenance costs for the project well-field: Annual per-well O&M cost = 24,600 + [13,600 · (7,389 / (280n))0.5] + [(5,000z) / 1219] where n is the number of wells, and z is the well depth, in meters.
4.4.3
Estimating Injection Rates
The number of CO2 injection wells, as well as the number of oil and gas production wells for EOR and ECBM, is an important factor contributing to the overall cost of CO2 storage. While only limited and aggregate data is available on the geology of basins in China that may be suitable candidates for CO2 storage, available data has been augmented with assumptions as needed to estimate reasonable per-well injection rates for each different class of storage formation. Deep Saline Sedimentary Formations and Gas Basins – Variations in CO2 injection rates are an important economic driver of storage costs that, to date, have been largely neglected by studies of this type (e.g., Dahowski et al. 2005, Wildenborg et al. 2005) as a result of a lack of adequate data at the basin scale. However, it is clear that in general, formations with higher potential injection rates – governed primarily by permeability and injection interval thickness – will have lower associated per-ton costs than formations where per-well injection rates are not as promising, requiring the construction of relatively more injection wells to store the same volume of CO2. The European cost curve study (Wildenborg et al. 2005) applied a constant injection rate of 1,000,000 tonnes/well-y for deep saline formations based on the experience of the Sleipner project. In the development of cost curves for North America (Dahowski et al. 2005), a constant and overall conservative annual injection rate of 200,000 tonnes/well was assumed for all deep saline and gas formations; subsequent investigations indicate that expected injection rates vary considerably and are often significantly greater than this. For these reasons, the authors have chosen to incorporate a range of potential injection rates into the current analysis.
4.6
It is important to note that injection rates have not been quantitatively derived from the formation parameters shown, and do not constitute actual injection rates. Rather, they are intended to bin the formations (relative to each other) into Low, Moderate, High and Very high injection rate classes, within a reasonable range of possible injection rates, in order to resolve the relative impact of injection rate as a cost signal in the economic modeling. Because the global set of CO2 storage projects to date is still too small to provide any widely applicable statistical method of quantifying the true ability of a formation to accept CO2 under a wide range of conditions, it was necessary to apply several assumptions. The experience of the Sleipner project, with an injection rate of approximately 1,000,000 tCO2/yr via a single well, was used to benchmark the rate for the Very high rate class. However, to account for the fact that injection rates this high are unlikely to occur consistently throughout a basin, this maximum rate was adjusted downward to 800,000 tCO2/yr per well for the Very high rate class. The Algerian In Salah project was used to benchmark our assumptions for the Low rate class, where very low permeabilities (< 10 mD) and thicknesses (average 20 m) lead to a very low vertical well injection rate of around 40,000 tCO2/yr (Riddiford et al. 2004).5 While there are likely to be some formations in China with similar characteristics, because none of the basins in China show average aggregate values that are this low, this rate was adjusted upward to define the Low rate class as exhibiting an average per-well injection rate of approximately 100,000 tCO2/y. The Moderate and High classes were then defined by intermediate annual injection rate assumptions of 200,000 and 400,000 tCO2/well. The rates and classes assigned to each formation are intended to yield conservative cost estimates for DSFs, while still allowing for differentiation between basins of varying economic attractiveness. Table 4.1 shows the representative permeabilities and net sand thicknesses assumed for each formation based on available data, as well as the assigned injection class categories and the assumed annual injection rates associated with each assigned rate class.
5
Vertical well injection rate assumed to be 10% of horizontal injection rate per Benson (2006).
4.7
Table 4.1. Key Geologic Parameters, and Assumed Injection Rate Classes and Rates for the Major China DSFs Evaluated in this Study
Onshore Basin Bohai Bay Basin (Niaoning) Bohai Bay Basin (North of China) Erlian Basin Hailaer Basin HeHuai Basin (Henan/Huaibei/Huainan) JiangHan-Dongting basin Nanxiang Basin Ordos Basin Qaidam Basin Sanjiang Basin Sichuan Basin Songliao Basin Subei (Northern Jiangsu) Basin Tarim Basin Turpan-Hami Basin Western Taiwan Basin Zhunggar Basin
Representative permeability (mD) 1100 1000 75 1000 150 450 150 50 250 250